Synthesis,Structure Regulation and Characterization of Cadmium(Ⅱ)Complexes Based on Imidazole Carboxylic Acid Ligands
2021-11-18XIONGDingQiFUPengKuiLIYuYanZHANGXiaoYuYANGQingLinJIAMeiMeiZHUYanYanDONGXiuYan
XIONG Ding⁃QiFU Peng⁃KuiLI Yu⁃Yan ZHANG Xiao⁃Yu YANG Qing⁃Lin JIA Mei⁃MeiZHU Yan⁃Yan DONG Xiu⁃Yan
(School of Chemistry and Chemical Engineering,Lanzhou Jiaotong University,Lanzhou 730070,China)
Abstract:Two new cadmium(Ⅱ) complexes were synthesized by hydrothermal method with 2⁃(4⁃carboxy⁃phenyl)⁃imidazole⁃4,5⁃dicarboxylic acid(H3L)through the auxiliary ligands 1,10⁃phenanthroline(1,10⁃phen)and 1,4⁃bis(1⁃imidazolyl)benzene(dib)coordination regulation effect,[Cd2(HL)2(1,10⁃phen)2(H2O)2](1)and{[Cd(HL)(dib)0.5(H2O)2]·2H2O}n(2).1 and 2 were analyzed and characterized by single crystal X⁃ray diffraction,element analysis,thermo⁃gravimetric analysis,powder X⁃ray diffraction,infrared spectroscopy,Hirshfeld surface analysis,and density func⁃tional theory quantification calculations.Single crystal X⁃ray diffraction shows that 1 and 2 belong to the triclinic system and the P space group,and 1 forms a zero⁃dimensional structure,2 forms a one⁃dimensional chain struc⁃ture.CCDC:2044127,1;2044128,2.
Keywords:imidazole carboxylic acid ligand;cadmium(Ⅱ)complexes;structure regulation;characterization
0 Introduction
In recent decades,complex has attracted lots of attention,due to its multi⁃functional crystalline materi⁃als and interesting structure,which are based on the coordination bonding interaction between metal ions/clusters and bridging organic linkers.They stand out among polymer materials owing to their brilliant prop⁃erties,for instance,large surface area[1],adjustable structure[2⁃3],and high porosity[4⁃5].Considerable efforts have been made in synthesizing and researching new complexes,not only thanks to their intriguing struc⁃tures and distinctive topologies,but also due to their promising applications as functional materials in many fields as luminescence[6⁃8],catalysis[9⁃11],chemical sen⁃sors[12⁃14], magnetism[15⁃18], gas storage and separa⁃tion[19⁃21],and biology[22].
The fluorescent properties ofd10metal complexes have attracted the interest of many researchers.Espe⁃cially,thedorbital of Cd(Ⅱ) ion was filled with elec⁃trons,which can effectively reduce the energy loss caused byd⁃dtransitions,when connected to aπ⁃conjugated organic framework.It may exhibit good fluo⁃rescence properties[23⁃24].
In this work,we used 2⁃(4⁃carboxy⁃phenyl)⁃imid⁃azole⁃4,5⁃dicarboxylic acid(H3L)to connect with Cd(Ⅱ)and added auxiliary ligands to adjust the structure to construct complexes,Thesp2hybridization of N on the ring can increase theπelectronic density.The intro⁃duction of a functional carboxyphenyl group at 2⁃position of the imidazole ring(H3L)can produce more coordination modes[25⁃26].Both the O on the carboxyl group and the N on the imidazole can coordinate with Cd(Ⅱ),and N and O can form chelating coordination effect.So,H3LshowsmoreadvantagesthanotherN⁃orO⁃donor ligands.Here,under the same conditions,we synthesized two new Cd(Ⅱ)complexes(Scheme 1)through introduce auxiliary ligand,and studied their properties.
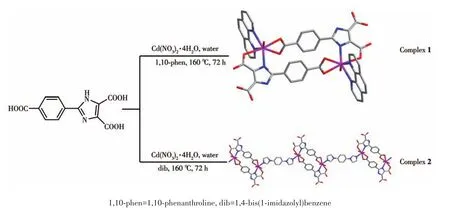
Scheme 1 Synthesis routes of complexes 1 and 2
1 Experimental
1.1 Materials and general methods
H3L was prepared according to the reported proce⁃dure[27⁃28].All chemical reagents and solvents were pur⁃chased from a commercial source,which was used with⁃out undergoing the purification process.The FT⁃IR spectra were recorded in a range of 4 000⁃400 cm-1on a Bruker VERTEX 70 spectrometer using KBr pellets.Elemental analyses(C,H,and N)were carried out on a VxRio EL elemental analyzer.Powder X⁃ray diffraction(PXRD)patterns were collected in a 2θrange of 5°⁃45°on a Philips PW 1710⁃based diffractometer with CuKαradiation(λ=0.154 184 nm)at room temperature,oper⁃ated at 40 kV and 100 mA.Thermogravimetric analysis(TGA)was performed on a PerkinElmer TG⁃7 analyzer heated from room temperature to 800℃under nitrogen at a heating rate of 10℃·min-1.Fluorescent analyses of the complexes were performed on an F⁃7100 Fluores⁃cence spectrometer.UV ⁃Vis DRS(UV ⁃Vis Diffuse Reflectance Spectroscopy)spectra were recorded on a U⁃3900H spectrophotometer.
1.2 Synthesis
1.2.1 Synthesis of[Cd2(HL)2(1,10⁃phen)2(H2O)2](1)
A mixture of Cd(NO3)2·4H2O (30.8 mg,0.10 mmol),H3L(13.8 mg,0.05 mmol),1,10⁃phen(9.9 mg,0.05 mmol),and H2O(8 mL)was placed in a 25 mL Teflon⁃lined autoclave and heated to 160 ℃ for 3 d.When the mixture was cooled to room temperature,light yellow block⁃shaped crystals of 1 were obtained with 65%yield(based on H3L).Analysis Calcd.for C48H32Cd2N8O14(%):C 49.29,H 2.75,N,9.58;Found(%):C 49.33,H 2.76,N 9.51.IR(KBr,cm-1):3 428(s),2 989(m),2 826(w),2 355(w),2 066(w),1 620(s),1 486(m),1 395(s),1 365(s),1 176(m),1 005(m),790(m),728(w),621(m).
1.2.2 Synthesis of{[Cd(HL)(dib)0.5(H2O)2]·2H2O}n(2)
The synthesis of 2 used the same condition as 1 except that 1,10⁃phen was replaced by dib.Clear color⁃less block crystals of 2 were obtained in 63%yield(based on H3L).Analysis Calcd.for C18H18CdN4O10(%):C 38.41,H 3.22,N 9.96;Found(%):C 38.43,H 3.23,N 9.99.IR(KBr,cm-1):3 420(s),2 985(m),2 831(w),2 716(w),2 362(w),2 062(w),1 620(s),1 490(m),1 422(m),1 398(m),1 365(s),1 175(m),1 049(w),1 005(m),882(w),793(m).
1.3 X-raydatacollectionandstructurerefinement
The diffraction data were collected at 296(2)K for 1,with a Bruker APEX⁃Ⅱ CCD area detector diffrac⁃tometer usingφandωrotation scans and MoKαradia⁃tion(λ=0.071 073 nm).The crystallographic data of 2 were collected with CuKαradiation(λ=0.154 184 nm)on SuperNova,Dual,Cu at zero,Eos at 296(2)K.Then absorption corrections were carried out.The structures were solved by the direct method and refined by the full⁃matrix least⁃squares onF2using the SHELX and Olex2 program[29⁃31].The data of 1 were processed by squeeze to remove disordered solvent water molecules.Non⁃hydrogen atoms were refined with anisotropic,and the hydrogen atoms were included in the final refine⁃ment by using geometrical restrains and refined isotro⁃pically using the riding model.Crystal data and struc⁃ture refinements for 1 and 2 and selected bond distanc⁃es and angles are given in Table 1 and 2,respectively.

Table 1 Crystallographic data and structure refinement parameters for 1 and 2
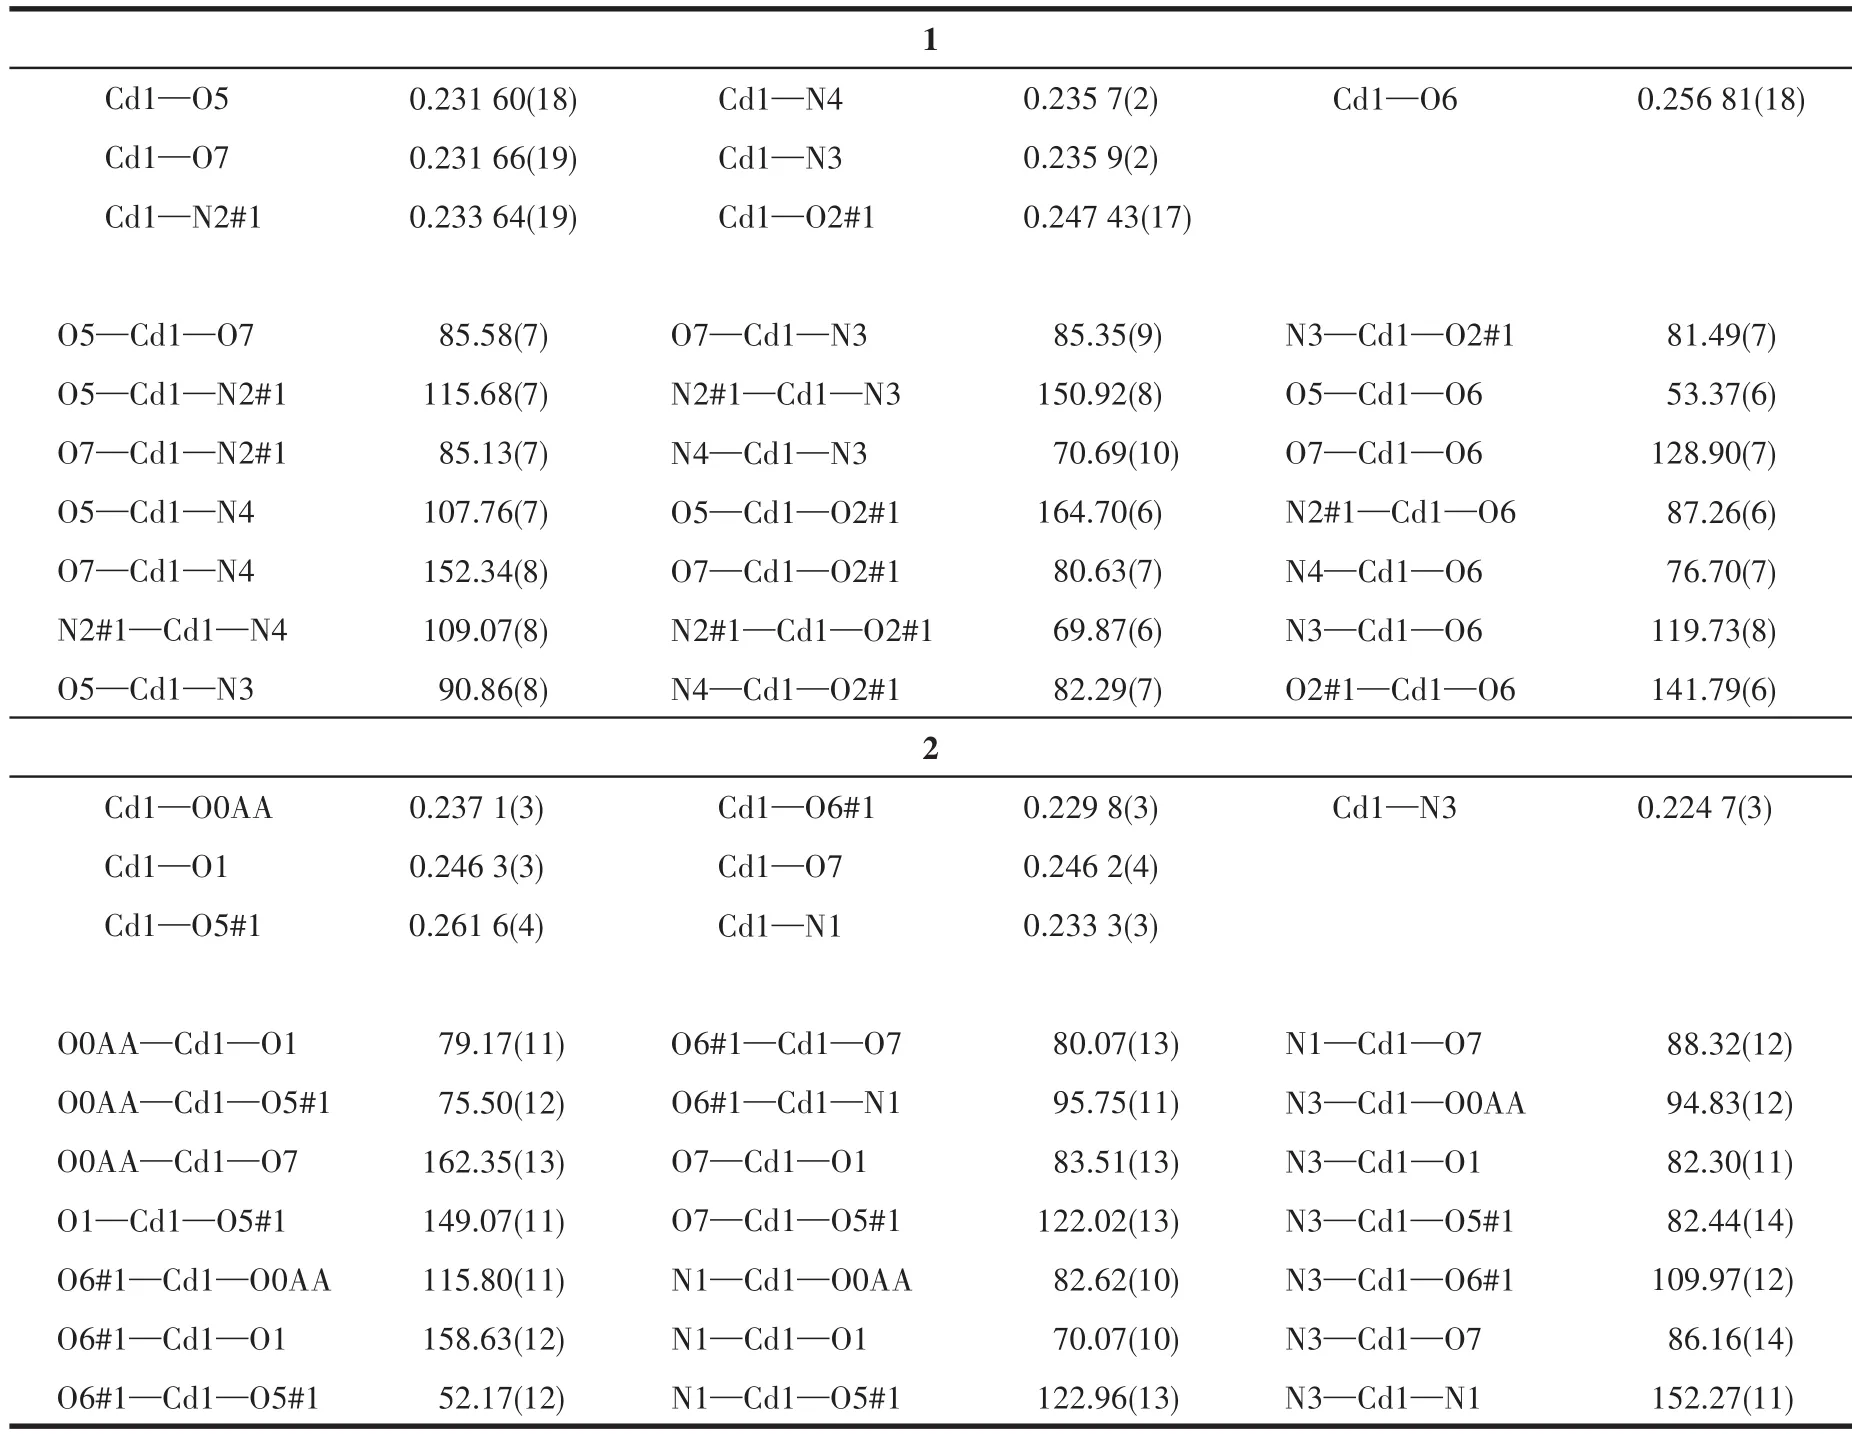
Table 2 Selected bond lengths(nm)and angles(°)of 1 and 2
CCDC:2044127,1;2044128,2.
2 Results and discussion
2.1 Description of crystal structure
2.1.1 Structural description for 1
Single X⁃ray crystallography shows that 1 based on H3L,1,10⁃phen,and Cd(Ⅱ) crystallizes in the triclin⁃ic system andPspace group.The asymmetric unit of 1 contains two crystallographically independent Cd(Ⅱ)cation,two(HL)2-ligands,two 1,10⁃phen ligand,and two coordinated water molecules.As depicted in Fig.1a,the Cd1 center is coordinated by three nitrogen atoms of one 1,10⁃phen ligand(N3 and N4)and one(HL)2-ligand(N2#1),four oxygen atoms of two different(HL)2-ligands(O2#1,O5,and O6),and one coordinated H2O(O7),adopting a distorted pentagonal bipyramid geometry.Two main ligands and two metal ions form a ring structure and then coordinate with the two chelat⁃ing auxiliary ligands,and the remaining N and O of the ligand are not further coordinated with Cd which leads to a 0D structure(Fig.1b).Intermolecular hydrogen⁃bonding interactions(O—H…O,Table 3)between a coordinated water molecule and the carboxylate of(HL)2-ligands and a C—H…πinteraction(Table 4)between the benzene ring and the imidazole ring of(HL)2-ligands are showed in Fig.1c.The interaction of O—H…O and C—H…π(Fig.1c,1d),theπ…πstack⁃ing interactions(Table 5)between benzene rings with the aid of 1,10⁃phen(Fig.1e)form supramolecular framework structure of complex 1(Fig.1f).

Table 3 Hydrogen bond parameters of 1 and 2

Table 4 Structural parameters of C—H…π interaction in crystal of 1*
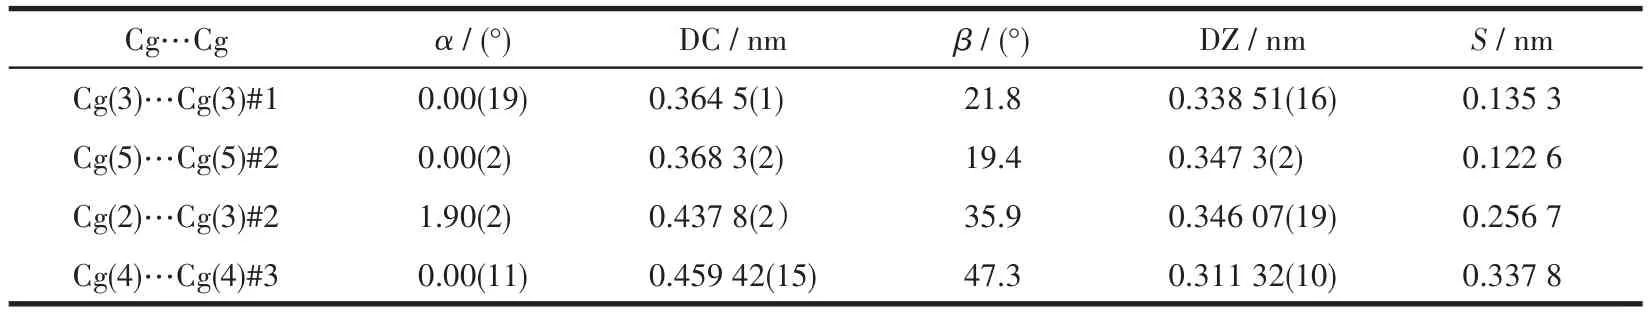
Table 5 Structural parameters of π…π interactions in crystal of 1*

Fig.1 (a)Coordination environment around Cd(Ⅱ)ions in 1 drawn with 30%probability displacement ellipsoids;(b)Unit cell of 1;(c)Hydrogen bonding in crystal of 1;(d)Supramolecular structure of 1 formed by hydrogen bonding;(e)π…π stacking in crystal of 1;(f)Supramolecular framework structure of 1 formed by hydrogen bonding and π…π stacking
2.1.2 Structural description for 2
The single⁃crystal X ⁃ray diffraction analysis reveals that 2 crystallizes in the triclinic crystal system with the space group ofP.The fundamental building unit of 2 consists of one crystallographically indepen⁃dent Cd(Ⅱ)ion,one(HL)2-ligands,half of dib ligand,and two coordinated water molecules.Cd1 adopts a dis⁃torted pentagonal bipyramid geometry,coordinating to three carboxylate oxygen atoms(O1,O5#2,and O6#2)from two different(HL)2-ligands,two water oxygen atoms(O7 and O0AA),and two nitrogen atoms from one dib ligand(N3)and one(HL)2-ligand(N1),respec⁃tively(Fig.2a).Under the regulation of the auxiliary li⁃gands,2 formed a different structure from 1,but 2 has the same ring as 1,also composed of two main ligands and two metal ions.The difference between 1 and 2 is that the two coordination sites of 1,10⁃phen in 1 are replaced by dib and water molecular in 2,and the dib acts as a bridging molecule to connect two rings to form a 1D chain structure(Fig.2b).Intermolecular hydrogen⁃bonding interactions(O—H…O and C—H…O,Talbe 3)between the coordinated water molecule and the carboxylate of(HL)2-ligand and(N—H…O,Talbe 3)between lattice water and(HL)2-are shown in Fig.2c,and the intermolecular weak interaction forming supra⁃molecular structure are shown in Fig.2d.
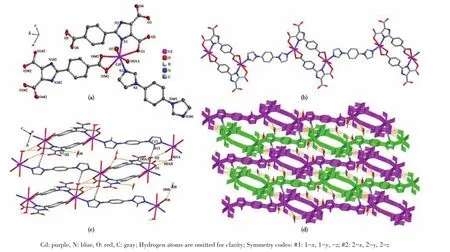
Fig.2 (a)Coordination environment around Cd(Ⅱ)ions in 2 drawn with 30%probability displacement ellipsoids;(b)1D chain structure of 2;(c)Hydrogen bonding in crystal of 2;(d)Supramolecular framework structure of 2 formed by hydrogen bonding
2.2 PXRD analyses
The PXRD was carried out to test the phase purity of 1 and 2(Fig.3),and the experimental results are well consistent with the simulated data,which indicates the high purity of two complexes.The difference in peak intensity may be due to the different orientations of the sample.

Fig.3 PXRD patterns of 1 and 2
2.3 Thermal analyses
To test the thermal stability of 1 and 2,their ther⁃mal behaviors were investigated under a nitrogen atmo⁃sphere by TGA.As shown in Fig.4,the TGA curve of 1 showed a slow weight loss near 100 ℃ which is consis⁃tentwith the lossoflattice water(removed by SQUEEZE)molecules and one coordinated water mole⁃cules,and upon further heating,the structure was stable up to 275℃.The continuous heating up led to a decomposition.The TGA curve of 2 was similar to 1 and exhibited thermal stability up to 275℃,and then the structure started collapsing.The remaining weight was 23.66%(Calcd.22.81%)at 800℃.

Fig.4 TGA curves of 1 and 2
2.4 Luminescent properties
The solid⁃state photoluminescent properties of 1 and 2 were investigated at room temperature with the microcrystalline samples,and the luminescence spec⁃tra of free H3L,1,10⁃phen,and dib were also measured at the same condition.As shown in Fig.5,the maximum emission of 1,2 and ligand H3L,1,10⁃phen and dib are at 377 nm(λex=289 nm),383 nm(λex=280 nm),394 nm(λex=318 nm),435 nm(λex=373 nm),326 nm(λex=293 nm),respectively.The emission of 1 showed a blue shift relative to free 1,10⁃phen ligand(58 nm)and 2 showed a red shift relative to dib ligand(47 nm),both of them show blue shifts relative to H3L(17 nm for 1 and 11 nm for 2).Due to that the Cd(Ⅱ)ions withd10configurations are difficult to oxidize or reduce,the emission of 1 and 2 couldn′t be attributed to metal⁃to⁃ligand charge transfer(MLCT)orligand⁃to⁃metal charge transfer(LMCT)[15].Their photoluminescence could be assigned to intra⁃ligand fluorescence emission(π*→π)or ligand localized emission(π*→n),which are consistent with the reported Cd (Ⅱ) complexes[32⁃33].The shift of the emission peaks may be ascribed to the coordination action of the ligands to Cd(Ⅱ)ions,which increases the energy between the ground state and excited state[34⁃35].Although 1 and 2 have the same main ligand and center metal ions,1 showed fluorescence quenching,while 2 showed fluorescence enhancement.The protons on the uncoordinated carboxyl group of the ligands in 1 are not removed,and the carboxyl group is used as a fluorescence quenching group,which may cause the fluorescence of 1 to be quenched[8].The enhanced fluorescence of 2 may be due to the coordina⁃tion between the ligands and the metal ion,which increases the rigidity of the ligands and reduces the non⁃radiative energy loss[36].

Fig.5 Solid⁃state excitation and emission spectra of the ligands and 1 and 2
2.5 Hirshfeld surface analysis of 1 and 2
To analyze intermolecular interaction and surface electron distribution,we used crystalExplorer software to calculate the Hirshfeld surface explanation of the immediate environment of a molecile in the crystal.The 3D Hirshfeld surface and 2D fingerprint plots of 1 and 2 are shown in Fig.6,and the 3D Hirshfeld surface was mapped withdnorm,shape index,and curvedness with standard high resolution.As shown in Fig.6,the red regions ondnormof 1 and 2 suggest that high elec⁃tron densities may be due to the strong interaction,gen⁃erally representing the formation of hydrogen bond or coordination bond;the blue regions have low electron densities and no obvious interaction;the white regions have moderate electron densities,which correspond to slightly weaker interaction,and commonly regarded asπ…πstacked regions[37⁃38].The shape index is an obvi⁃ous indication of a subtle change of Hirshfeld′s sur⁃face.The curvedness is the measurement of“how much shape”;the flat regions represent a low value of curvedness,while the sharp regions represent a high value of curvedness,indicating an interaction between adjacent molecules[39].
The 2D fingerprint plot can easily recognize the intermolecular interaction on the molecular surface.The C…H,O…H,N…H,and H…H interactions of 1 and 2 are shown in Fig.6.For 1,the H…H,C…H/H…C,O…H/H…O and N…H/H…N interactions account⁃ed for 32.2%,22.2%,26.3%,and 3.0%of Hirshfeld surface,respectively.For 2,the H…H,C…H/H…C,O…H/H…O and N…H/H…N interactions accounted for 26.4%,17.2%,34.8%,and 1.4%of Hirshfeld sur⁃face respectively.It is the interaction in 1 and 2 that makes them more stable.

Fig.6 Hirshfeld surfaces mapped with d norm , shape index, curvedness, and 2D fingerprint plots of 1 and 2
2.6 Density functional theory calculation
To prove the theoretical stability of 1 and 2,we applied Guassian09 software to optimize the structure and calculate the energies of 1,2,and H3L,based on the method of density functional theory(DFT)with the level of B3LYP.Non⁃metal atoms were described by 6⁃31G and metal atoms were treated by LANL2DZ basis sets,which didn′t consider the solvent effect[40⁃41].Since the structures of 1 and 2 have been determined in the single crystal X⁃ray diffraction,it is possible to directly import data(CIF)and directly perform energy calcula⁃tions without structural optimization.
The frontier molecular orbit energy levels,HOMO and LUMO,are two important indicators of molecular stability,where HOMO represents the ability to donate an electron,and LUMO represents the ability to accept an electron.The energy gaps(ΔE)between LUMO and HOMO represent the chemical stability of the molecule.The HOMO and LUMO levels of 1,2,and H3L are shown in Fig.7.The LUMO,HOMO,and ΔEof 1,2,and H3L were-4.51,-5.41,and 0.90 eV;-4.57,-5.93,and 1.36 eV;-2.60,-6.84,and-4.24 eV,re⁃spectively.The energies of frontier orbit HOMO⁃LUMO are all negative,demonstrating that 1,2,and H3L have chemical stability[42⁃43].All the above indicates that 1,2,and H3L are stable on the ground state,and the cal⁃culation method of DFT with B3LYP basis set is rea⁃sonable.

Fig.7 Energy level diagrams of frontier orbitals of 1,2,and H3L
2.7 Optical band gaps
To test the candidate properties of 1 and 2 as semiconductors,the UV⁃Vis DRS spectra to determine the band gap(Eg)were tested(photoresponse wave⁃length region),based on Kubelka⁃Munk(K⁃M)func⁃tion,using absorbance as the ordinate and energy as the abscissa to draw a graph and fit the linear section to obtain a linear equation.Its intercept on thex⁃axis is the band gap energy[44⁃45].As shown in Fig.8,Egof 1 and 2 had similar values:3.55 and 3.58 eV,respectively.The wide band gaps of 1 and 2 indicate that they are potential wide gap semiconductors materials[46].

Fig.8 Plots of K⁃M function vs energy for 1 and 2
2.8 FT-IR analysis
The FT⁃IR spectra of H3L,1,and 2 are shown in Fig.9.1 and 2 had similar infrared absorption peaks to H3L.The absorption peaks at 3 420⁃3 430 cm-1could be ascribed to the stretching vibration of N—H bond from H3L,and the absorption peaks between 1 400 and 1 630 cm-1are attributed to the breathing vibrations of the aromatic ring and imidazole ring[47].There was a strong absorption peak at 1 726 cm-1for H3L but 1 and 2 had no absorption peak in the same region.This absorption peak could be attributed to the stretching vibration ofC=O bond,and the absence of this absorption peak for 1 and 2 may be due to the coordina⁃tion of the oxygen of carbonyl group with the metal ion.

Fig.9 FT⁃IR spectra of 1,2 and H3L
3 Conclusions
In summary,two new Cd(Ⅱ) complexes were suc⁃cessfully synthesized by hydrothermal method.The structure analysis result shows that auxiliary ligand has an important effect on the crystal structure:bridge ligands can easier to form 1D structure,but chelating ligands tend to generate 0D structure.Through PXRD,TGA,luminescent,Hirshfeld surface analyses,and DFT calculation,we verified the phase purity of the complexes,tested their thermal stability and photolumi⁃nescence,calculated the intermolecular interaction,surface electron distribution,and the chemical stability of them.Besides,1 and 2 showed wide optical band gaps,which indicates that they have potential applica⁃tion on wide band gap semiconductors materials.
Acknowledgements:This work was supported by the Research Projects of Colleges and Universities in Gansu Prov⁃ince(Grant No.2019A⁃032),Natural Science Foundation of Chi⁃na(Grant No.21761030),Tianjin University⁃Lanzhou Jiaotong University Independent Innovation Fund Cooperation Project(Grant No.2020060),and College Student Innovation Training Program(Grant No.2020033).
杂志排行
无机化学学报的其它文章
- Mn-Based Coordination Polymer:Facile Synthesis,Structure and Application in Glucose Electrochemical Sensing
- Preparation of Dehydrated Ni-Fe Hydrotalcite-like Compounds as an Eco-Friendly Catalyst for Highly Selective Acetalization of Biomass-Derived Furfural
- Difunctional Effects of Organo-Modified T-Type Zeolite Membranes for Dewatering from Organic Solution
- Controlling Distribution of Gold Nanoparticles in Au@ZIF-8 Core-Shell Structures for Sensing Fluorescent Molecules with Photoluminescence
- Structures and Luminescence Property of Two Co(Ⅱ) and Cd(Ⅱ)Supramolecular Coordination Networks Created via Synergistic Effect of Coordination Bonds and Secondary Interactions
- Si掺杂调控15-冠-5配位Li+机理的理论研究