Thermal conductivity of graphite nanofibers electrospun from graphene oxide-doped polyimide
2021-11-05YUANZezhengCHENWeiSHIYunkaiCHUXiaodongHUANGZhenghongGANLinLIJiaHEYanbingLIBaohuaKANGFeiyuDUHongda
YUAN Ze-zheng,CHEN Wei,SHI Yun-kai,CHU Xiao-dong,HUANG Zheng-hong,3,GAN Lin,2,LI Jia,2,HE Yan-bing,2,LI Bao-hua,2,KANG Fei-yu,DU Hong-da,2,*
(1.Guangdong Provincial Key Laboratory of Thermal Management Engineering & Materials, National-Local Joint Engineering Laboratory of Functional Carbon Materials, Shenzhen 518055, China;2.Shenzhen Geim Graphene Center, Institute of Materials Research, Tsinghua Shenzhen International Graduate School, Shenzhen 518055, China;3.State Key Laboratory of New Ceramics and Fine Processing, School of Materials Science and Engineering, Tsinghua University, Beijing 100084, China)
Abstract:Aromatic polyimide (PI)-based graphite nanofibers were obtained from the graphitization of graphene oxide (GO)-doped electrospun PI nanofibers.GO improves the PI molecular orientation,crystalline structure and thermal conductivity of the resulting nanofibers.The degree of PI molecular orientation in the nanofibers is increased by the GO during fiber preparation.This improvement in molecular orientation produces an increase in the thermal conductivity of the graphite nanofibers,and the addition of only 0.1% GO has a significant effect.The GO not only affects the thermal conductivity,but improves the PI molecular orientation and its role as nucleation centers during graphitization.This approach and the resulting high thermal conductivity materials show great potential for practical applications.
Key words:Graphite nanofiber;Polyimide;Graphene;Thermal conductivity
1 Introduction
The development of high thermal conductivity materials (TCMs) has attracted considerable research attention.As high performance TCMs,graphite nanofibers[1]have shown great potential in thermal conductivity,which are light and flexible.There is a new graphite nanofiber precursor material called polyimides (PIs)[2]that have many advantages including excellent mechanical properties[3],thermal stability[4]and chemical resistance.PIs were developed as candidates of carbon precursors and are used in the preparation of high-quality graphite materials without the need of a complex stabilization process.Inagaki[5]introduced PI as a precursor for the production of various carbon materials and summarized the following three main advantages of PI carbon precursors:wide molecular structure,high carbon yield,and requirement of only simple heat treatment processes.The thermal conductivity of PI-based graphite fibers can be increased by 3 approaches,which are the increase in the degree of molecular orientation of the fibers,catalytic graphitization,and minimization of defects in the graphite fiber.Electrospinning[7]is a nanofiber processing technique[8–9]that allows for improved molecular orientation[10].Li[6]reported that an increased graphitization temperature can improve the graphitization degree and thermal conductivity of PI-based graphite nanofibers.Further,Xiao[11]found that the thermal conductivity of GO/PI graphite fibers reached 435 W m−1K−1when 2.0% GO was added.Song[12]and Lu[13]studied the orientation of electrospun polyethylene oxide nanofibers through Fourier-transform infrared (FTIR) spectroscopy.
Graphene oxide[14]has a unique two-dimensional structure,which has high specific surface area and is suitable as a filler in composites with polymer materials.Zhang[15]reported the thermal properties of functionalized graphene/PI nanocomposites.Various properties of high-molecular-weight polymers can be improved by increasing the degree of molecular orientation.Jiang[16,18]found that imidization temperature affects the mechanical properties of electrospun PI nanofibers,while Tashiro[17]investigated the molecular orientation of polymers through FTIR spectroscopy.
This study aimed to investigate the effect of GO on the thermal conductivity of PI-based graphene fibers.Graphite nanofibers were transformed from electrospun PI nanofibers doped with GO by graphitization at 2 600 °C.Polarized FTIR spectroscopy was conductded to analyze the orientation of PI nanofibers.XRD was used to measure the degree of graphitization and the crystalline structure of the GO/PI graphite nanofibers.Raman spectroscopy was conducted to analyze the defects of the graphite nanofibers.The thermal conductivity of the PI-based graphite nanofibers was evaluated using the steadystate T-type method[21].
2 Materials and methods
2.1 Materials
GO was obtained from Angxing Graphite Co.Changzhou (China),promellitic dianhydride (PMDA),4,4-oxydianiline (ODA),and N',N-dimethylacetamide (DMAc) were obtained from Aladdin Co.(China).GO solution of 0.1 mg mL−1was transferred to a mica substrate by spin coating.Fig.1(a) is the atom force micrography (AFM) of GO.The GO sheets had a wide lateral size distribution.The diameters were from 500 nm to 5 μm,and wrinkles on the GO surface were obvious.The thickness of GO was between 3 and 10 nm.
2.2 Sample preparation
2.2.1 Solution preparation
GO,PMDA and ODA were polymerized in DMAc (Fig.1(a)).The reagents comprised 15%polyamic acid (PAA) with 0.01%,0.03%,0.05% and 0.1% GO.GO was uniformly dispersed in the DMAc reagent.The mixture was place in a nitrogen atmosphere and ODA was added,dispersed and dissolved.PMDA was added five times,and mechanical stirring was performed at 0 °C in N2for 2 h.The prepared GO/PAA sample was refrigerated at −10 °C.It was worth mentioning that when the amount of GO added exceeds 0.1%,the viscosity of the GO/PAA solution was too high,not suitable for electrospinning.
2.2.2 Directional electrospinning
GO/PAA nanofibers were prepared via electrospinning of the GO/PAA solution at a distance of 20 cm,voltage of 20 kV (17 kV on the needle and −3 kV on the collector),roller rotation speed of 2 800 r min−1,and needle injection speed of 0.02 mm min−1(Fig.1(b) and Table 1).The GO contents in the GO/PAA solutions are 0,0.01%,0.03%,0.05% and 0.1%.

Table 1 Parameters of the electrospinning.
2.2.3 Thermal treatment
GO/PI composite nanofibers were prepared via imidization,wherein the PAA nanofibers were slowly imidized to PI in a nitrogen atmosphere at 120,200,250 and 300 °C for 30 min and subsequently held at 350 °C for 60 min.GO/PI composite nanofibers were placed in a graphite crucible,and a graphite sheet was applied to reduce wrinkling of the sample (Fig.1(c)).GO/PI nanofibers were heated to 1 200 °C in an argon atmosphere to obtain GO/PI carbon nanofibers,which were subsequently heated to 2 600 °C in an argon atmosphere to obtain GO/PI-based graphite nanofibers.
2.3 Characterization
2.3.1 High-resolution field emission scanning electron microscopy
The morphology of the graphite nanofibers was evaluated,through field-emission scanning electron microscopy (FE-SEM;SUPRA 55,Zeiss,Germany)at 5 kV.All the samples were Pt-sputtered (EM ACE600,Lecia,Germany) before observation.
2.3.2 High resolution transmission electron microscopy
High resolution transmission electron microscopy (FEI Tecnai F30) was used to characterize the morphology and microstructure of graphite nanofibers.The sample preparation consisted of two steps.First,the graphite nanofibers were sonicated in alcohol for 20 min so that the graphite nanofibers were fully dispersed.Then,the suspension was deposited on the conductive TEM grid and allowed to dry naturally for 1 h.
2.3.3 Measurement of electrical property
The electrical conductivity of GO/PAA with different GO contents was measured through a conductivity meter (Mettler Toledo Seven-Easy conductivity meter).The conductivity meter was calibrated with the standard solution (84 uS/cm) before the measurement.Each sample was measured five times,and the average value of multiple measurements was used as the conductivity of the sample.The resistivity of graphite nanofibers was measured using the 4 point probe measurement system (Jandel).
2.3.4 Polarized FT-IR spectroscopy
The molecular orientation of the aligned electrospun PI nanofibers was evaluated through polarized FTIR spectroscopy[20–22].The nanofiber alignment was parallel to the direction of the 0° polarizer during analysis,and FTIR spectra were acquired at polarization angles (built-in) of 0° and 90°.The degree of molecular orientation of the sample was determined on the basis of fitting analysis of specific peaks (Fig.2).

Fig.2 Calculating method of orientation factor(f).
2.3.5 Raman spectroscopy
The graphite nanofibers were evaluated through Raman spectroscopy (LabRam HR800,Horiba Jobin Yvon Inc.) andID/IGwas recorded by using a 532 nm laser in a scanning range of 0–4 000 cm−1.Rwas defined as the ratio of theDandGpeak intensities(Fig.3).
2.3.6 X-ray diffraction

ID/IGFig.3 Calculating method of .
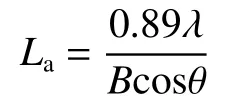
X-ray diffraction (D8 Advance,Bruker) was used to measure the degree of graphitization and the crystalline structure of the GO/PI graphite nanofibers using CuKa radiation with a scan range from 10° to 90°.According to the Bragg’s equation,d002was obtained with the position of the (002) diffraction peak:

Mering-Maire empirical formula was used to calculate the degree of graphitization of GO/PI graphite nanofibers:

Scherrer formula was used to calculate the average size of the crystallit eLa:
2.3.7 Measurement of thermal conductivity of nanofibers
The thermal conductivity of the PI-based graphite nanofibers was determined by using the steadystate T-type method[19],which was used to accurately measure the thermal conductivity of anisotropic materials,especially graphite nanofibers.Schematic of measuring thermal conductivity is given in Fig.4.This section only introduced the key calculation principles.
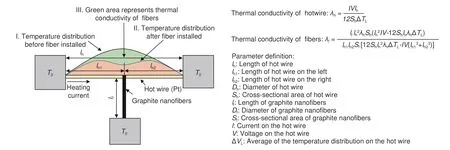
Fig.4 Mechanism of measuring thermal conductivity using the steady-state T-type method.
The T-type method consists of three steps.The first step is to install the hot wire and measure its thermal conductivity (Fig.4;Step 1).In a vacuum and closed container,the hot wire is glued to two support tables through a conductive silver glue.The hot wire is energized and heated to a stable state under different ambient temperatures (300,305,310,315 and 320 K).The temperature distribution on the hot wire is single-peak.By measuring the heating power on the hot wire,the thermal conductivity of the hot wire can be evaluated.The second step is to install the graphite nanofiber,heat the hot wire,and measure the voltage across the hot wire (Fig.4 (Step 2)).A strip-shaped graphite sample (25 mm × 200 μm × 30 μm) is analyzed under vacuum at 300,305,310,315 and 320 K.Because the nanofiber continuously transfer the heat from the midpoint of the hot wire to the support table,the temperature distribution on the hot wire is a double peak.The third step is to calculate the thermal conductivity of graphite nanofiber (Fig.4 (Step 3)).The green area shown in Fig.4 represents the thermal conductivity of the nanofiber.By quantitatively solving the green area,the thermal conductivity of the nanofiber can be calculated accurately.
3 Results and discussion
3.1 Morphology of the PI nanofibers and GO/PI composite nanofiberss
Fig.5 shows the surface morphology of the (a) PI graphite nanofibers,(b) 0.05% GO/PI graphite nanofibers,(c) 0.1% GO/PI graphite nanofibers and (d-f)magnified images of the images (a–c).The surface of the graphite nanofibers with different GO contents is rough due to the heat treatment.With the increase of the GO content,the average diameter of graphite nanofibers decreases.As shown in images (d-f),the diameters of PI,0.05% GO/PI,0.1% GO/PI graphite nanofibers are 300–400 nm,200–300 nm and 100–200 nm,respectively.
Also,Fig.5 shows the HRTEM images of the (g)PI graphite nanofibers,(h) 0.05% GO/PI graphite nanofibers and (i) 0.1% GO/PI graphite nanofibers.The images (g-i) intuitively show that the degree of order of the graphite crystal structure changes with the GO content.As shown in Fig.5(g),when no GO was added,the graphite crystals were disordered relatively and there were many defects.As shown in Fig.5(i),when the GO content reached 0.1%,the graphite crystals were ordered and there were fewer defects.With the increase of the GO content,the order of graphite crystals gradually increases,and the defects gradually decrease.
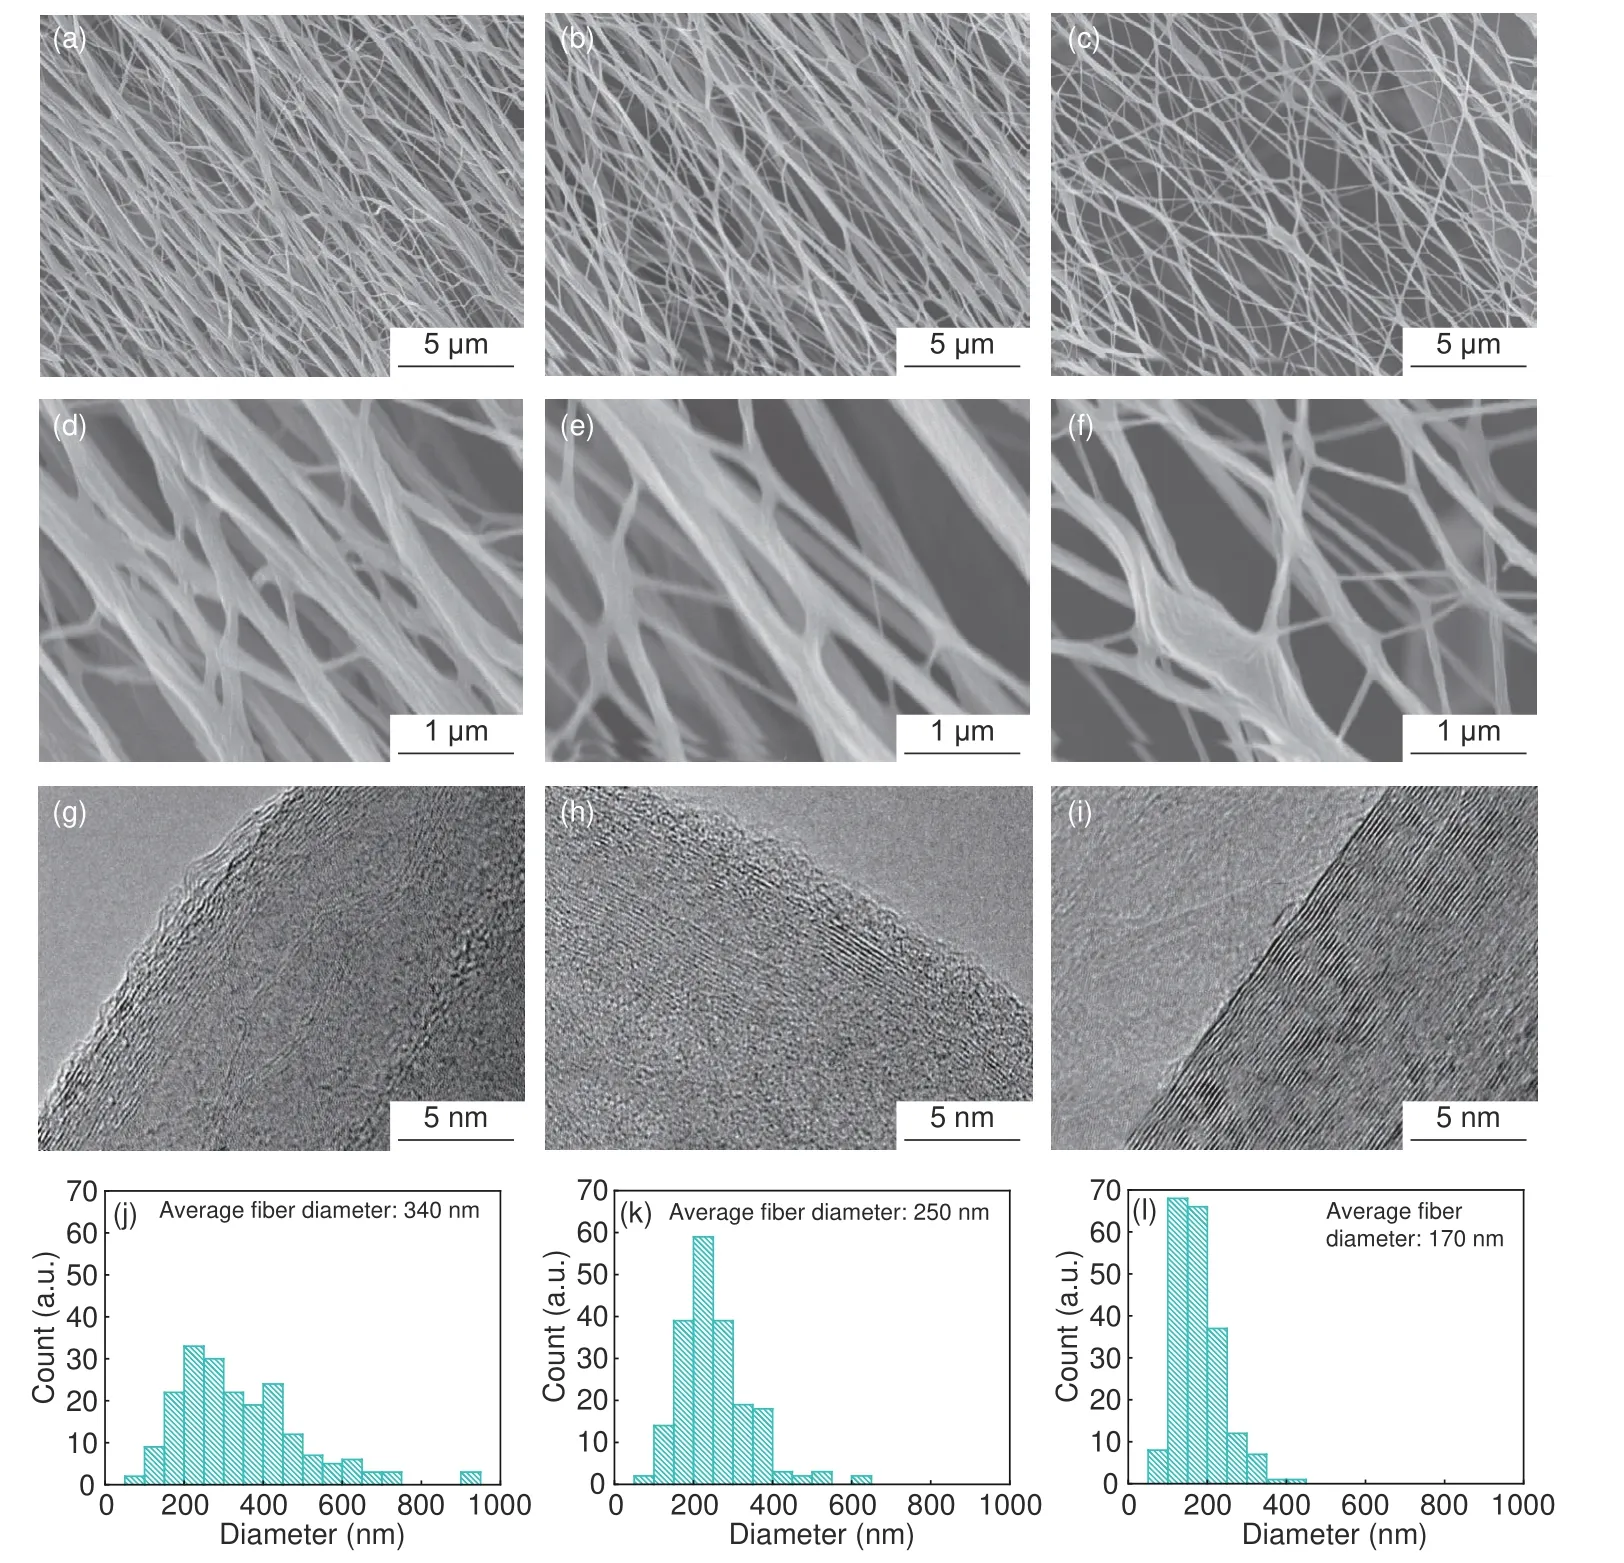
Fig.5 SEM images of (a) PI graphite nanofibers,(b) 0.05% GO/PI graphite nanofibers,(c) 0.1% GO/PI graphite nanofibers and (d-f) Magnified images of(a–c).TEM images of (g) PI graphite nanofibers,(h) 0.05% GO/PI graphite nanofibers,(i) 0.1% GO/PI graphite nanofibers.Diameters distribution maps of (j)PI graphite nanofibers,(k) 0.05% GO/PI graphite nanofibers and (l) 0.1% GO/PI graphite nanofibers.
According to Fig.5 (a-c),we evenly selected 200 pieces of graphite nanofibers and measured the diameter of the graphite nanofibers.As shown in Fig.5(jl),the measurement results of the graphite nanofiber diameters were plotted as a frequency distribution histogram,which was used to analyze the influence of the GO content on the fiber diameter.Fig.5 (j) shows that the average diameter of PI graphite nanofibers is 340 nm.The diameters are mainly distributed between 150–450 nm,and the distribution is relatively uniform.Fig.5 (k) shows that the average diameter of 0.05% GO/PI graphite nanofibers is 250 nm.The diameters are mainly distributed between 150–350 nm and the distribution is relatively narrow.Fig.5 (l)shows that the average diameter of 0.1% GO/PI graphite nanofibers is 170 nm.The diameter is mainly between 100–200 nm.
The reason for the decrease in average diameter is that the conductivity of the PAA solution increases as the amount of GO added increases during the electrospinning process (Fig.6(c)).With the increase of the GO content,the decrease of graphite nanofiber diameter leads to the change of material properties.
3.2 Molecular orientation of GO/PI composite nanofibers
The polarized FT-IR spectra of the GO/PI nanofibers exhibited a sharp peak at 1 724 cm−1(Fig.6(a)).The peak at 1 724 cm−1represents carbonyl group(C=O),and the angle between carbonyl group and molecular axis is 75°[6].The degree of molecular orientation was evaluated based on the calculated infrared color separation ratio (f) of this peak[24],where a largerfvalue is indicative of better molecular orientation.Thefvalue increased from 1.03 to 1.35 when 0.1% GO was added,thereby indicating that the addition of GO significantly increases the molecular orientation of the PI nanofibers (Fig.6(b)).

Fig.6 (a) Polarized FT-IR spectra of the GO/PI composite nanofibers.(b) Orientation factor of GO/PI with different GO contents and (c) Conductivity of GO/PAA solution with different GO mass contents.
Jet stretching during the electrospinning process plays an important role in determining the orientation of the molecular chains in the nanofibers[10].Jet stretching is mainly caused by an imbalance between the Coulombic force,viscoelastic force,and surface tension[2].The conductivity of the GO/PAA solution increases from 2.31 to 15.51 uS cm−1with the amount of GO added,thereby leading to an increase in the charge carried by the solution (Fig.6(c)).Consequently,the jet was subjected to greater electrostatic and Coulomb forces compared to the tensile force during electrostatic spinning,which increased the degree of orientation of the molecular chain.
3.3 Crystalline structure of GO/PI composite graphite nanofibers
The peak position and full width at half maximum (FWHM) of the (002) peak of GO/PI graphite nanofibers with different GO contents were obtained from the XRD curves (Fig.7(a)),which were used to calculate the graphitization degree and average size of the crystallite of GO/PI graphite nanofibers.With increasing the GO content,the position of (002) peak increased from 26.330° to 26.535°,and FWHM decreased from 0.696 to 0.276 (Table 2).According to Bragg’s equation,Mering-Maire empirical formula and Scherrer formula,the graphitization degree (G)and average size of the crystallite size (La) were calculated fromd002and FWHM.With the increase of the GO mass content,the graphitization degree of GO/PI graphite nanofibers increases from 66.27% to 96.18%,and the average crystal size increases from 11.99 to 29.22 nm (Fig.7(b)).
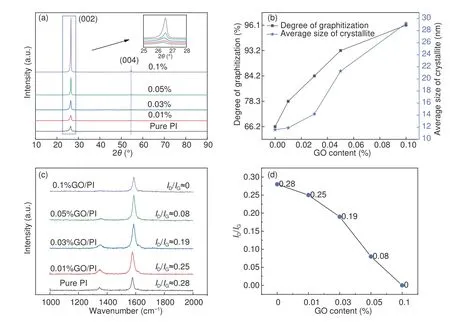
Fig.7 (a) XRD spectra of the GO/PI graphite nanofiber.(b) Degree of graphitization and average size of crystallite with different GO contents.(c) Raman spectra of the graphite nanofiber and (d) ID/IG with different GO contents.

Table 2 The graphitization degree and average size of the crystallite of GO/PI graphite nanofibers with different GO mass contents.
Fig.7(c) shows the Raman spectra of GO/PIbased graphite nanofibers with different GO contents.The ratio of theDandGpeak intensities (ID/IG) is defined as theRvalue[23],which decreases with increasing the GO content due to the increase in graphitization (Fig.7(d)).TheRvalue decreases from 0.28 to 0,when the GO content is 0.1%.Dpeak of 0.1%GO/PI graphite nanofibers has almost disappeared.This indicates that the PI-based graphite nanofibers exhibit no obvious defects when 0.1% GO was added.Thus,the graphite structure is relatively complete.
These findings indicate that the graphitization degree of GO improves the crystalline structure of the graphite nanofibers.GO acts as a nucleus during graphitization,where the PI molecular chain is connected to the graphene sheet.The graphene sheets continue to grow as graphitization proceeds,which indicates that graphite microcrystals are formed[25–26].Overall,the crystalline structure is improved by increasing the GO content.
3.4 Thermal conductivity of the graphite nanofibers
The thermal conductivity of the GO-and PIbased graphene nanofibers was determined using the T-type method[17,19].The thermal conductivity measured at different temperatures shows an upward trend(Fig.8(a)).The nanofibers without GO exhibits a thermal conductivity of 198 W m−1K−1,while it shows a gradually increase to 331 W m−1K−1at 0.1% GO (error=~10 W m−1K−1) corresponding to an overall increase in thermal conductivity by 67% (Fig.8(b)).

Fig.8 (a) Thermal conductivity under different temperatures.(b) average thermal conductivity and (c) electrical resistivity of GO/PI graphite nanofibers with different GO mass contents.
The electrical resistivity of GO/PI graphite nanofibers with different GO contents were measured by the 4 point probe measurement system.As shown in Fig.8(c),as the GO content increases,the resistivity decreases from 5.25 to 1.58 μΩ·m.For graphite nanofibers,the decrease in resistivity can also indirectly explain the improvement of the thermal conductivity of graphite nanofibers.
Since the content of GO is extremely small,the thermal conductivity of GO may not directly affect the thermal conductivity of the graphite nanofibers.GO improves the thermal conductivity of the carbon nanofibers due to the improved molecular orientation and crystalline structure of the PI nanofibers during electrospinning,which promotes the thermal conductivity of the graphite nanofibers.Furthermore,GO serves as a crystal nucleus during graphitization to significantly enhance the crystalline structure of the carbon nanofibers,reduce defects,and improve the graphite network.
4 Conclusion
Aromatic polyimide (PI)-based graphite nanofibers were obtained from the graphitization of GOdoped electrospun PI nanofibers.In our study,we found that molecular orientation and crystalline structure of the GO/PI-based graphite nanofibers are improved by adding only 0.1% GO.These changes directly enhance the thermal conductivity of the PI-based graphite nanofibers from 198 W m−1K−1without GO to 331 W m−1K−1at 0.1% GO.Since the content of GO is extremely small,the thermal conductivity of GO may not directly affect the thermal conductivity of the graphite nanofibers.
GO increases the degree of PI molecular orientation in the PI-based nanofibers.FTIR analysis reveals that only 0.1% GO improves the C=O(1 724 cm−1) infrared dichroism of PI from 1.03 to 1.35.During the electrospinning process,GO increases the conductivity of the PAA solution,which subjects the PAA solution to greater electrostatic and Coulombic forces and,in turn,tensile forces.This leads to the increase of PI molecular orientation in the PI nanofibers,which indirectly increase the thermal conductivity of the graphite nanofibers.
GO improves the crystalline structure of the nanofibers.Raman analysis demonstrates that the only 0.1% GO leads to a decrease inID/IGratio from 0.28 to 0 as the defect peak disappears.XRD analysis shows that with the increase of the GO content,the graphitization degree of GO/PI graphite nanofibers increase from 66.27% to 96.18%,and the average crystal size increases from 11.99 to 29.22 nm.This is attributed to the fact that GO serves as a crystal nucleus during graphitization,which enhances the graphitization degree of PI.We speculate that small GO layers are located inside the PI nanofibers,while larger GO layers occurrs between the PI nanofibers.
In conclusion,only 0.1% GO was required to obtain high-quality graphite nanofibers with a high thermal conductivity,which shows great promising for engineering applications.
Acknowledgements
This work was supported by the Local Innovative and Research Teams Project of Guangdong Pearl River Talents Program (2017BT01N111),and Guangdong Key Laboratory Project (2020B1212060015).
杂志排行
新型炭材料的其它文章
- Properties and microstructures of a matrix graphite for fuel elements of pebble-bed reactors after high temperature purification at different temperatures
- Microstructure of high thermal conductivity mesophase pitch-based carbon fibers
- 高导热聚酰亚胺石墨膜/环氧树脂复合材料的制备与性能表征
- TiC-modified CNTs as reinforcing fillers for isotropic graphite produced from mesocarbon microbeads
- One-pot modified“grafting-welding”preparation of graphene/polyimide carbon films for superior thermal management
- A mini review:application of graphene paper in thermal interface materials
