Machine learning models for predicting non-alcoholic fatty liver disease in the general United States population: NHANES database
2021-11-04AmpornAtsawarungruangkitPassisdLaoveeravatKittichaiPromrat
Amporn Atsawarungruangkit, Passisd Laoveeravat, Kittichai Promrat
Amporn Atsawarungruangkit, Kittichai Promrat, Division of Gastroenterology, Warren Alpert Medical School, Brown University, Providence, RI 02903, United States
Passisd Laoveeravat, Division of Digestive Diseases and Nutrition, University of Kentucky College of Medicine, Lexington, KY 40536, United States
Kittichai Promrat, Division of Gastroenterology and Hepatology, Providence VA Medical Center, Providence, RI 02908, United States
Abstract BACKGROUND Non-alcoholic fatty liver disease (NAFLD) is the most common chronic liver disease, affecting over 30% of the United States population.Early patient identification using a simple method is highly desirable.AIM To create machine learning models for predicting NAFLD in the general United States population.METHODS Using the NHANES 1988-1994.Thirty NAFLD-related factors were included.The dataset was divided into the training (70%) and testing (30%) datasets.Twentyfour machine learning algorithms were applied to the training dataset.The bestperforming models and another interpretable model (i.e., coarse trees) were tested using the testing dataset.RESULTS There were 3235 participants (n = 3235) that met the inclusion criteria.In the training phase, the ensemble of random undersampling (RUS) boosted trees had the highest F1 (0.53).In the testing phase, we compared selective machine learning models and NAFLD indices.Based on F1, the ensemble of RUS boosted trees remained the top performer (accuracy 71.1% and F1 0.56) followed by the fatty liver index (accuracy 68.8% and F1 0.52).A simple model (coarse trees) had an accuracy of 74.9% and an F1 of 0.33.CONCLUSION Not every machine learning model is complex.Using a simpler model such as coarse trees, we can create an interpretable model for predicting NAFLD with only two predictors: fasting C-peptide and waist circumference.Although the simpler model does not have the best performance, its simplicity is useful in clinical practice.
Key Words: Artificial intelligence; Machine learning; Non-alcoholic fatty liver disease; Fatty liver; United States population; NHANES
INTRODUCTION
Non-alcoholic fatty liver disease (NAFLD) is a common chronic metabolic disease found in 25.5% of the United States population, and it is more common in patients with diabetes (55.5%), leading to a health and economic burden[1-3].Non-alcoholic steatohepatitis (NASH) can lead to liver-related consequences, such as cirrhosis, hepatocellular carcinoma, and mortality.NASH is the second most common indication for liver transplantation in the United States and is likely to replace hepatitis C infection as the leading cause of liver transplantation in the future[4].NAFLD is diagnosed primarily with imaging studies, transient elastography, magnetic resonance elastography, or liver biopsy[5].Some of these diagnostic modalities are not available in every health care facility, require expert interpretation, and are invasive in case of biopsy[5,6].To prevent adverse outcomes in these patients, early screening and detection based on risk factors are warranted.Healthcare providers and patients are aware of the risk factors of NAFLD, which include diabetes, obesity, dyslipidemia, and metabolic syndrome[5,7,8].However, there is no well-performing tool for the early prediction of NAFLD; for example, liver enzyme levels can be normal in patients with NAFLD[9,10].There are existing studies on the risk factors and prediction risk scores; however, their results are controversial[11-15].Machine learning is a potential approach for the identification of the best predictive model[16].
Machine learning can be used to construct a predictive model by teaching computer algorithms to learn from data without being explicitly programmed.Applications of machine learning in gastroenterology field are steadily increasing[17].However, there is no machine learning model for predicting NAFLD in the United States.The published models in China, Germany, and Canada focus on NAFLD prediction scores using laboratory parameters and demographic data[11,13-15].Therefore, we aimed to evaluate the applications of machine learning in NAFLD diagnosis for easy use at clinical setting.
MATERIALS AND METHODS
Study population and study design
The Third National Health and Nutrition Examination Survey (NHANES III) was a nationwide probability sample of 39695 persons aged 2 mo and older, conducted from 1988-1994 by the National Center for Health Statistics (NCHS).It aimed to evaluate the health and nutritional status of the general United States population[18].Multiple datasets were collected in this survey, including demographics, interviews, physical examinations, and laboratory testing of biologic samples.The NHANES protocol was approved by the NCHS Research Ethics Review Board.
Definitions
Participants aged 20 years or older in NHANES Ⅲ with gradable ultrasound results were included in this study.The exclusion criteria included: (1) Excessive alcohol consumption; (2) Hepatitis B or C infection; (3) Fasting period outside of 8-24 h; and (4) Incomplete or missing data on physical examination and laboratory testing.The participants were divided into two groups: The NAFLD participants and non-NAFLD participants.Since participants aged above 74 years were not eligible for ultrasonography in NHANES III, participants aged above 74 years were excluded from this study.
‘NAFLD participants’ was defined based on: (1) Moderate to severe hepatic steatosis on ultrasound; (2) No history of alcohol drinking more than 2 drinks per day for men or 1 drink per day for women in the last 12 mo; and (3) No history of hepatitis B or C infection.
Thirty factors associated with NAFLD were included in this study: demographic (i.e., age, gender, and race/ethnicity), body measurement [i.e., body mass index (BMI) and waist circumference], general biochemistry tests [i.e., iron, total iron-binding capacity, transferrin saturation, ferritin, cholesterol, triglyceride, high-density lipoprotein (HDL) cholesterol, C-reactive protein, and uric acid], liver chemistry (aspartate aminotransferase, alanine aminotransferase, gamma glutamyl transferase, alkaline phosphatase, total bilirubin, total protein, albumin, and serum globulin), diabetes testing profile [i.e., glycated hemoglobin, fasting plasma glucose, fasting Cpeptide, and fasting insulin], and the use of diabetes medication.
Statistical analysis
Categorical and ordinal factors are presented as frequencies (%).Continuous factors are presented as medians (interquartile ranges).The dataset was divided into the training (70%) and testing (30%) datasets using stratified sampling.Differences between the two datasets were tested using the Mann-Whitney U test.Twenty-four machine learning algorithms were applied to the training dataset.Then, we selected the best performing models determined by accuracy and the F1 score and compared the out-of-sample performance with another interpretable model (coarse trees, a decision tree model with a maximum of four splits) and three NAFLD indices on the testing dataset.The selected NAFLD indices included fatty liver index (FLI), hepatic steatosis index (HSI), and triglyceride and glucose index (TyG)[19-21].The cut-off levels for NAFLD were ≥ 60 for FLI, > 36 for HSI, and ≥ 8.5 for TyG.The performance metrics include accuracy, sensitivity or recall, specificity, precision, area under the receiver operating characteristic curve (AUC), and the F1 score.It is worth noting that the F1 score is the harmonic mean of precision and recall.All statistical analyses were performed using MATLAB R2020a (MathWorks, MA, United States).
RESULTS
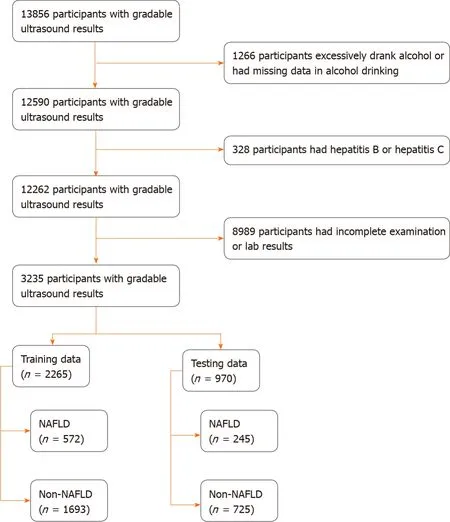
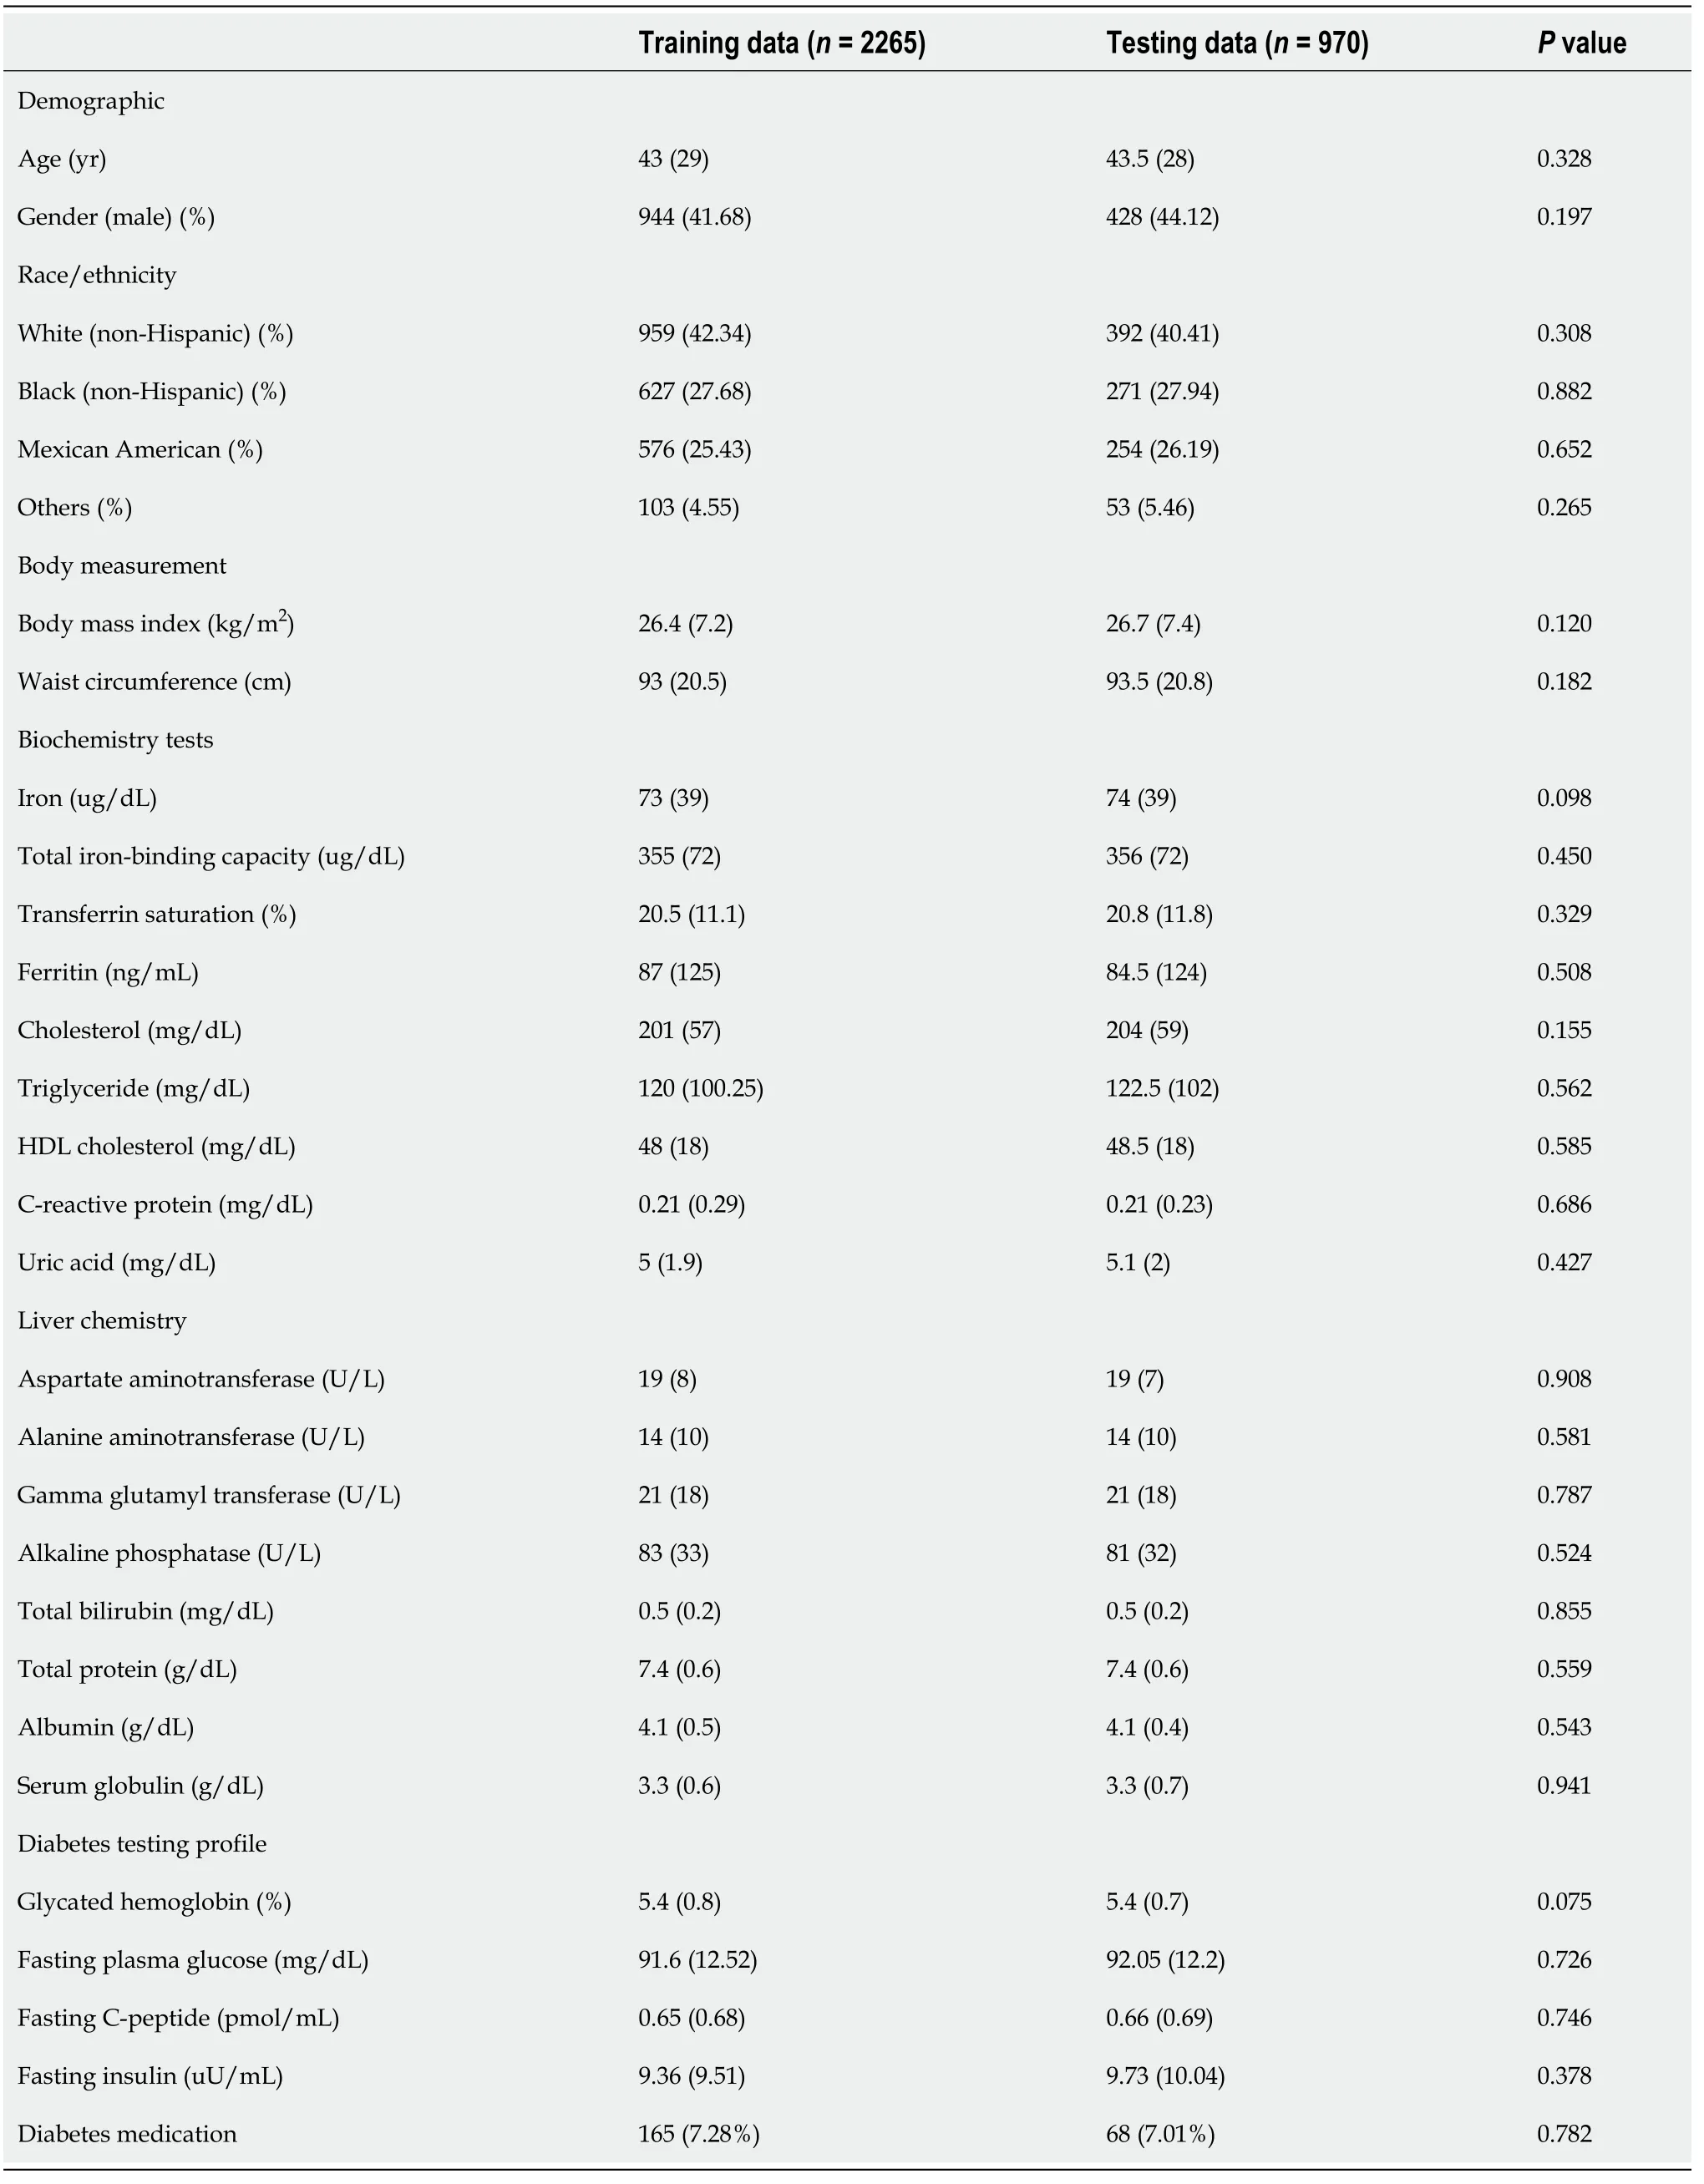
The study had 3235 participants (n= 3235).The participant selection process is shown in Figure 1.Based on ultrasound findings, 817 (25.26%) participants had NAFLD.The data of 2265 (70%) and 970 (30%) participants made up the training and testing groups, respectively.The baseline characteristics of participants in the training and testing groups are summarized in Table 1.There were no significant differences between the datasets for all factors.

Figure 1 Study design and data partitioning flow chart.
The performances of 24 machine learning algorithms that were applied to the training dataset are illustrated in Table 2.The ensemble of subspace discriminant and ensemble of random undersampling (RUS) boosted trees had the highest accuracy (78.3%) and highest F1 score (0.53), respectively; both models had an AUC of 0.76.The coarse trees, decision trees with a few leaves, had an accuracy of 76%, AUC of 0.68,and F1 score of 0.36.

Table 1 Baseline characteristics of participants in training and testing data
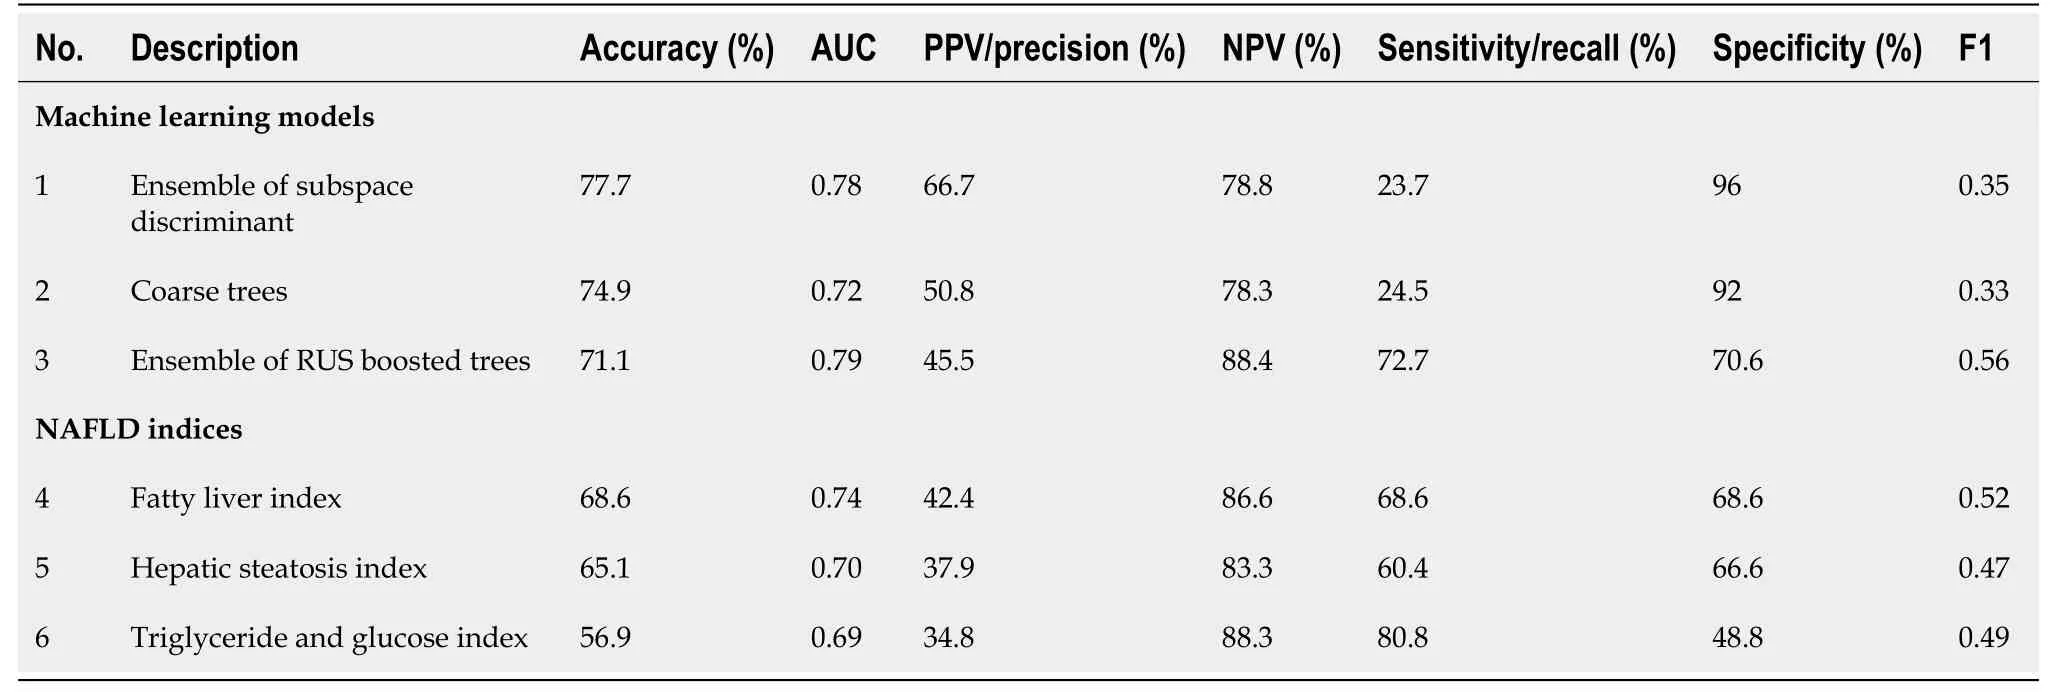
As shown in the first half of Table 3, the ensemble of subspace discriminant, coarse trees, and ensemble of RUS-boosted trees models were selected for testing the process on the testing data.When tested on the testing data, ensemble of subspace discriminant and ensemble of RUS-boosted trees still had a high accuracy (77.7%) and high F1 (0.56), respectively.The coarse tree had an accuracy of 74.9% and an F1 of 0.33.All the machine learning models and datasets are available for public access in the FileExchange portal of the MATLAB Central File Exchange[22].The performance of three NAFLD on the testing data are also displayed in the second half of Table 3.FLI was the best performer among the NAFLD indices with the accuracy of 68.6% and F1 score of 0.52.However, the ensemble of RUS boosted trees was superior to FLI in all metrics.

Table 2 The performance comparison of machine learning models on training data
DISCUSSION
Our study compared 24 different machine learning techniques to determine the optimal clinical predictive model for NAFLD.The accuracy of these models on the training data did not show much variation (range 9.4%), with an average of 75.5% (Table 2).The top two models were ensemble of subspace discriminant and ensemble of RUS boosted trees.The ensemble of subspace discriminant model had a higher accuracy while the ensemble of RUS boosted trees model had a better performance in classifying positive NAFLD, as indicated by the F1 score.Both models were ensemble type, which use multiple diverse models in combination to produce an optimal prediction.They are more complex machine learning models that apparently yield better predictions.Compared to accuracy, the F1 score is regarded as a superior performance metric for a class imbalance problem (often a large number of actualnegatives).In our opinion, the ensemble of RUS boosted trees model was the best performing machine learning model in this study.

Table 3 The performance of machine learning models and other non-alcoholic fatty liver disease indices on testing data
Technically, the final prediction of the ensemble method was derived from a combination of multiple predictions from different algorithms.In our case, the predicted outcome of the ensemble of RUS boosted trees model was derived from a weighted average outcome of 30 RUS boosted trees; the sample visualization of these RUS boosted trees can be found in the file uploaded to the MATLAB Central File Exchange[22].
8. Oh, very badly indeed! : Most versions of the tale previous to and after Andersen s version have a woman of low rank pretending to have slept badly to prove she is a princess. Often an animal helper has warned her of the test so she is able to provide an appropriate response in the morning. In other stories, the princess sleeps soundly despite her status and simply pretends a bad night s rest after being warned by her helper.
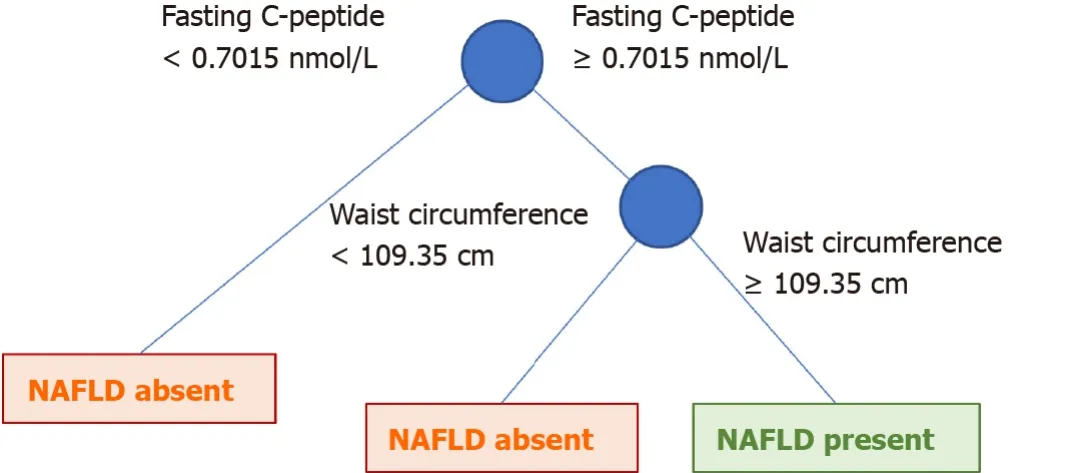
On the other hand, we compared the performance of the previous model with the coarse trees model, simple decision trees with several leaves and splits (Figure 2).The decision logic of the coarse trees model consisted of only two factors: Waist circumference and serum C-peptide.In terms of testing performance, it had a reasonable accuracy (AUC, 0.72; accuracy, 74.9%; and F1 score, 0.33).Since it is simple-to-use and easily interpretable, the coarse trees model can be more practically used in clinical practice.

Figure 2 The decision logic of coarse trees.
Waist circumference is directly associated with obesity and metabolic syndrome[23,24].They are also the established risk factors of NAFLD.The cut-off of 109.35 cm seems to be slightly higher than the general cut off value for metabolic syndrome (men, 102 cm and women, 80 cm)[25].It is used to calculate the visceral adiposity index, which provides a good predictive capability[26].The advantage of incorporating waist circumference into the model is its retrieval ability.
Our results are similar to those of a previous study identifying the risk factors of NAFLD[27].C-peptide is an indicator of insulin resistance[28,29].Serum C-peptide is associated with NAFLD, NASH, and fibrosis progression[28-30].Additionally, serum C-peptide levels increase with NAFLD severity[29,31,32].In our study, serum Cpeptide is more significantly associated with NAFLD prediction than liver function test.This can be explained by the fact that liver enzymes are possibly not specific to NAFLD.They can also be elevated in other liver diseases.On the contrary, serum Cpeptide is related to metabolic alterations, which play a direct role in NAFLD development.
We compared the performance of three NAFLD indices (FLI, HSI, and TyG) on the testing data.Among these three NAFLD indices, FLI had the highest performance in terms of accuracy (68.6%) and F1 (0.52).However, performance-wise, the ensemble of RUS boosted trees was superior to FLI in all aspects.In terms of simplicity, FLI is not complex, but it might be impossible for physicians to use it without spreadsheets or computers because it involves many mathematical operations, such as multiplication, logarithm function, and exponential function.Therefore, coarse trees remained the simplest model.
Previously developed machine learning models for NAFLD prediction have used more complex parameters, including laboratory and noninvasive scores.A populationbased study in Italy developed a score for NAFLD diagnosis with a moderate accuracy of 68% in the model development phase, but extremely high performance in the testing (prediction) phase using the small sample size of 50.The predictors used in the model were of abdominal volume index, glucose, gamma glutamyl transferase, age, and sex[33].A Chinese study incorporated three demographic factors and 15 Laboratory tests as predictors for Bayesian network model[8].The inclusion of simple constituents, liver enzymes, lipid panels, and complete blood count resulting in an accuracy of up to 80% in a 10-fold cross validation; there was no separate data set for external validation or testing.A Taiwanese study revealed that waist circumference was the most influential factor in the model resulting in a high performance with an AUC of 0.925[13].Similarly, such performance was based on a 10-fold cross validation, not on a separate data set for external validation or testing.In addition, the ethnic Chinese population generally has a lower alcohol consumption; it might not be generalized to other ethnic groups[12,15].A Canadian study revealed that HDL, BMI, sex, plasma glucose, blood pressure, and age were factors used in the decision criteria of decision trees with an AUC of 0.73[14].These reports showed different significant factors in their models.This might be explained by the different populations in terms of ethnicity, alcohol consumption, and obesity prevalence.Compared to prior reports, our study involved a general population of the United States, which has less selection bias and contains diverse races.Therefore, the derived models in this study can be applied to diverse ethnic and racial backgrounds.A detailed comparison of the proposed machine learning models in prior reports is summarized in Table 4.

Table 4 The performance comparison of published machine learning models on non-alcoholic fatty liver disease prediction
The application of machine learning in regarding NAFLD has evolved from the diagnosis with the noninvasive screening methods to liver biopsy.The new score achieves the reasonable performance with AUC of 0.70, in terms of differentiating between NAFL and NASH[11].Deep learning model was evaluated for diagnosis NAFLD based on ultrasound images and had a good predictive ability (AUC > 0.7)[34].Given the advancement in this field, it can also be used to quantify steatosis, inflammation, ballooning, and fibrosis in biopsy histology of patients with NAFLD having excellent results[35].
This study had strengths.First, this is the first United States population-based study with more than 3000 individuals from NHANES III.Secondly, we aimed to propose the simple model with a reasonable predictive power for NAFLD.This model will be potentially applied in clinical practice, especially by primary care providers, prior toreferring patients to hepatologists.This study had some limitations.(1) Missing data were inherited from the nature of population dataset from NHANES III; (2) NAFLD was diagnosed with ultrasonography, which is not the gold standard; however, it is the primary imaging modality for NAFLD diagnosis in population-based studies and available in primary care medical facilities; (3) At the time of writing this article, there was no external dataset available that like that of NHANES III for validating the models; and (4) It may be impossible to completely reproduce the machine learning algorithms in this study since randomization was used in the modeling process, such as data partitioning, cross validation, and creation of some machine learning models.This explains why we made the trained models available to the public so that anyone can use the models directly and/or validate our results.
CONCLUSION
Machine learning algorithms can summarize a large dataset into predictive models.The best performing model measured by the F1 score from our study is the ensemble of RUS boosted trees, which is a complex model that uses all 30 factors and behaves more like a black box to physicians.In contrast, the coarse trees model, which is composed of serum C-peptide and waist circumference, can generate a reasonable predictive performance, and most importantly is the simplest to use.To facilitate clinical decision-making, complex models should be incorporated into the electronic medical record system.This will lead to proper investigation and treatment selection for specific individuals at risk, helping to maximize healthcare resource utilization.If software deployment is not achievable, a simple model be used directly by physicians.Therefore, the model choice depends on the user objectives and resources.Therefore, the more complex model required more resources and was likely to outperform.The less complex model may not be the most accurate model but can be easily implemented and interpreted in clinical practice.
ARTICLE HIGHLIGHTS
Research background
Research motivation
Early patient identification using a simple method is highly desirable for preventing the progression of NAFLD.
Research objectives
To create machine learning models for predicting NAFLD in the general United States population.
Research methods
This study was designed as a retrospective cohort by using the NHANES 1988-1994.Adults (20 years and above in age) with gradable ultrasound results were included in this study.
Research results
Based on F1, the ensemble of ensemble of random undersampling boosted trees was the top performer (accuracy 71.1% and F1 0.56) while a simple model (coarse trees)had an accuracy of 74.9% and an F1 of 0.33.
Research conclusions
Although a simpler model such as coarse trees was not the top performer, it consisted of only two predictors: fasting C-peptide and waist circumference.Its simplicity is useful in clinical practice.
Research perspectives
The findings from this study can facilitate clinical decision-making for clinicians and also allow researchers to investigate the developed machine learning models.This will lead to proper investigation and treatment selection for specific individuals at risk,helping to maximize healthcare resource utilization.
杂志排行
World Journal of Hepatology的其它文章
- Coronavirus disease 2019 in liver transplant patients: Clinical and therapeutic aspects
- Focal nodular hyperplasia associated with a giant hepatocellular adenoma: A case report and review of literature
- Clinical outcomes of patients with two small hepatocellular carcinomas
- Acute liver failure with hemolytic anemia in children with Wilson’s disease: Genotype-phenotype correlations?
- Impact of biliary complications on quality of life in live-donor liver transplant recipients
- Serum zonulin levels in patients with liver cirrhosis: Prognostic implications
