Experimental investigation of cavitation instabilities in inducer with different tip clearances
2021-10-27LeXIANGYonghuTANHuiCHENKifuXU
Le XIANG, Yonghu TAN, Hui CHEN, Kifu XU
a Science and Technology on Liquid Rocket Engine Laboratory, Xi’an 710100, China
b Academy of Aerospace Propulsion Technology, Xi’an 710100, China
c Xi’an Aerospace Propulsion Institute, Xi’an 710100, China
KEYWORDS Cavitation instabilities;Inducer;Pressure fluctuation;Tip clearance;Visualization
Abstract To investigate the effect of tip clearance size on cavitation characteristics in a turbopump inducer,a series of experiments have been conducted in a newly developed visualization test facility using room temperature water as working fluid. The pressure fluctuations near the tip region were collected,and the cavity structures under various conditions were documented by a high-speed camera.It is found that large tip clearance distinctly reduces both the non-cavitation and cavitation performance. Three cavitation instabilities, super-synchronous rotating cavitation, synchronous rotating cavitation and cavitation surge have been carefully identified through combination of cross-correlation analysis of pressure signals and visualization results. Large tip clearance displays a remarkable stabilization effect on pressure fluctuation,cavitation surge totally disappears,and the range of occurrence of synchronous rotating cavitation becomes smaller for the large tip clearance,whereas super-synchronous rotating cavitation only occurs in the large tip clearance.The cavitation areas are smaller at large tip clearance,while the flow channels are more seriously choked when cavitation occurs heavily in comparison with those at small tip clearance,which may be responsible for the worse cavitation performance.
1. Introduction
Inducer is an axial pump installed upstream of the turbopump to improve the cavitation performance of the main pump in a Liquid Rocket Engine (LRE). It can work under partial cavitation condition due to its low entrance blade angle and large blade solidity. However, cavitation induced flow instabilities may occur even under design working condition. They can cause disastrous damage to the propulsion system, and then lead to launch failure. Thus the cavitation instabilities have attracted increasing attention all around the world over the past decades.
Generally, the cavitation instabilities can be classified into local instabilities and system instabilities. The former is represented by rotating cavitation,which is characterized as circumferential propagation of asymmetric cavities on different blades. The latter is represented by cavitation surge, which is considered to be the result of coupling of inducer frequencies and the feedline fluid inertance, and may lead to intensive oscillation of flow rate and pressure.Tsujimoto et al.conducted comprehensive experiments to identify various kinds of cavitation instabilities,and put forward theoretical methods to predict the inception conditions for the cavitation instabilities.Cervone et al.set up a visualization test facility for cavitating flow inside inducer, and verified a rotating stall type instability caused by tip cavity length oscillation.Guo et al.studied the rotating cavitation in a turbopump through experiments and numerical methods. Lee et al.investigated the cavitating flow inside a two-bladed inducer. Though several methods have been proved to suppress cavitation instabilities effectively,there is still no definitive explanation how the unstable phenomena occur. Many researchers believe that the tip leakage flow may play a major role in their occurrence.Kimura et al.performed numerical study to identify the vortex structures upstream of inducer. Their results indicated a close relationship between the occurrence of rotating cavitation and the interaction between a tip leakage vortex and a blade.This conclusion was supported by Lettieri et al.based on their experimental study of the model inducer of SSME.However, Tani et al.argued that the tip leakage vortex is not the primary cause of unsteady cavitation based on their numerical study of a three-bladed inducer. And the negative flow divergence caused by cavity collapse has greater influence on the flow angles. Hosangadiand Li et al.conducted numerical study of rotating cavitation, and found that the instability may result from the interaction of the cavity with neighboring blade. Kim and Songmeasured the flow angle near the tip region under the condition of rotating cavitation through PIV, and verified this interaction. Mitsuru et al.compared the flow field upstream of an inducer with and without a step on the casing through PIV measurement. Hong et al.investigated the cavitation characteristics of a twobladed inducer at different tip clearance sizes and verified that increasing tip clearance reduces the inducer’s head and increases the critical cavitation number. Li et al.argued that larger tip clearance is effective to suppress the synchronous rotating cavitation based on their experimental studies. Kim et al.investigated the effect of tip clearance on cavitation performance of a turbopump inducer by numerical simulation,and stated that smaller tip clearance induces stronger tip leakage cavitation.
The tip clearance should be as small as possible to obtain better hydraulic performance,whereas increasing tip clearance shows effective suppression on the rotor vibration according to the published works.In addition,the relationship between cavitation instabilities and the tip clearance size of an inducer is still debatable.Inspired by the objective to obtain better understanding about the cavitation characteristics of inducer, we perform a series of tests including visualization and dynamic pressure collection on the newly developed test facility. This paper discusses the characteristics of cavitation instabilities occurring in a scaled model inducer.Especially,as these unstable phenomena are closely related to the tip leakage flow, the experiments are carried out under two different tip clearances at room temperature in this study,and the discussion will show that how the width of tip clearance affects the cavitation characteristic of a rotating inducer.
2. Experimental method
2.1. Experimental system
The working fluid is water at room temperature.The test facility is a typical closed recirculation system.Working pressure inside the loop can be controlled through an air bag installed inside the tank.Working temperature can be adjusted through the temperature control system which is composed by electronic heater installed inside the tank and heat exchanger located upstream of the test section.A booster pump is located downstream of the test section, and it can provide the desired volumetric flow rate when the choked condition occurs.A flow control valve with high precision class and desirable dynamic stability is utilized to control the mass flow inside the loop.The control valve is conventional one instead of a silent valve;however, the filter located upstream of the test section may help reduce the cavitation nuclei. All the tests are performed after degassing water and the dissolved oxygen is about 6–8 ppm in this study. As discussed in our previous works,the dissolved oxygen in this range has little influence on the cavitation development inside the inducer. More detailed information about the facility can be referred to in Ref. 27.The tested inducer is a typical high solidity, constant-pitch,tapered-hub inducer (see Fig. 1), whose main design parameters are shown in Table 1.
2.2. Uncertainty analysis
In this study, two static pressure transducers with accuracy of 0.075% full scale (1.6 MPa) are installed upstream(x/D=7)and downstream(x/D= -5) of the leading edge of the inducer blade to obtain the static pressure.The temperatures are measured both inside the tank and upstream of the test section(x/D=9.5). An electromagnetic flow meter with uncertainty of 0.5%full scale(150 L/s)located downstream of the test section measures the volumetric flow rate in the loop.In addition,the transparent housing is prepared with 18 measurement points to install unsteady pressure transducers (see Fig.2(a)).Six unsteady pressure transducers with frequency response 50 kHz (0–690 kPa, uncertainty±0.007 kPa) are flush mounted to collect the pressure fluctuation near the tip region,and there are four located near the inlet,one in the middle and one near the outlet, as shown in Fig.2(b). The unsteady pressure signal acquisition rate is 5 kHz in this study,and it is collected continuously during a test.
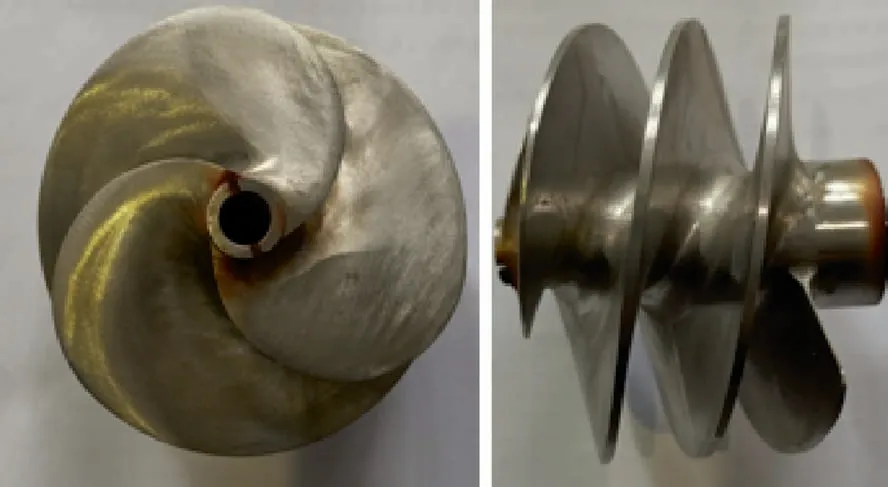
Fig. 1 Test inducer.
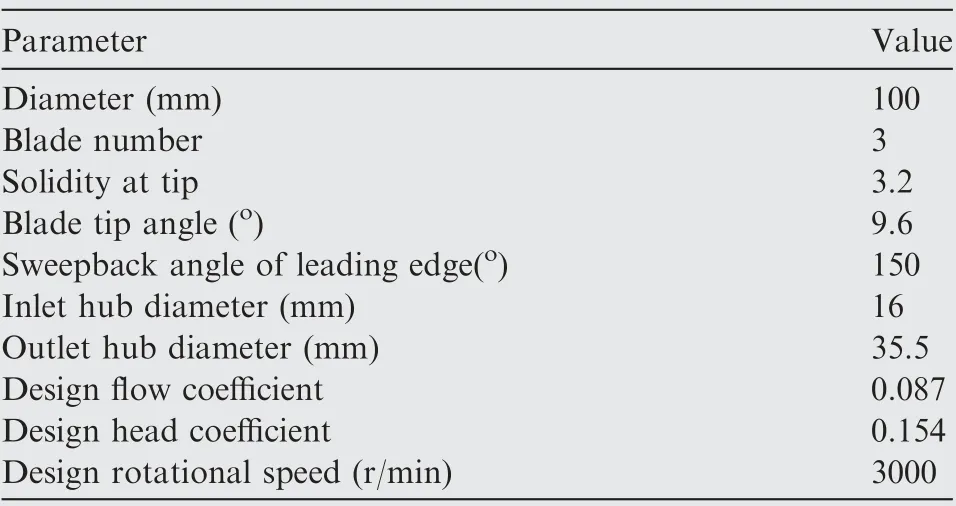
Table 1 Main parameters of model inducer.

Fig. 2 Test section.
Considering the errors of the transmission and process of test data in the data collection system,the measurement uncertainty of several main parameters can be concluded in Table 2.
In general, flow coefficient Φ, head coefficient Ψ and cavitation number σ can be used to characterize the performance of hydraulic machinery.

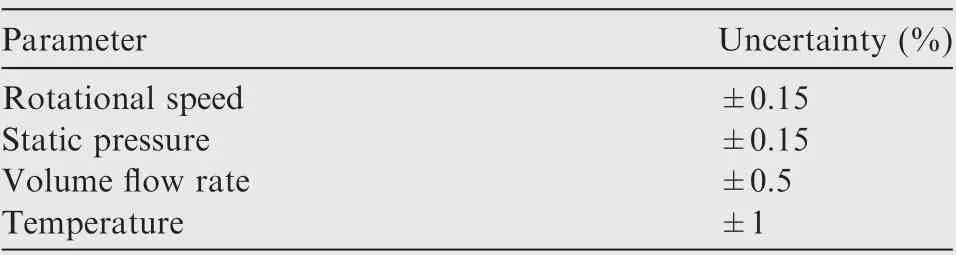
Table 2 Measurement uncertainty.
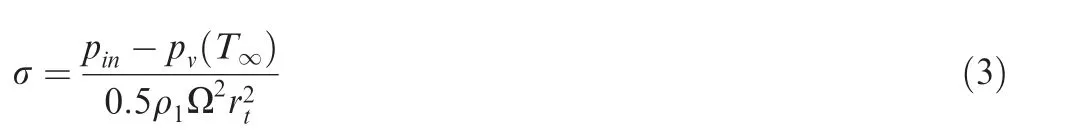
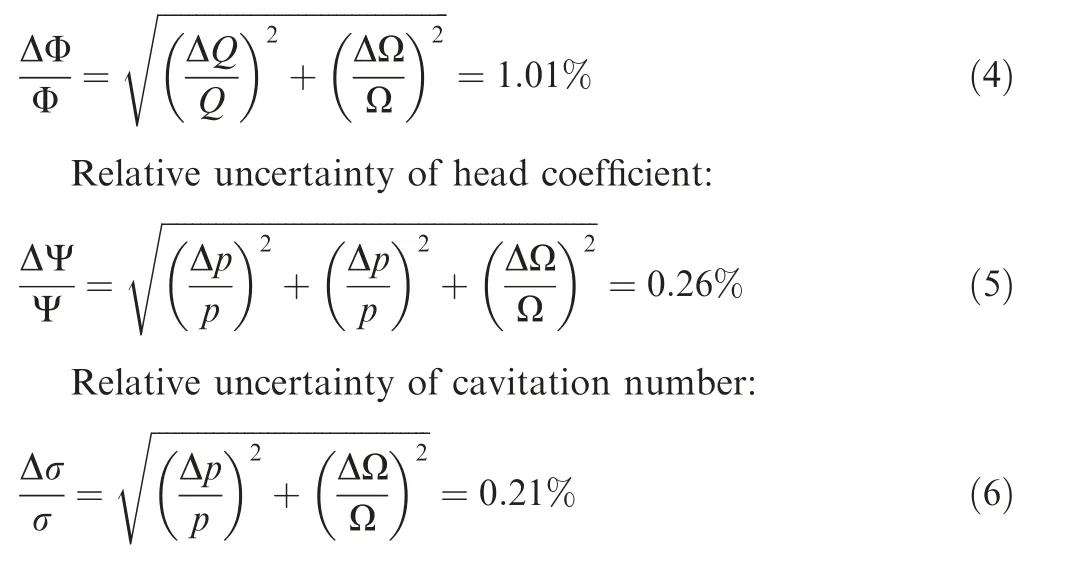
where Q is the volumetric flow rate, Ω is the rotating speed, ris the tip radius of the impeller,pand pare the static pressure at the outlet and inlet of the test section,and p(T)is the saturation vapor pressure corresponding to the inlet temperature.ρis the density of water.Thus the relative uncertainty of the three dimensionless parameters can be calculated as follows according to Table 2.
Relative uncertainty of flow coefficient:
A high-speed camera is employed to visualize the cavitating flow,the movies are acquired at 5000 fps with resolution ratio 1024×800 at exposure time of 1 ms in junction with a highintensity LED lighting system. A synchronizer is applied to link the high-speed camera system and the data acquisition system, and thus the cavitation number at which the videos are taken can be controlled accurately. In this study, the tests are conducted at constant rotational speed Ω=5000 r/min and constant temperature T=25 °C. For the non-cavitation tests, the suction pressure is kept constant, and the mass flow is reduced continuously.For the cavitation tests,the mass flow is kept constant, the suction pressure is decreased continuously, and both the static pressure and unsteady pressure are collected synchronously.
3. Results and discussion
3.1. Non-cavitation performance
The non-cavitation performance curves are shown in Fig. 3.The curves have negative slope for the investigated flow range,and the variation tendency is nearly linear.It is noticeable that larger tip clearance reduces the head performance,but the distinction is not as much as expected. Larger tip clearance will induce higher flow losses near the tip region, and thus the hydraulic performance is reduced. But according to Brennen,the head coefficients decrease rapidly only when the ratio of tip clearance (c) and blade diameter (D) is larger than 2%. The values of c/D are 0.5% (c=0.5 mm) and 1% (c=1 mm) in this study, and thus the diffidence of hydraulic performance for the two investigated tip sizes is not prominent.
3.2. Cavitation performance

Fig. 3 Non-cavitation performance at different tip clearances.
The cavitation performances at different flow coefficients are displayed in Fig. 4. As we can see, the head coefficients are kept constant at larger cavitation numbers, and they break down when σ reduces to a critical value. Note that the curves after breakdown points look steeper at smaller Φ, which is a typical characteristic of inducer. The comparison of curves with different tip clearances shows that larger c distinctly facilitates the head breakdown, and thus the cavitation performance is more sensitive to the tip clearance size in comparison with non-cavitation performance. To be clearly clarified, Fig.4(b) displays the critical cavitation number(σ) at different Φ and c (the critical σ is defined as the value when head decreases by 30% of non-cavitation head). As we can see,σis larger for higher c,indicating that the cavitation performance becomes worse for larger tip clearance. In addition, σalso varies with Φ for the smaller tip clearance, and there may be one flow coefficient at which the inducer has the best cavitation performance. It is interesting to note that the head degrades by about 5% when σ decreases to a certain value, forming a step on the curve before totally breaking down, especially under larger Φ conditions, and we will show that they are related to the cavitation instabilities occurring near breakdown points.
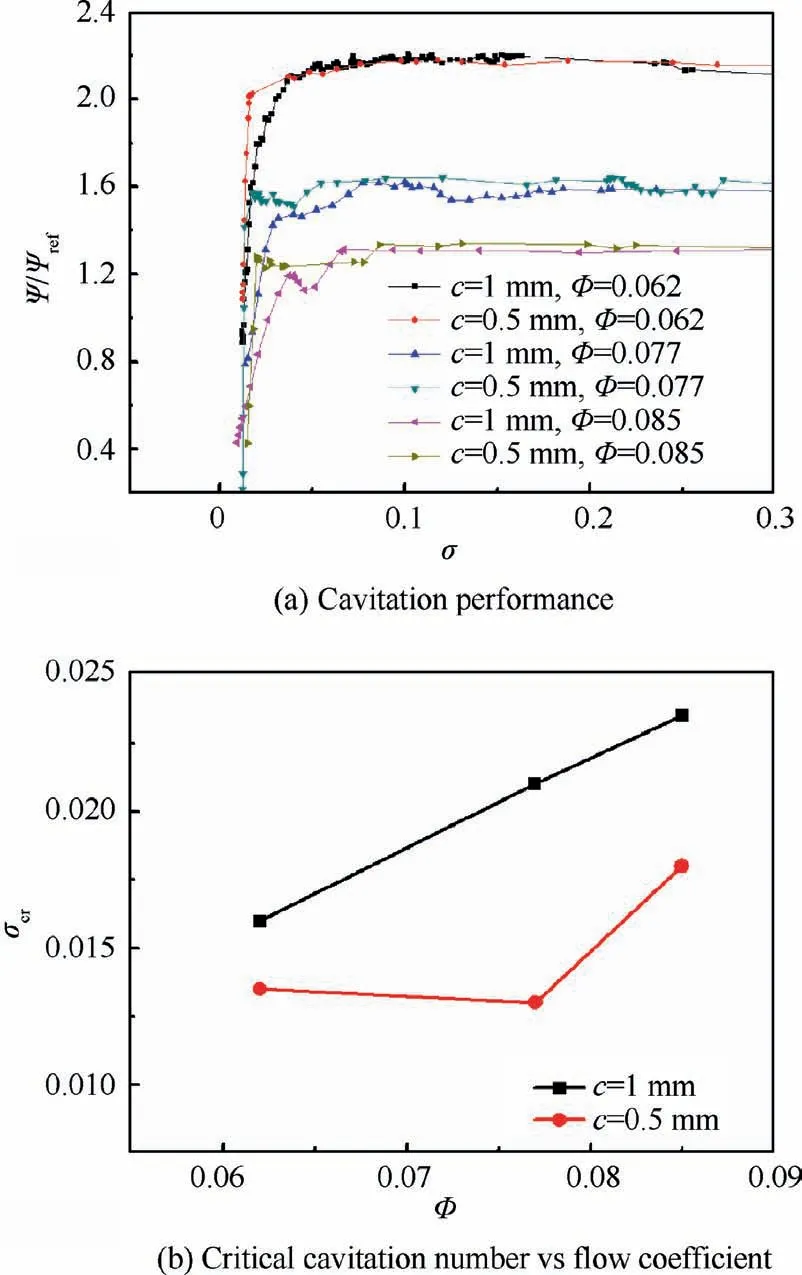
Fig. 4 Cavitation performance at different flow coefficients.
3.3. Cavitation instabilities
Fig. 5 shows the power spectrum of the inlet pressure fluctuation calculated by the Short Time Fast Fourier Transform(STFFT), and the curves on the upper right are cavitation number versus time. The parameters for the method are set as follows. The length of each segment is 4096, and there is 50% overlap between two adjacent segments. The window function is the Hanning window. As we can see, the main frequency component is 3f(fis the rotational frequency)at larger σ, and it is corresponding to the blade passing frequency.Its amplitude is low and stable at larger σ, and the amplitude starts to increase when σ decreases to a certain value, which may be attributed to the fact that the trailing regions of cavities stretch upstream to the measurement points (see Fig. 6).Thus the local pressure pulsation amplifies due to the continuous generation and collapse of abundant bubbles.It is notable that the amplitude is distinctly smaller at larger c,and the maximum value of amplitude for c=1 mm can be reduced to less than half of that for c=0.5 mm.When σ reduces to a certain value, the amplitude of 3fdecreases suddenly, and several other frequency components occur, f=1.18f(c=1.0 mm),f=f(both c=1.0 mm and c=0.5 mm) and f=0.07f(c=0.5 mm). To further identify the cavitation stabilities,we employ a cross-correlation analysis for signals from two unsteady pressure transducers installed at the same axial location with angular distance,and the results are shown in Fig.7.
For rotating instabilities,the phase difference(φ)of the signals and the angular distance Δθ of the unsteady pressure transducers can be applied to identify the number of rotating cells(n=φ/Δθ),and then the substantial frequency can be calculated as f=f/n (f is the detected frequency by FFT). The results calculated at larger σ are provided here as a verification of this method (see Fig.7(a)), and the phase difference is 186°for the blade passing frequency 3f,which is quite close to 180°(=3Δθ), implying that the method is credible.
For the larger tip clearance, a pair of frequency components f(=1.18 f) and f(=1.82 f=3 f-f) can be distinctly recognized after the disappearance of 3f(see Fig.7(d)). The phase difference between two signals from transducers with angular distance Δθ=120°is also 120°,implying that there is one cell propagating in the circumferential direction.Fig. 8 displays the variation of cavities under this condition,and the length of cavity on each blade keeps changing. If we focus on the shortest one on each blade, it is noticeable that it is propagating in the direction ‘‘Blade 3-Blade 2-Blade 1”,which is exactly the rotating direction of inducer. Note that the shortest cavity jumps back to Blade3 again after 5 turns,and the corresponding frequency is 0.2f, indicating that the cavities fluctuation is propagating in the circumferential direction at speed near 0.2frelative to a specific blade. In our previous works, an image processing method was developed to analyze the cavitation variation,but the cavitation areas are too large to use the method to extract when cavitation instabilities occur. Here, we use a simplified method to estimate the cavity length.
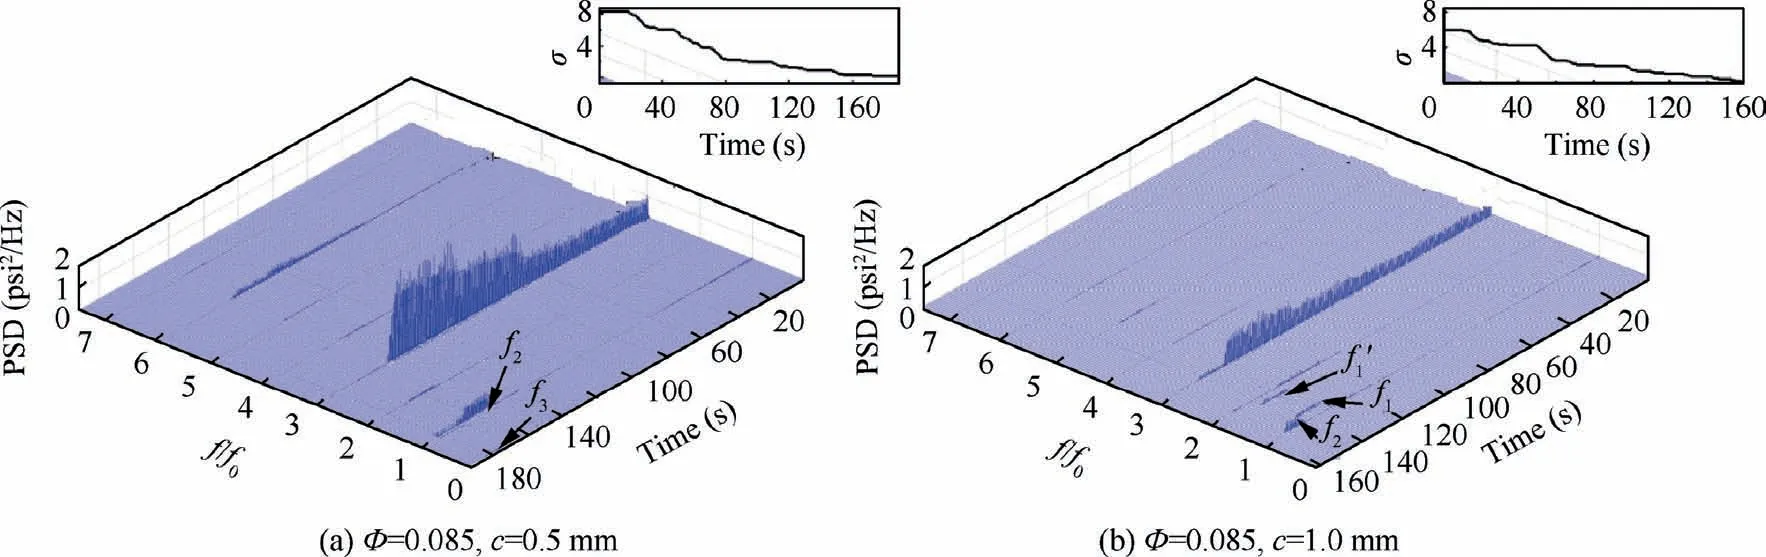
Fig. 5 Power spectrum for inlet pressure fluctuation (from sensor 5).

Fig. 6 Cavitating structures at different σ (Φ=0.085, c=0.5 mm).
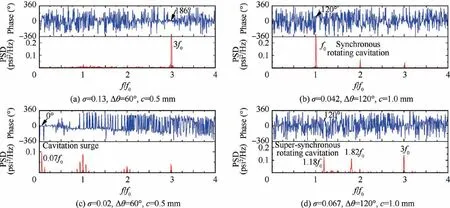
Fig. 7 Power spectrum, phase difference and correlation coefficient of two signals from unsteady pressure transducers at Φ=0.085.
After carefully evaluation of the cavitation area on each blade, it is found that the cavity appearance is quite stable.Especially, the inception location of every cavity is nearly the same for a specific blade,that is,the cavitation length is dependent on the cavitation trailing edge. As the pictures are acquired continuously at 5000 frame per second,the rotational speed of the inducer is 5000 r/min,and thus the circumference interval for successive two frames is 6°. The continuously acquired frames can be considered as a ruler to measure the cavity length. For example, if we focus on the cavity area on Blade 3 (see Fig. 9), the inception point of the cavity reaches a specific location (green line in Fig. 9) at moment N. And the trailing edge of the cavity reaches the same location(green line) at moment N. The cavity area may change during the moment Nto N, but we assume that the inception location of each cavity is constant for a specific blade.Thus the circumference cavity length at moment Ncan be estimated as (N--N)×6°, it multiplies by the radius of the inducer, and we can obtain the absolute value of the cavity length. The error of circumference cavity length by this method is±6°. The cavity length on every blade can be estimated by this means,and then we can obtain the cavity fluctuation versus time.
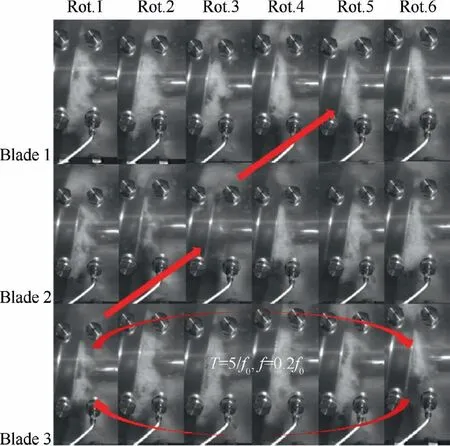
Fig. 8 Cavities variation on three blades (σ=0.067,c=1.0 mm, Φ=0.085).
The variation of cavities on the three blades is displayed in Fig.10,accompanying by three sinusoidal signals at frequency Δf (=0.18f) whose phases (A, B, and C) and amplitudes(A, Band C) are calculated according to the test data through trial and error. The sinusoidal signals can be considered as fitted results of the test data. The measured points agree quite well with the fitted curves,implying the substantial existence of frequency characteristics for the variation of cavity length.So cavities fluctuation is propagating at speed 0.18fin a relative coordinate system, then the propagating velocity ratio is 1.18fin absolute coordinate system, and this is the source of specific frequency of pressure fluctuation in Fig.7(d). This cavitation instability can be identified as SSRC(Super-Synchronous Rotating Cavitation).Note that the averaged non-dimensional cavity length is 0.74,and it is larger than the critical value 0.65 from which various modes of cavitation instabilities start to occur.
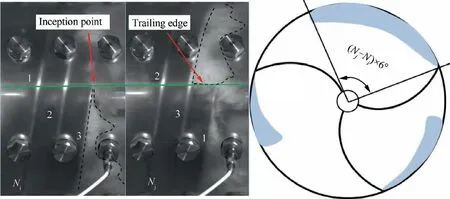
Fig. 9 Estimation of cavity length.
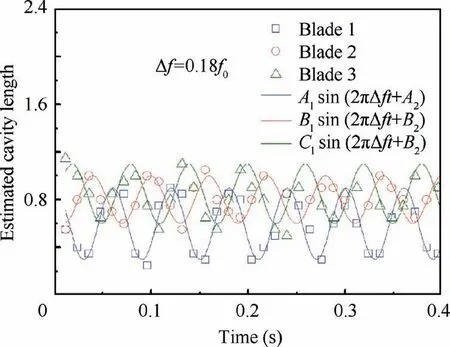
Fig.10 Variation of non-dimensional cavity lengths(σ=0.067,c=1.0 mm, Φ=0.085).
For the frequency f,its amplitude is much larger than that of the other frequency components (see Fig.7(b)). And the phase difference is 120°, which is the same as the angular distance Δθ of the unsteady pressure transducers (Δθ=120°),implying that there is one cell rotating at frequency f.Fig. 11 displays the cavitation length fluctuation under the condition when foccurs, and as we can see, the cavity on Blade 2 is the longest, while that on Blade 1 is the shortest.And this asymmetry is attached on blades without varying over blades, thus the rotating speed of this asymmetric attached cavity (f) is consistent with f, and becomes the primary frequency, and this instability can be identified as Synchronous Rotating Cavitation (SRC).
SRC also occurs at small tip clearance, but the inception cavitation number is not exactly the same. In addition, with σ decreasing further,a low order frequency f(=0.07f)occurs at smaller tip clearance, accompanied by its harmonics caused by the nonlinear interaction with the main frequency f.Referring to Fig.7(c), we can notice that the phase difference for fis 0°, indicating that fis an axial type instability. Fig. 12 shows the variation of cavity length, and as we can see, the cavity length fluctuation displays excellent periodicity with a period of 0.18 s.The corresponding frequency(5.5 Hz)is fairly consistent with f,indicating that fis caused by the periodical variation of the cavities length on the blades. In addition, the cavity length on the three blades changes nearly in the same phase, which is a typical characteristic of Cavitation Surge(CS).With σ decreasing further, the head breaks down rapidly (see Fig. 4).

Fig. 11 Variation of non-dimensional cavity length (σ=0.04,c=1.0 mm, Φ=0.085).
To clarify the relation of head performance and the cavitation instabilities, Fig. 13 displays the power spectrum of the three identified cavitation instabilities versus the cavitation number. As we can see, the head does not deteriorate when SSRC occurs, but it starts to decrease exactly when SRC occurs, indicating that the deleterious effect on pump performance of SSRC is not as much as that of SRC.The head seems to increase when the effect of SRC becomes weaker and CS occurs. After total breakdown, all the cavitation instabilities vanish.
The aforementioned discussion is based on the pressure fluctuation from the inlet region, and to further clarify the characteristics of cavitation instabilities, we refer to the pressure fluctuation collected near the middle and outlet region(see Fig. 14). As we can see, the specific frequency of SRC can still be detected near the middle region, but it is obscure in the signals from outlet region (see Fig.14(b)), and thus SRC can be characterized as a kind of local instabilities.SSRC is also local instability. However, the specific frequency of CS can be detected near the inlet, middle and outlet region (see Fig.14),so CS can be characterized as a kind of system instabilities. These characteristics are also in accordance with Tsujimotos’ works.
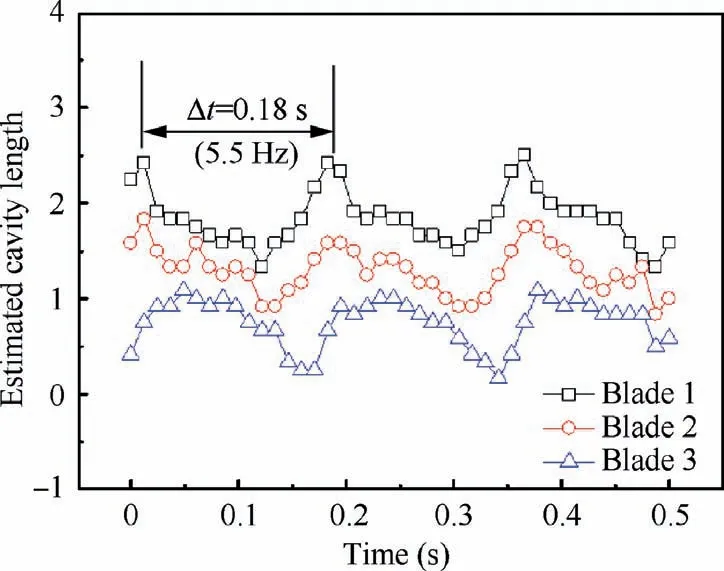
Fig. 12 Variation of non-dimensional cavity lengths (σ=0.02,c=0.5 mm, Φ=0.085).

Fig. 13 Cavitation performance and power spectrum at various frequencies.
3.4. Effect of tip clearance on cavitation characteristics
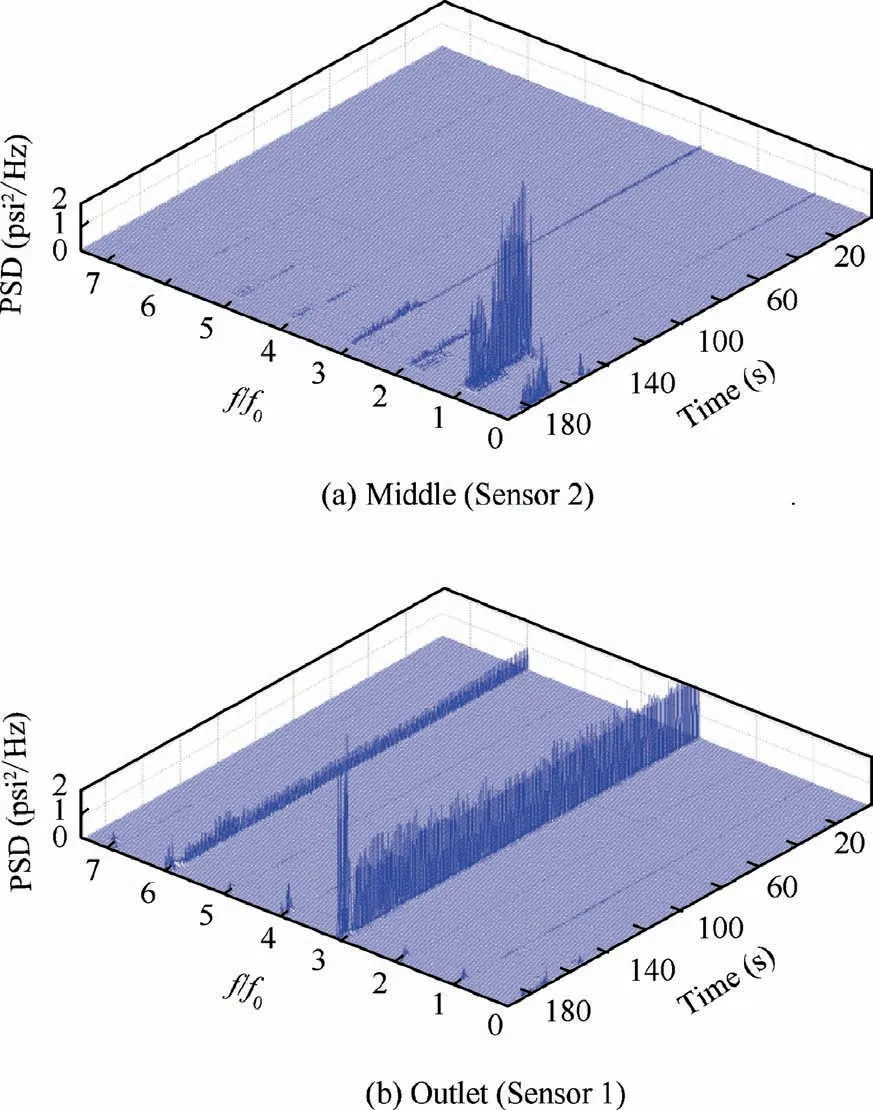
Fig. 14 Power spectrum for middle and outlet pressure fluctuation (c=0.5 mm, Φ=0.085).
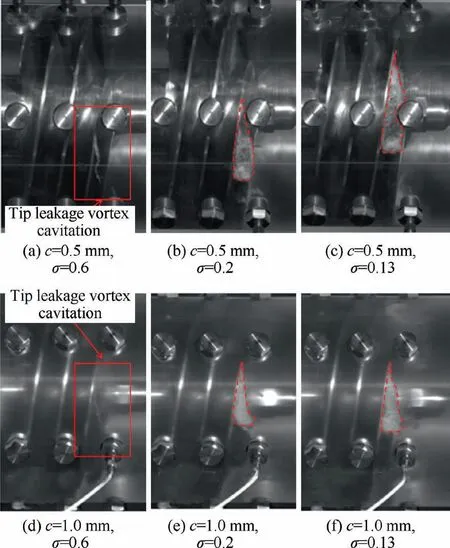
Fig.15 Comparison of cavity structures for two tip clearances at Φ=0.085.
Parts of the identified cavitation instabilities still exist under other conditions, and their occurrences are concluded in Table 3. As we can see, the CS totally disappears at larger tip clearance for the three flow coefficients,and thus the axial cavitation instability seems to be more sensitive to the tip clearance. SRC is the most common one as it occurs at all the investigated flow coefficients, and it is found that larger tip clearance distinctly reduces the occurrence range of SRC,which is consistent with the test results of Li et al.However,it is interesting to note that the SSRC only occurs at larger tip clearance for Φ=0.085, and the test has been repeated under the same condition to make sure that its occurrence is not accidental. This result seems contrasting to the study of Yoshida et al.who used a modified inlet housing to suppress the SSRC.The characteristic may be related to the specific inducer geometry, and thus the tip clearance should be treated carefully to design an inducer avoiding cavitation instabilities.Increasing tip clearance may not always be a suitable method to suppress the cavitation instability.
The aforementioned discussion inspires us to take a deep insight into the cavitating flow for the two tip clearances. As we can see in Fig. 15, the cavitation occurs in the tip leakage vortex firstly, named Tip Leakage Vortex Cavitation (TLVC),and the appearances are dissimilar for the two tip clearances.It is twisted to a helical strip swinging periodically at c=0.5 mm, while it is still a trail of bubbles at c=1 mm,indicating that the inception cavitation number is larger for the smaller tip clearance. This may be attributed to larger blade loading near the leading edge of the blade tip, and thus a stronger tip leakage flow is induced at smaller c, which is more prone to cavitation. With σ decreasing, the shear cavitation occurring in the leakage flow is connected with the TLVC,forming a stable Tip Leakage Cavitation (TLC) with small cavities shedding periodically. The deciduous cavities are too small to touch the leading edge of the adjacent blade,and thus the cavities on the three blades are uniformly distributed.Note that the size of TLC is smaller at the same σ, while the backflow vortex cavities seem to increase for larger c.However,larger tip clearance results in worse cavitation performance according to Fig. 4, which seems inconsistent with the tendency shown in Fig. 15.

Fig. 16 Comparison of cavity structures when SRC occurs for two tip clearances at Φ=0.085 (σ=0.04).

Table 3 Occurrence range of cavitation instabilities.
To clarify the reason of worse cavitation performance at larger tip clearance, we refer to the cavity structures at much lower cavitation number (see Fig. 16). Although the SRC occurs at both the two tip clearances at σ=0.04, the cavities distribution is distinctly different. For the smaller tip clearance,the cavity on Blade 1 is the longest,and it almost reaches the outlet of blade channel,while those on Blade 2 and Blade 3 almost disappear.The reason may be that the cavitating flow is difficult to pass across the small tip clearance, and thus the longest cavity is confined in one flow channel, and the other two flow channels are not choked, so the total flow channel is partially choked. For the larger tip clearance, the cavity on Blade 2 is the longest, but still shorter than that for c=0.5 mm. But it is likely that the cavitating flow is prone to pass across the relatively larger tip clearance, and thus the cavity on Blade 3 is much longer and larger than that for smaller tip clearance, resulting in the fact that the flow channel between Blade 1 and Blade 3 is also choked seriously. Thus the choked degree is more severe overall for the larger tip clearance,which may lead to the worse cavitation performance as shown in Fig. 5.
4. Conclusions
As the tip clearance size is closely related to the cavitation characteristics of inducer, a series of experiments have been conducted to characterize the cavitation instabilities in a three-bladed inducer with two tip clearance sizes.Six unsteady pressure transducers were installed in the housing to collect the pressure fluctuation near blade tip region.The cavitation structures were also documented by a high-speed camera. The cavitation characteristics of the inducer are discussed in details in this paper.
(1) Larger tip clearance size of inducer distinctly reduces the head coefficients under non-cavitation condition. The flow channels are choked seriously when cavitation occurs heavily at larger tip clearance size, and thus the cavitation performances are also deteriorated in comparison with smaller tip clearance.
(2) The amplitudes of cavitation induced pressure fluctuations are increased with decreasing cavitation numbers.Several cavitation instabilities occur near breakdown points. Three kinds of cavitation instabilities have been carefully identified through the combination of dynamic signals reduction and visualization results,and their formation is closely related to the variation of the length of tip leakage cavities. The sequence of their occurrence is super-synchronous rotating cavitation, synchronous rotating cavitation and cavitation surge as cavitation number decreases, and only synchronous rotating cavitation causes visible degradation of the head performance.
(3) The amplitudes of pressure fluctuation are remarkably reduced at larger tip clearance,indicating a stabilization effect of large tip clearance. Considering the cavitation instabilities, cavitation surge totally disappears, and the range of occurrence of synchronous rotating cavitation becomes smaller for larger tip clearance. However,super-synchronous rotating cavitation only occurs in the large tip clearance case in this study, and thus the tip clearance size should be treated carefully to design an inducer avoiding cavitation instabilities.
Declaration of competing interest
The authors declare that they have no known competing financial interests or personal relationships that could have appeared to influence the work reported in this paper.
Acknowledgement
This study was supported by the National Basic Research Program of China (No. 613321).
杂志排行

CHINESE JOURNAL OF AERONAUTICS的其它文章
- Optimal trajectory and downlink power control for multi-type UAV aerial base stations
- Effects of flow parameters on thermal performance of an inner-liner anti-icing system with jets impingement heat transfer
- Effects of wing flexibility on aerodynamic performance of an aircraft model
- Aerodynamic performance enhancement of co-flow jet airfoil with simple high-lift device
- Adaptive fuzzy terminal sliding mode control for the free-floating space manipulator with free-swinging joint failure
- Influence of longitudinal-torsional ultrasonicassisted vibration on micro-hole drilling Ti-6Al-4V