Suppressing unsteady motion of shock wave by high-frequency plasma synthetic jet
2021-10-27YnhoLUOJunLIHuLIANGShngungGUOMengxioTANGHongyuWANG
Ynho LUO, Jun LI, Hu LIANG,*, Shngung GUO, Mengxio TANG,Hongyu WANG
a Science and Technology on Plasma Dynamics Laboratory, Air Force Engineering University, Xi’an 710038, China
b Hypervelocity Aerodynamics Institute, China Aerodynamics Research and Development Center, Mianyang 621000, China
KEYWORDS Flow control;Plasma synthetic jet;Shock wave/boundary interaction;Supersonic flow;Unsteady motion
Abstract Three Plasma Synthetic Jet Actuators (PSJA) under the high-frequency actuation are used to control the Shock Wave Boundary Layer Interaction (SWBLI), a high-speed schlieren image processing method based on spatial Fourier transform as well as snapshot proper orthogonal decomposition were used to study the control effect of high-frequency plasma synthetic jet on lowfrequency unsteadiness of SWBLI. The analysis of the base flow shows that the separated shock wave actually has both large- and small-amplitude vibrations at low frequency. And the results revealed that the PSJA with an operating frequency of 2 kHz has the ability to reduce the energy of low-frequency component of shock wave motion, indicating that the 2 kHz actuation can effectively suppress low-frequency unsteadiness of the separated wave.Compared with the actuation frequency of 2 kHz,the energy of low-frequency component of the shock wave is enhanced under the 8 kHz actuation,which aggravates the low-frequency unsteady motion of the shock wave.It is likely that the actuation frequency is too high,thus the intensity of the precursor shock wave induced by PSJA becomes weaker. Additionally, as the 4 kHz actuation is applied, the pulsation of the separation region was enhanced, it is speculated that the actuation frequency is coupled with the oscillation frequency of the separation region.
1. Introduction
SWBLI is an inevitable problem in supersonic flow.The strong adverse pressure gradient induced by shock wave will cause boundary layer separation and unsteady motion of shock wave.It is also the main source of the aerodynamic load of aircraft. Most importantly, the oscillation frequency of the separation shock wave is similar to the structure resonant frequency, which can aggravate the pressure fluctuations on aircraft surface and even damage the structural components of the aircraft,In order to reduce separation zone and control the unsteady motion of the separation shock wave, various methods have been proposed. Traditional active flow control techniques such as slotting, blowing and suctionneed additional mechanical components or gas source.Passive flow control methods, such as vortex generator,will generate additional drag and has poor adaptability to working conditions. The principle of the plasma flow control, which served as a novel active flow method, is to utilize the plasma movement in the electromagnetic filed or the temperature and pressure changes caused by gas discharge to impose a disturbance to the flow filed.Plasma active flow control technology has the advantages of rapid response, broad bandwidth, strong control authority, and without the moving part,which is favored by many scientific researchers. Plasma synthetic jet actuator is a new type of flow control technique that combines plasma flow control with synthetic jet. Zhang et al.investigated the inner characteristic of plasma synthetic jet actuator via numerical simulation. Santhanakrishnan and Jacobproposed the concept of Plasma Synthetic Jet Actuator(PSJA)for the first time. PSJA has a cavity which two electrodes are implanted in. When the high voltage is applied between the two electrodes, the breakdown voltage is reached, then the pressure and temperature of the actuator cavity sharply elevated via arc discharge heating, the high-pressure gas ejected through an orifice. After the jet brings high-pressure gas out of the cavity, the pressure in the cavity decreases, and then the cavity inhales gas to enter the next cycle.The working cycle of PSJA can be divided into three stages:energy deposition,jet discharge and refill.The Applied Physics Laboratory of Hopkins University first began to research the aerodynamic actuation of plasma synthetic jets, and proposed plasma aerodynamic actuator with spark discharge that can generate jets with a peak velocity of 100 m/s in 2003.Texas State University investigated the flow control of synthetic jet in supersonic flow filed in 2008.The PSJA produced by University Toulouse 3 in France has a peak velocity of Mach number Ma=1.3 in quiescent air.Su et al.conducted flow control experiment using multichannel discharge plasma synthetic jet actuators. Wang et al.developed new type of three-electrodes plasma synthetic jet actuator. Zong and Kotsonisinvestigated the influence of the non-dimensional energy deposition and the dimensionless frequency on the formation and evolution characteristics of the plasma synthetic jet, via Particle Image Velocimetry (PIV) system. Narayanaswamy et al.investigated the control effect of PSJA on ramp-induced SWBLI and concluded that the frequency of the separation shock wave can be adjusted by the pulse jet generated by actuator. Wang et al.investigated the effect of high-frequency counter-flow plasma synthetic jet actuator on ramp-induced SWBLI. PSJA has the advantages of good stability, high working bandwidth and strong control ability.Thus, plasma synthetic jet is a technology with a wide range of applications. In this paper, the high-frequency actuation is applied to SWBLI.
Array discharge has the advantages of promoting discharge efficiency and expanding area of actuation. Zhang et al.investigated the interaction between a ramp induced shock wave and a PSJA array by using high-speed schlieren imaging technique. Tang et al.investigated the influence of the streamwise pulsed arc discharge array to SWBLI. This paper discusses a method for controlling the unsteady motion of separated shock wave by PSJA array. Fast Fourier Transform(FFT) and Snapshot Proper Orthogonal Decomposition(SPOD) are used to process images captured by high-speed schlieren system.
2. Experimental setup
2.1. Wind tunnel and experimental model
The experiment was conducted in an air-breathing supersonic wind tunnel (Ma = 2) located in the Air Force Engineering University,which consists of air inlet,rectifying section,Laval nozzle,test section,and vacuum chamber.Fig.1 is a schematic diagram of the supersonic wind tunnel. In the experiment, the wind tunnel tank was first sealed, and the vacuum chamber system was used to pump the air in the vacuum chamber to low-pressure (<6 kPa) to reach the pressure ratio condition.The wind tunnel is started by means of electric membrane rupture. The ambient air enters from the air inlet and a uniform flow field with low turbulence is formed after going through the rectification section. The uniform flow is accelerated by Laval nozzle and achieves Ma = 2 at the outlet of the nozzle then accesses to the test section. Optical observation windows are installed on both sides of the test section to diagnose the flow field.In the experiment,the stagnation pressure of incoming flow of P=(95.6±3%)kPa,stagnation temperature of T= (300 ± 3%)K, the unit-length Reynolds number in the experiments (Re/l = ρU/μ) is 1.19 × 10/m, ρand Uare respectively the incoming flow density and velocity, μ =1.12×10Pa∙s is the local dynamic viscosity,l is the characteristic length of the model (l=300 mm). Incoming flow parameters are shown in Table 1. The stable operation time of the wind tunnel is approximately 2–3 s.
This paper refers to the compression ramp model of Verma et al.to investigate the flow control effect of PSJA on the unsteady characteristics of SWBLI. The test model consists of a flat plate (L = 400 mm, W = 110 mm) with a 24°ramp at its rear part,as shown in Fig.2.The flat plate and compression ramp are all made of insulating acrylic material, and the distance between the flat plate leading edge to the ramp foot is 300 mm, as shown in Fig. 2(a). A rectangular groove with a depth of 1 mm is reserved for the installation of boundarylayer trip to generate the fully developed turbulent boundary layer, and the dimensions of the rectangular groove are 110 mm × 10 mm. Additionally, a spanwise array of three PSJAs were installed 40 mm upstream the compression ramp.Two tungsten electrodes with a diameter of 1 mm are used as the anode and cathode of PSJA, as shown in Fig. 2(c). The tungsten electrodes are buried inside the insulating cylindrical base, which is then embedded in the mounting hole with a depth of 5 mm on the subface of the flat plate. The cylindrical insulating base is made of Teflon with a diameter of 6 mm and a height of 4 mm.A 1 mm high sealed cavity is formed with the cylindrical insulating base inserted into the mounting hole.This is the cavity of PSJA and the cavity volume is about 28 mm. An orifice with a diameter of 2 mm and a depth of 1 mm is opened on the upper surface of the cavity. When the PSJA is triggered, the energy is released in the form of arc discharge, and then the temperature and pressure in the cavity is sharply increased. Thus, the air will be expelled from the orifice in a high-speed, which enjoys potential to control SWBLI. In this paper, three PSJAs are connected through high-voltage wires, and the spacing between individual actuation is 15 mm.A high-voltage nanosecond pulse power supply(the maximum power of 200 W, the maximum frequency of 100 kHz) designed by Xi’an Jiaotong University is used to drive three PSJAs, the rising and falling time of one pulse are set to 50 ns, and the duty ratio is 10%.
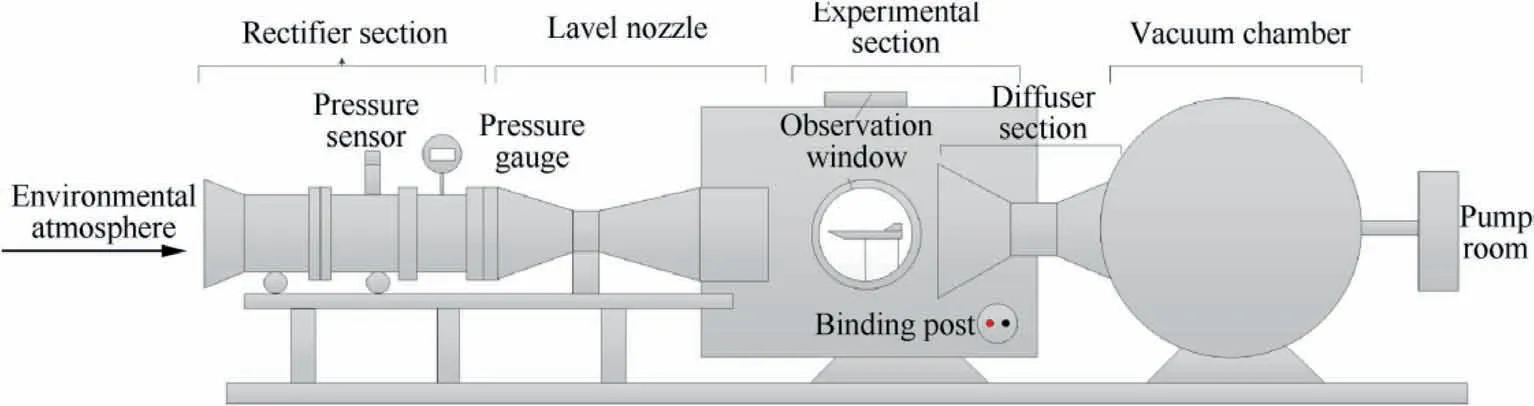
Fig. 1 Schematic diagram of wind tunnel structure.

Table 1 Ma = 2 wind tunnel incoming parameters.

Fig. 2 Schematic diagram of test model.
2.2. High-speed schlieren imaging
High-speed schlieren imaging was used to record the flow information and study the interaction between the plasma jet and SWBLI in this paper.A typical reflective parallel light patterning instrument with a Z-type light path arrangement was used.A xenon lamp served as the light source.The light is collimated and focused by 3 m focal length concave mirror,and a horizontal knife filter is placed in front of the imaging system to enhance the sensitivity.A high frame rate CCD camera was used to capture the schlieren images. The sampling frequency of schlieren imaging is set to 50000 frame/s, which is convenient to extract the characteristic frequency of SWBLI. The camera exposure time was set to be 1 μs, the image resolution of 272 pixel×128 pixel,the length of the slope is 0.068 m,and the image distance resolution is 0.275 mm/pixel. In this paper,three tests were conducted with different actuation frequency.And in each experiment,the schlieren images of base flow and modified flow were both recorded. Attributed to the synchronization system,25000 baseline schlieren snapshots could been recorded before the plasma flow control is switched on, and then the schlieren image sequence under actuation was recorded. The actuation frequency of three tests were set to 2 kHz, 4 kHz, and 8 kHz. The results of modified flow were recorded as Actu-2k,Actu-4k,Actu-8k,and the corresponding base flow field were recorded as Baseline-2k, Baseline-4k,Baseline-8k.
2.3. Spatial Fourier transform and snapshot proper orthogonal decomposition
The spatial Fourier transform method, as well as SPOD, were used to analyze schlieren image sequence.The spatial Fourier transform is used to educe the characteristic frequency of different regions of flow field.The number of images within time interval tis supposed to be N, and each image has npixel × npixel. FFT is applied to the gray scale time series of every pixel,the obtained data is used to calculate the power spectra which can confirm the energy of a characteristic frequency at a specified pixel.As the FFT results of all pixels have been calculated, the spatial distribution of energy at specified frequency is obtained. The dimensionless parameter Strouhal number representing the flow frequency is calculated via formula St = fL/U. f is the dominant flow frequency, which is corresponding to the maximum frequency of power spectra.Lis the length of the separation zone of SWBLI, which is defined as the distance between the position of separation shock wave and corner of the ramp. Uis the wind tunnel inflow velocity (505 m/s). Proper Orthogonal Decomposition(POD)is one of the main statistical way of analyzing dominant structure in the flow field. The motion characteristics of the dominant structure in the flow field can be divided into several modes by POD. The grayscale of the schlieren image is taken as input data. The flow field at time point tis defined as a snapshot image,and the total number of snapshots is N.Each image contains n× n(223 × 294) data points. These images are used to get the time-dependent tensor,as shown in the following formula:

Among all the modes, the mode with significant effect represents the dominant characteristic of the flow field. Thus, all large-scale structure can be expressed by the addition of lowenergy modes.
3. Results and discussion
3.1. Baseline SWBLI
3.1.1. Structure characteristic
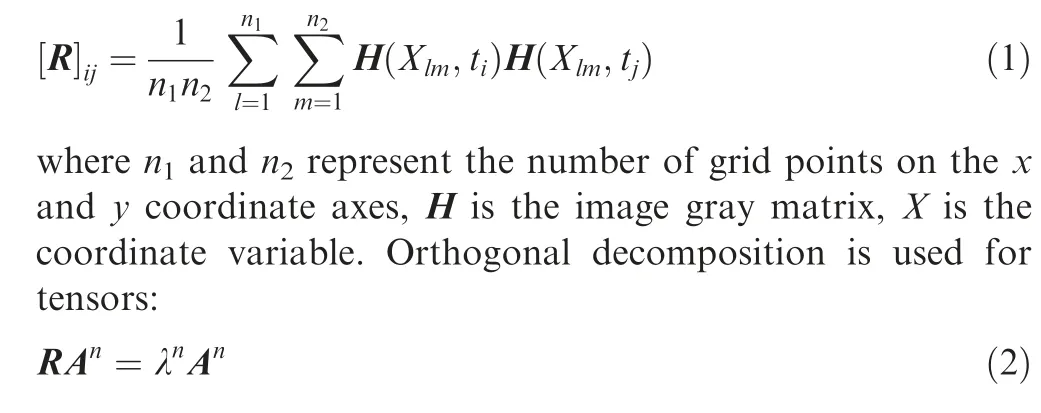
The characteristic of the baseline SWBLI is firstly studied in order to have a better understand on flow filed without actuation. High-speed camera is used to get the schlieren snapshot.As shown in Fig. 3(a), the schlieren images clearly show the separation shock wave, the incoming boundary layer and the thickened reattached boundary layer. The small-scale vortex in the turbulent boundary layer evolves into large-scale vortex after passing through the shock wave. Additionally, the average schlieren image was also obtained through 10000 instantaneous schlieren snapshots. As shown in Fig. 3 (b), the thickness of incoming boundary layer is about δ = 3.3 mm,and the length of separation zone is about 13.5 mm (approximately 4.1δ). The distance between the ramp and the actuator is about 12.1δ, and the distance between the separation shock wave and the actuator is about 2L(≈8δ).
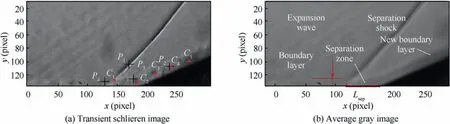
Fig. 3 Base flow field.

Fig. 4 Comparison of SPOD reconstructed flow field and original transient flow field.
In order to further investigate the structure characteristic of the SWBLI, SPOD is used to decompose the flow field into a series of modes for extracting the coherent structure in the flow field. The time sequence with 10000 images of base flow(Baseline-2k) is decomposed into series of POD modes. All modes are sorted according to its energy contribution rate.Modes with a lower order have a higher energy contribution rate. The schlieren images reconstructed via modes are compared with original transient schlieren image, as shown in Fig. 4. The flow field reconstructed via first 20-order modes clearly shows the shock wave, and the large-scale vortex in the reattached boundary layer.The number of small-scale vortexes in the reconstruction flow increases with the modes order increasing.The greater the reconstruction order,the higher the degree of consistency between the reconstruction flow field and the original flow field. This shows that the SPOD reconstruction flow field has a high degree of credibility.
The first-order mode in the modes obtained by SPOD decomposition accounts for more than 99.2% of the energy.The first-order mode reflects the steady information of the flow field,and flow field reconstructed by this mode is similar to the gray average flow field. After removing the first-order mode,other modes reflect the unsteady information of the flow field.Fig.5 shows several typical modes obtained by SPOD decomposition. Mode 3 reflects the low-frequency motion of the shock wave; Mode 4 reflects the large-scale and lowfrequency oscillation of the shock wave; Mode 9 shows the high-frequency and large-scale vortex structure in the reattached boundary layer; Mode 24 is the mode of the smallscale vortex structure in the reattached boundary layer; Mode 27 shows the high-frequency oscillation of the shock wave;Mode 43 shows the high-frequency and small-scale vortex structure in the reattached boundary layer. It can be seen that the unsteady motion mode (Mode 3, Mode 4) of shock wave account for a high proportion of energy.
Fig. 6 shows the power spectra of different order modes.Mode 2, Mode 3 and Mode 5 displayed high power value at low frequency, which reflected the dominant low-frequency motion of the separation wave. Additionally, the shock wave also has the characteristic of high-frequency pulsation, which indicates its broadband oscillation characteristics (St ~ 0.01–0.07). Then, Mode 9, Mode 13, Mode 16 respectively corresponds to the large-scale and small-scale vortex structure of the flow field, which has a dominant pulsation in high frequency. And the power spectra energy of Mode 9 is higher than the other two modes, which indicates that the pulsation of large-scale vortex is stronger.
SPOD technique educe the correlate structure in baseline flow.However,the frequency feature of each region in the flow field does not clear in SPOD results.In order to reveal the frequency feature of flow field, the FFT technique is used to determine the dominant frequency of separation region, and correlation analysis of two points is used to distinguish correlation of different regions in flow field.
3.1.2. Frequency characteristic
Furthermore, four pixel points (P–P) in the flow field are selected for statistical analysis, which are respectively located in the separation wave foot, the reattached boundary layer,the separation bubble, and the incoming boundary layer.Power spectra analysis is performed on the grayscale time sequence of four pixel points (P–P) obtained from 20000 instantaneous schlieren snapshots(N=20000).The grayscale data are divided into ten blocks,and each block includes 2000 data points. FFT technique is applied to calculate each block,and the power spectra is obtained by the average data of ten blocks. Fig. 7 indicates the separation wave foot has wide bandwidth and the dominant oscillation frequency is focused at low-frequency around St = 0.03–0.07, which confirms the low-frequency unsteadiness of the separation wave. Different from the point P,the power spectra at point P–Pare all featured in high-frequency oscillation (St > 0.3), note that the energy has a decreasing tendency from the reattached boundary layer to the separation zone and incoming boundary layer,which indicates that the flow pulsation is weakened. This is because the turbulence of the incoming boundary layer has been enhanced after passing through the shock wave.
Fig. 5 Typical modes obtained by SPOD decomposition.

Fig. 6 Power spectral density of different modes.
In this paper,correlation analysis of two points is also used to identify the coherent structure in the flow.The gray value of the specified pixel points in the nth image is assumed to be I(n).The coordinate of another pixel point(monitoring point)on the image is(k,l),and the gray value is I(n).Then the correlation between the time sequence of the monitoring point and of specified point can be calculated. The crosscorrelation coefficient can be calculated by the following formula:
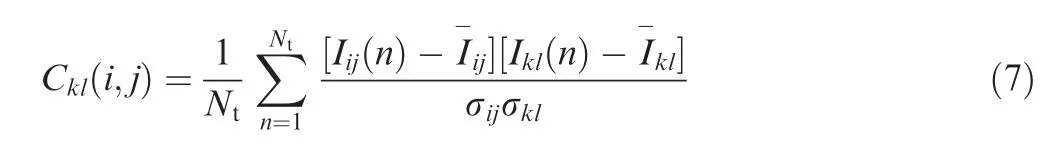

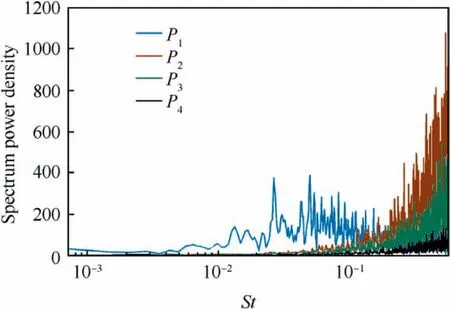
Fig.7 Power spectra of gray time sequence at monitoring point.
The image resolution of 200 pixel×80 pixel is used for correlation calculation.Cross-correlation calculation is performed between each pixel and monitoring point (k, l). Monitoring point is selected in the base flow field (Cof shock foot position, Cof separation region, Cand Cof the reattached boundary layer)to calculate the correlation coefficient between other points and monitoring point. The correlation of flow field is calculated with the point Cis selected as the monitoring point,as shown in Fig.8(a),the point in the location of the shock wave or near the shock wave have a strong correlation with point C.A conclusion can be drawn that the shock wave oscillates with a certain amplitude. The points at the separation zone, the reattached boundary layer and in the location of the shock wave is uncorrelated, but the coherent structure of the separation region and the reattached boundary layer can be identified. Fig.8(b)–(d)indicate that the scale of the vortex gradually increases with the boundary layer developing downstream.
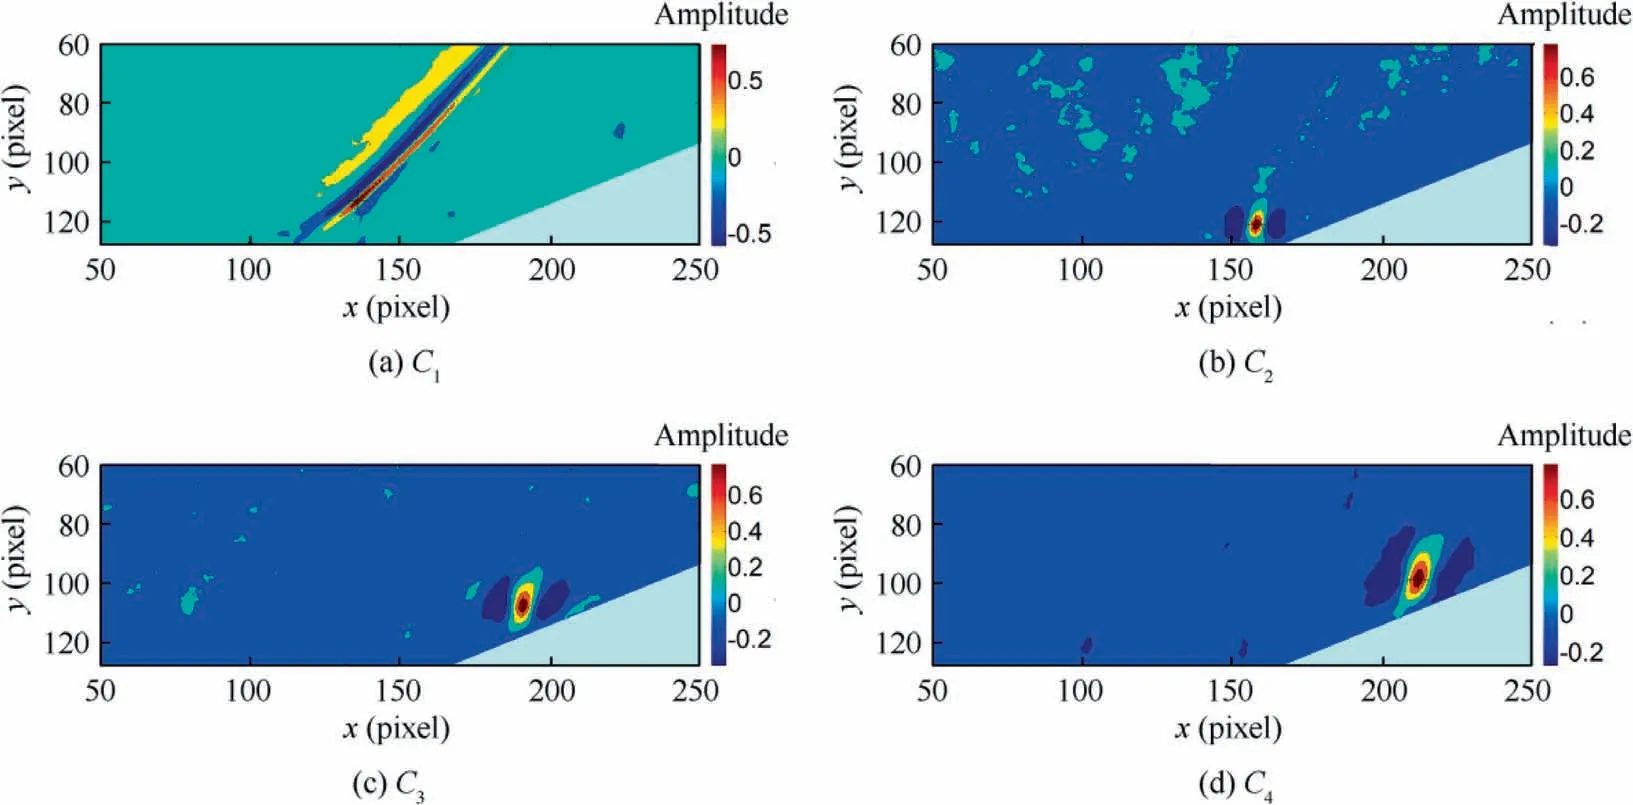
Fig. 8 Correlation between other points in flow field and monitoring points (C1–C4).
Fig. 9 shows the distribution of spatial spectra of the specified frequency.The power spectra extracted with the specified frequency of f= 0.8 kHz (St = 0.02) and f= 2 kHz(St = 0.05), which indicates that the power spectra energy in the shock wave location is high, and it is low in the incoming boundary layer,the separation zone and the reattached boundary layer, as shown in Fig. 9(a)–(b). It can be seen from the image that the dominant frequency of separation shock vibration is low.The frequency band of separation shock motion is broad since the energy in the shock wave region is all high for St=0.02 and St=0.05.The spatial spectra distribution plotted with f= 12 kHz (St = 0.3) as the specified frequency is shown in Fig.9(c), which shows that the energy in the boundary layer is high. When the specified frequency f= 15 kHz(St = 0.375), the energy in the incoming boundary layer is high, as shown in Fig. 9(d).
The FFT and the SPOD methods are used to fully describe the baseline flow, and the results show that the shock wave motion is characterized by low frequency and broad band(approximately St = 0.01–0.07). The scale and the pulsation of small-scale vortex in the incoming boundary layer is gradually increasing after passing through the separation shock wave.The next part of the paper we will investigate the effect of PSJA forced by different frequencies on SWBLI.The response law of the separation shock wave low-frequency motion to the high-frequency actuation will be observed and analyzed.
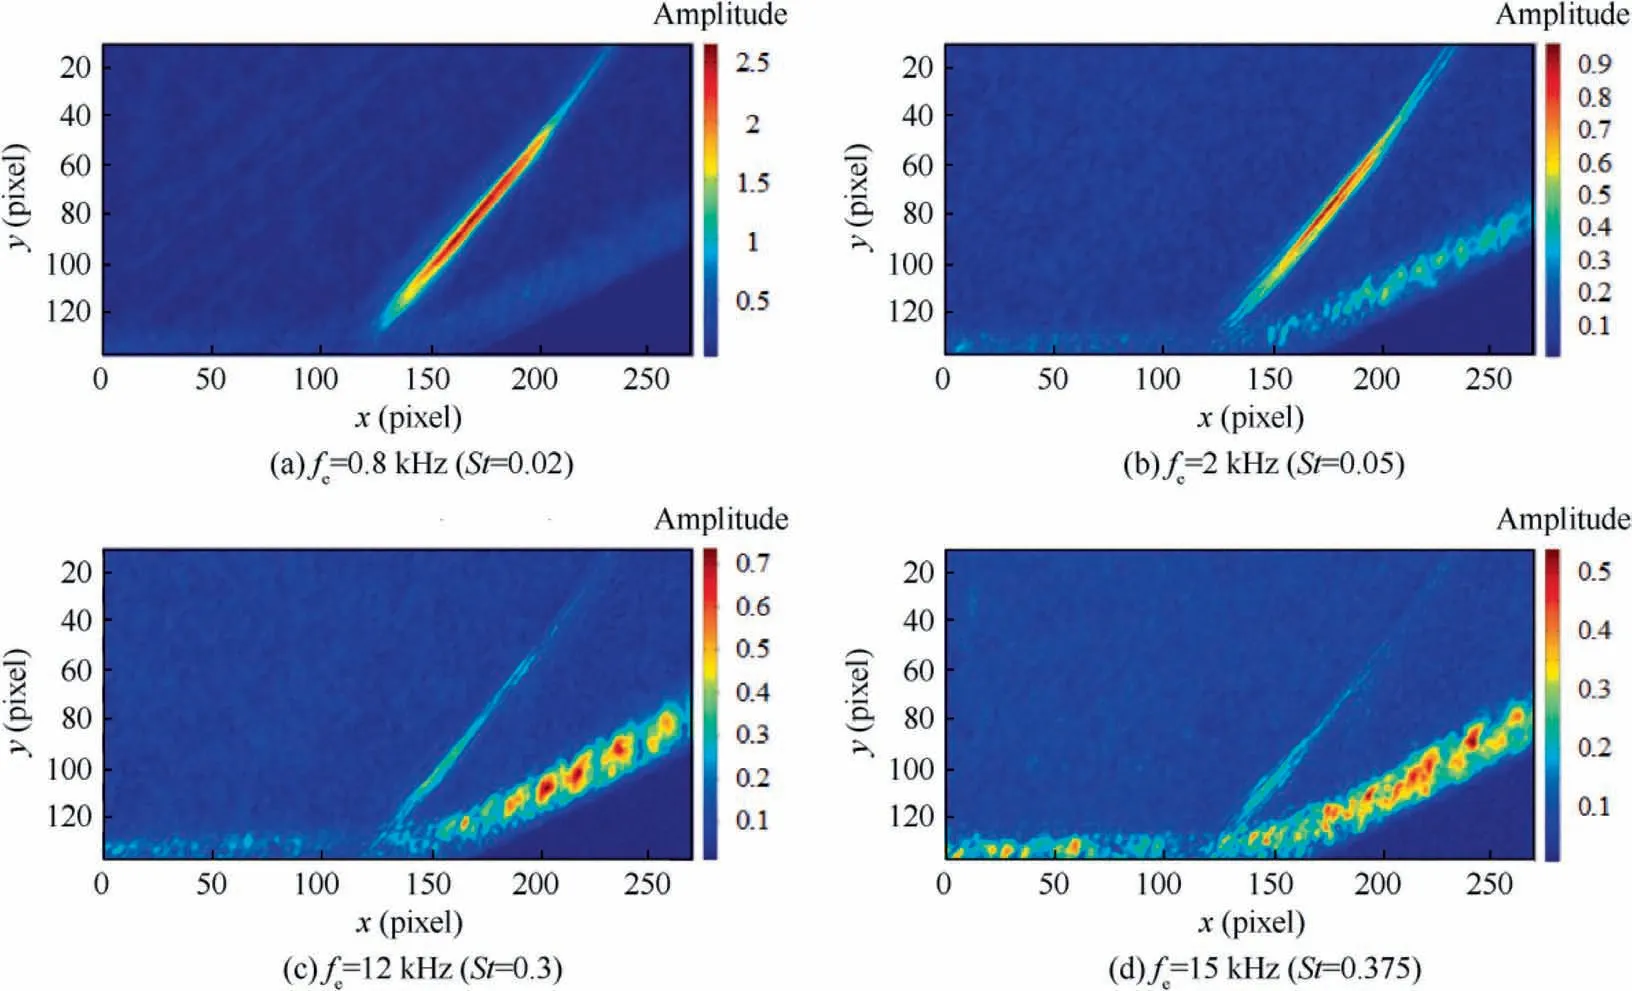
Fig. 9 Spatial spectra distribution of specified frequency.
3.2. Effect of high-frequency PSJA on SWBLI
The experiment adopts the parameterized nanosecond pulse power supply of Xi’an Jiaotong University to drive the PSJA.The discharge voltage is set to be 20 kV to ensure a steady breakdown, and the pulse width of discharge is set to be 1 μs with the rising and the falling edge are both 50 ns.Three experiments with different actuation frequency,namely f=2 kHz,4 kHz, 8 kHz, are conducted. In each experiment, both base flow and modified flow was recorded through synchronization system to facilitate comparation between the flow field with and without plasma actuation.
The voltage and current waveform of spanwise actuator array under 2 kHz actuation was shown in Fig.10(a),the peak voltage is 22.5 kV and the peak discharge current is about 133 A. And the instantaneous power is acquired by multiplication of the voltage and current, as shown in Fig. 10(b). Based on the voltage and current, energy can be calculated as follows:

where u(t)is the instantaneous voltage at time t,and i(t)is the instantaneous current at time t.The peak instantaneous power magnitude is 1200 kW,the discharge energy single pulse is calculated to be 249 mJ.Additionally,the discharge waveform of a single actuator under the same condition was also measured and the discharge energy is about 240 mJ.Therefore,it can be concluded that the actuation array can improve the discharge efficiency. Furthermore, it was found that the increase in frequency can also improve the discharge efficient.With the actuation frequency goes up to f= 8 kHz, the discharge efficient increases by a maximum of 5.1%.
The effect of spanwise PSJA array on SWBLI is first studied through instantaneous schlieren image. As shown in Fig. 11, the precursor shock wave was captured at t = 20 μs,which proved the operation of PSJA array.However,no obvious high-speed jet was observed in schlieren snapshot,indicating that the jet ejected from the cavity did not penetrate the boundary layer.In fact,the jet has already formed and moved with the incoming flow. It is difficult to be captured by schlieren system due to the high flow rate and low force energy. At t = 40 μs, the precursor shock wave reaches the foot of separation shock wave and interacts with it.Then the shock continues to propagate, the large-scale vortex is clearly captured in the reattached boundary layer. The precursor shock wave gradually disappeared at t = 140 μs. In conclusion, although the control effect on shock structure is rather weak, whether the low-frequency unsteadiness is modified is deserved to be further studied.
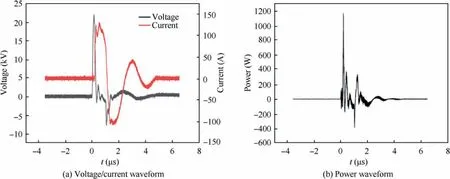
Fig. 10 Discharge waveform.
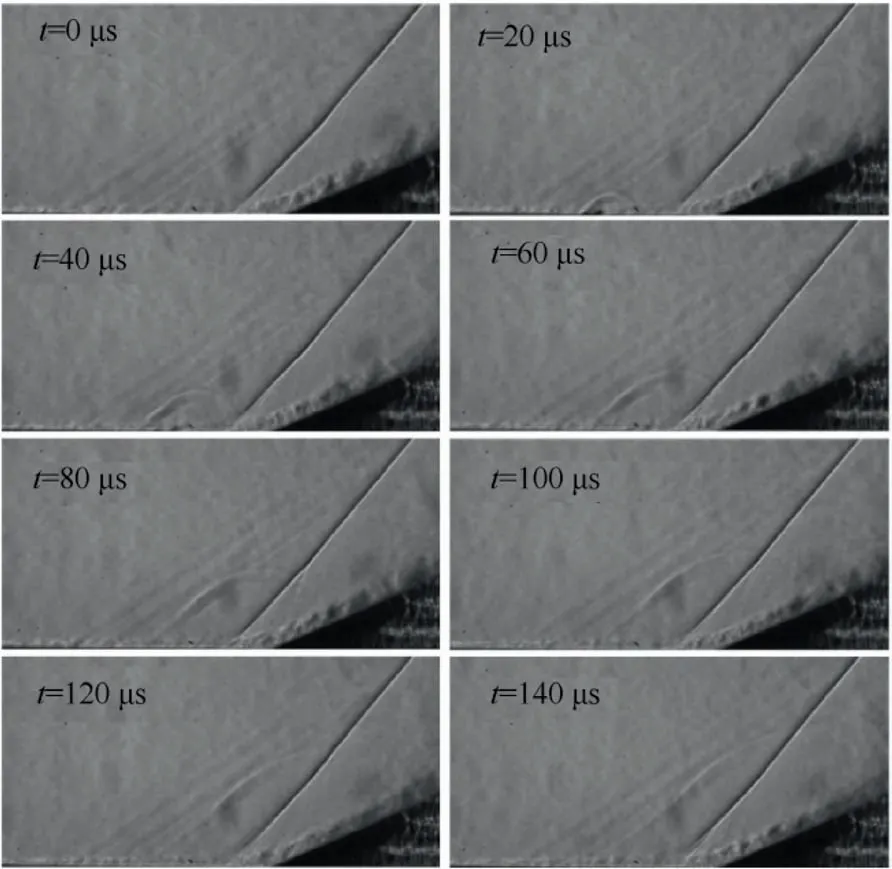
Fig. 11 Flow field schlieren image under 2 kHz actuation.
In order to analyze the low-frequency unsteadiness motion,the FFT technique is used to extract the frequency feature of SWBLI. The spatial distribution images of power spectrum in a specific frequency range (St = 0.01–0.07) are shown in Fig. 12. When the actuation frequency is 2 kHz, the lowfrequency energy near the shock wave decreases, indicating that the 2 kHz actuation suppresses the low-frequency motion of the shock wave.When the actuation frequency is 4 kHz,the energy near the shock wave does not change much, but the low-frequency region shrinks, indicating that the actuation of 4 kHz can reduce the low-frequency motion amplitude of the shock wave. When the actuation frequency is 8 kHz, the low-frequency energy increases significantly, indicating that the high-frequency actuation aggravates the low-frequency motion of the shock wave.

Fig. 12 Spatial distribution of power spectrum with St = 0.01–0.07 as specified frequency range.
The actuation frequency of 2 kHz, 4 kHz and 8 kHz are used as the specified frequency to draw the spatial distribution of power spectrum to further investigate the response characteristic of each structure in the flow field to the actuation, as shown in Fig. 13. When the actuation frequency is 2 kHz(St = 0.05), the energy of the shock wave and the reattached boundary layer corresponding to 2 kHz has increased,indicating that the response of these two locations to the frequency of 2 kHz is relatively obvious. When the actuation frequency is 4 kHz (St = 0.1), the energy near the separation region increases significantly. It can be seen that the flow structure near the separation zone fully responds to the actuation.When the actuation frequency is 8 kHz (St = 0.2), the energy of the shock wave and reattached boundary layer, corresponding to 8 kHz frequency increases slightly. The reattached boundary layer exhibits a large-scale vortex structure under the actuation condition, indicating the vortex structure of the reattached boundary layer will respond to the actuation frequency of 8 kHz. It can be preliminarily presumed from Fig. 13 that the shock wave is easy to respond to the low-frequency actuation(St = 0.05); the boundary layer tends to respond to the highfrequency actuation(St=0.1,0.2).The reason for the separation region responses to the actuation of St=0.1 may be due to the coupling of the actuation frequency of 4 kHz and the pulsation frequency of the separation bubble.

Fig. 13 Spatial distribution of power spectrum at a specified frequency.
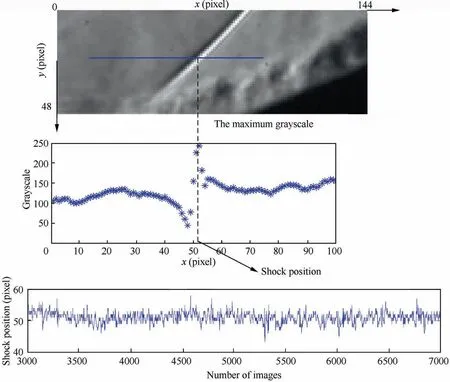
Fig. 14 Schematic diagram of extracting shock wave position time sequence.
With the purpose of analyzing low-frequency motion characteristics of the shock wave,image processing method is used to extract the shock wave position to obtain the trajectory of the shock wave motion.On the horizontal line of y=20 pixel(the x-axis pixel range is 0–100 pixel), the x-axis coordinate corresponding to the point with the largest gray value is extracted as the position of the current shock wave on the xaxis.The 7000 images are processed to achieve the shock wave position time sequence as shown in Fig. 14. The shock wave oscillates along the x-axis direction,and the amplitude is about 1.375 mm.The frequency characteristics of shock wave motion can be obtained by FFT on the extracted shock wave position time sequence. Fig. 15 is the shock wave position frequency spectra at different actuation frequencies. Fig. 15 shows characteristic frequency of Baseline-2k case is St = 0.014, and it turns into St=0.048 after applying actuation of 2 kHz,which is close to the actuation frequency (Actu-2k/St = 0.05). That indicates that the characteristic frequency of shock wave motion after applying actuation gradually approaches to the actuation frequency. The characteristic frequency of Baseline-4k case are St = 0.014 and St = 0.055. The energy of low frequency component (St = 0.014) decreases after applying 4 kHz actuation. Comparison of Baseline-8k and Actu-8k shows that the low-frequency energy of shock motion increases significantly under 8 kHz actuation.
The pulsation characteristic of the separation bubble is investigated to further study the mechanism of obvious response of the vortex structure in the separation region to Actu-4k actuation.The time sequence of gray values at the point C(located in the separation region) in all cases are extracted for spectral analysis(20000 images).The data is divided into 20 blocks for smoothing, the results were shown in Fig. 16. The oscillation energy in the separation zone is high near St=0.1.When the actuation frequency is 4 kHz,the oscillation at point Cis significantly enhanced, and the energy is increased by about 70%.When the actuation frequency is 2 kHz and 8 kHz,the oscillation at point Cis almost invariable. The results indicate that the actuation frequency of 4 kHz is coupled with the characteristic frequency of the separation region.
4. Conclusions
The effect of high-frequency PSJA on the unsteady motion of SWBLI was investigated via high-speed schlieren image system, and FFT and SPOD techniques. Results of three tests with different frequencies were compared and analyzed.
(1) The results indicate that when the actuation frequency is 2 kHz (St = 0.05), the low-frequency unsteady motion of the separation shock wave is suppressed, and the characteristic frequency of the shock wave approaches to the actuation frequency.
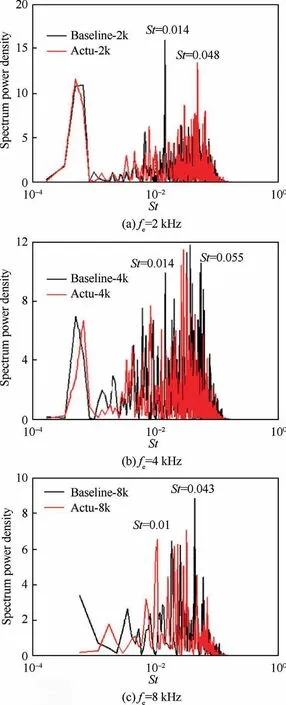
Fig. 15 Shock wave position frequency spectra.
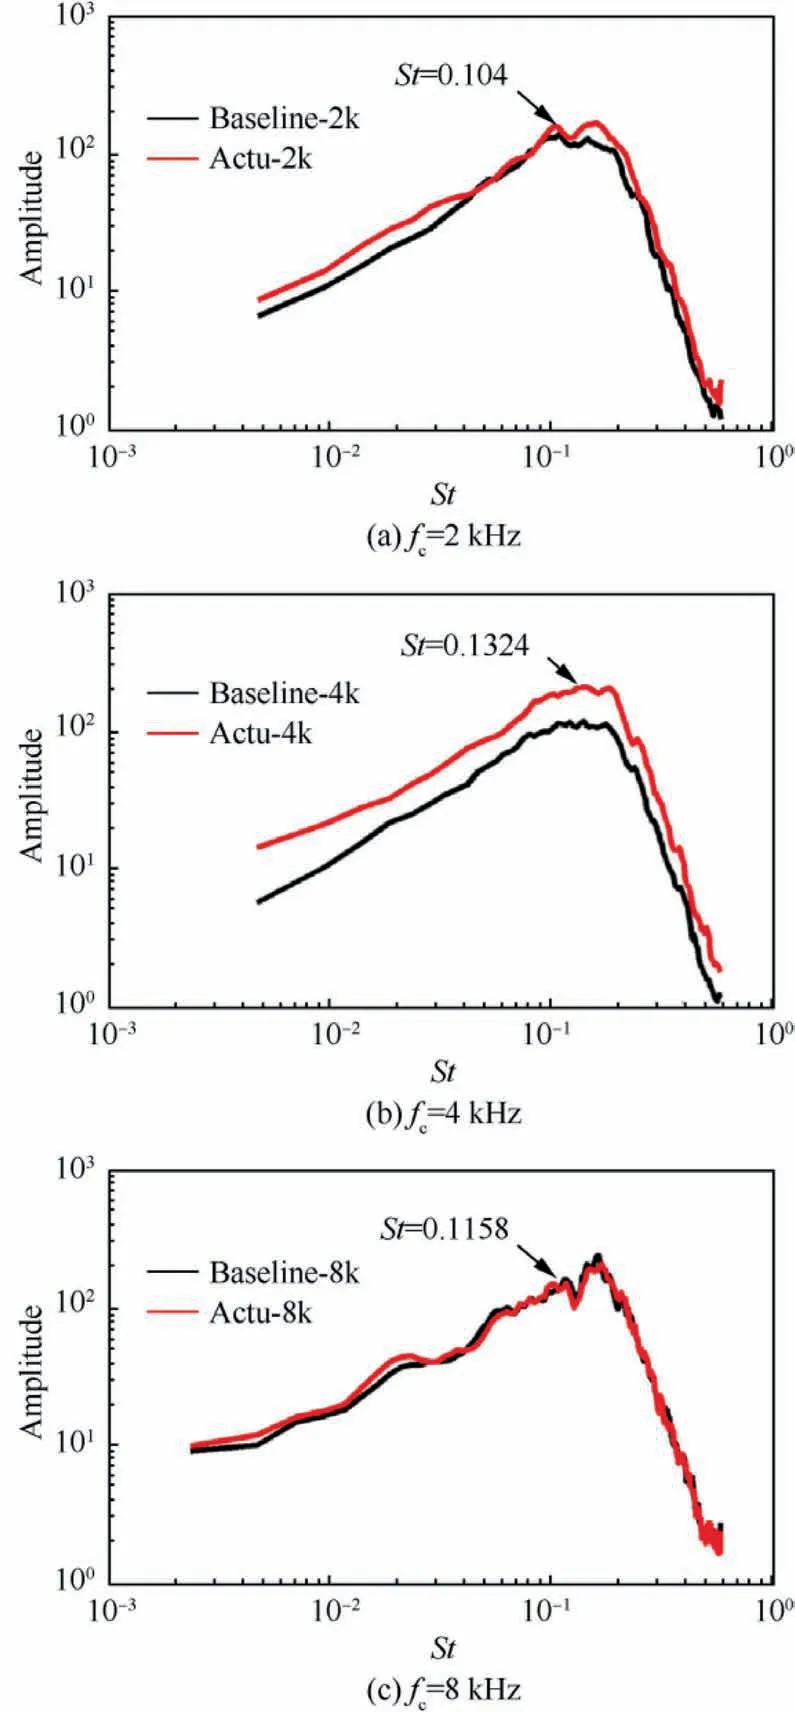
Fig. 16 Frequency spectra at point C2 (located in separation region).
(2) The oscillation of the separation zone responds significantly to 4 kHz (St = 0.1) actuation. The coupling of the actuation frequency of 4 kHz and the vibration frequency of the separation zone enhances the pulsation of the separation zone;the application of 2 kHz and 8 kHz actuation have little effect on the pulsation of the separation zone.
(3) When the actuation frequency is 8 kHz (St = 0.2), the low-frequency motion of the shock wave is enhanced.The FFT results indicate that the low-frequency energy of the shock wave increases significantly and characteristic frequency of low frequency(St=0.01)is generated after applying 8 kHz actuation.
This paper investigates the effect of high-frequency PSJA on SWBLI. Although it has a certain effect, it does not touch the deeper flow essence of SWBLI. Next, we will research the essence of the coupling between the jet and SWBLI from a more microscopic perspective and adopt more sophisticated flow measurement techniques (3D PIV, et al.).
Declaration of Competing Interest
The authors declare that they have no known competing financial interests or personal relationships that could have appeared to influence the work reported in this paper.
Acknowledgements
This paper was supported by the National Key R&D Program of China (No. 2019YFA0405300), the National Natural Science Foundation of China (Nos. 51907205 and 12002363),and the Foundation Strengthening Fund, China (Nos. 2019-077 and 2019-053).
杂志排行

CHINESE JOURNAL OF AERONAUTICS的其它文章
- Optimal trajectory and downlink power control for multi-type UAV aerial base stations
- Effects of flow parameters on thermal performance of an inner-liner anti-icing system with jets impingement heat transfer
- Effects of wing flexibility on aerodynamic performance of an aircraft model
- Aerodynamic performance enhancement of co-flow jet airfoil with simple high-lift device
- Adaptive fuzzy terminal sliding mode control for the free-floating space manipulator with free-swinging joint failure
- Influence of longitudinal-torsional ultrasonicassisted vibration on micro-hole drilling Ti-6Al-4V