Numerical study on fatigue crack propagation behaviors in lubricated rolling contact
2021-10-27HifengHEHuijuLIUCichoZHUAndreMURA
Hifeng HE, Huiju LIU,*, Cicho ZHU, Andre MURA
a State Key Laboratory of Mechanical Transmissions, Chongqing University, Chongqing 400044, China
b Department of Mechanical and Aerospace Engineering, Politecnico di Torino, Torino 10129, Italy
KEYWORDS Fatigue crack propagation;Finite element;Life prediction;Lubricating states;Rolling Contact Fatigue(RCF);Stress Intensity Factors(SIFs)
Abstract The surface-initiated Rolling Contact Fatigue(RCF)including pitting and micro-pitting is one of the key issues affecting the reliability of tribological components such as gears and bearings used in various devices.In this work,a surface-initiated crack Finite Element(FE)model which considers the effect of lubricant on crack faces was developed to investigate surface-initiated RCF using an automatic crack propagating Python script. Different lubricating states, initial crack parameters and loading conditions were simulated to analyze the evolution of crack propagation and the Stress Intensity Factors (SIFs). The RCF crack propagation path and life were predicted by employing the Maximum Tangential Stress(MTS)criterion coupled with the Paris’s law.A typical RCF failure is predicted in the numerical simulation. Results reveal that the lubricating pressurization dominates the surface-initiated RCF. In addition, the initial crack angle has a significant effect on the RCF crack propagation path and the fatigue life.
1. Introduction
Rolling Contact Fatigue(RCF),as one of the dominating factors leading to failures of rotating mechanical components such as gears and bearings, greatly affects the reliability and safety of high-performance machineries including aeroengine, wind turbine, car reducers and railway rails. RCF is mainly dominated by surface or subsurface-initiated cracks.The subsurface-initiated failure,such as gear pitting and tooth internal flank fracture, normally occurs due to material inclusions,poor material hardness and residual stress gradients,etc.The surface-initiated failure type,including micro-pitting as given in Fig. 1,is the result of complicated interactions of loading conditions, surface topography,lubrication,material microstructure and inclusions, etc. Currently, the subsurface-initiated failure is effectively suppressed due to the strict control of material defects and the improvement of casehardening technologies.Therefore,the surface-initiated failure draws more attention as it extremely restricts the fatigue performance of modern mechanical systems.

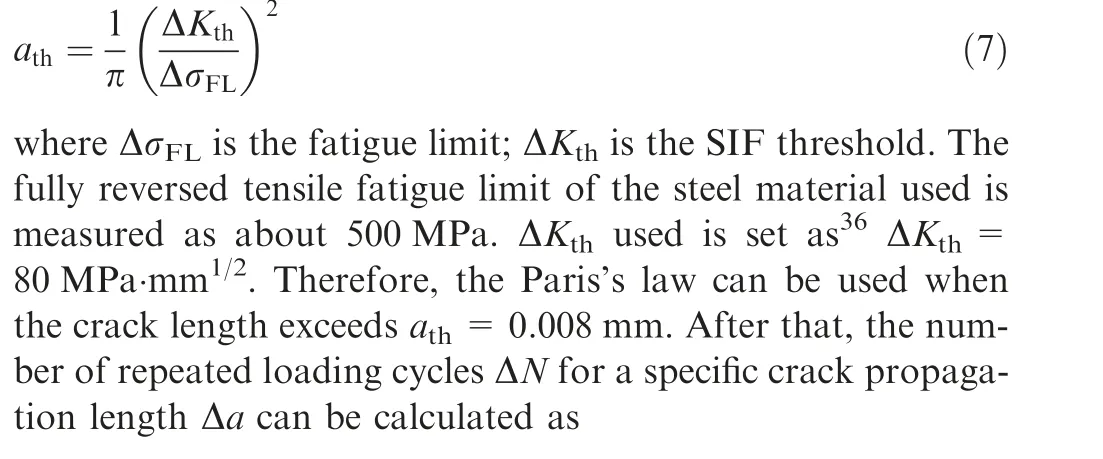
Nomenclature a Crack length, mm a0 Initial crack length, mm ath Threshold crack length, mm b Half contact width, mm da/dN Crack propagation rate, mm/cycle f Frictional coefficient i The i th loading cycle o Crack mouth p(x) Contact pressure, Pa pliq Hydraulic pressure, Pa pmax Maximum contact pressure, Pa q(x) Traction distribution, Pa x, y Axes of the absolute local coordinate system in crack mouth x0, y0 Axes of the local coordinate system in crack tip C, m Material constants, C=4.71×10⁻¹⁴, m=5.42 E Equivalent elastic modulus, E=115.4 GPa K1 Opening mode (Mode Ⅰ) stress intensity factor,MPa·mm1/2 K2 Shear mode (Mode Ⅱ) stress intensity factor,MPa·mm1/2 Kc Fracture toughness, Kc=630 MPa·mm1/2 Keff Effective stress intensity factor, MPa·mm1/2 Np Fatigue crack propagation life θ Crack propagation direction θ0 Initial crack angle between contact surface and crack θ1 First crack propagation in the local coordinate ν Poisson’s ratio of the infinite elastic half-plane,ν=0.3 σ1 Maximum principal stress, MPa Δa Crack propagation increment, mm ΔKeff Amplitude of effective stress intensity factor,MPa·mm1/2 ΔKth Stress intensity factor threshold, ΔKth=80 MPa·mm1/2 ΔN Corresponding repeated loading cycles for Δa ΔσFL Fatigue limit, ΔσFL=500 MPa
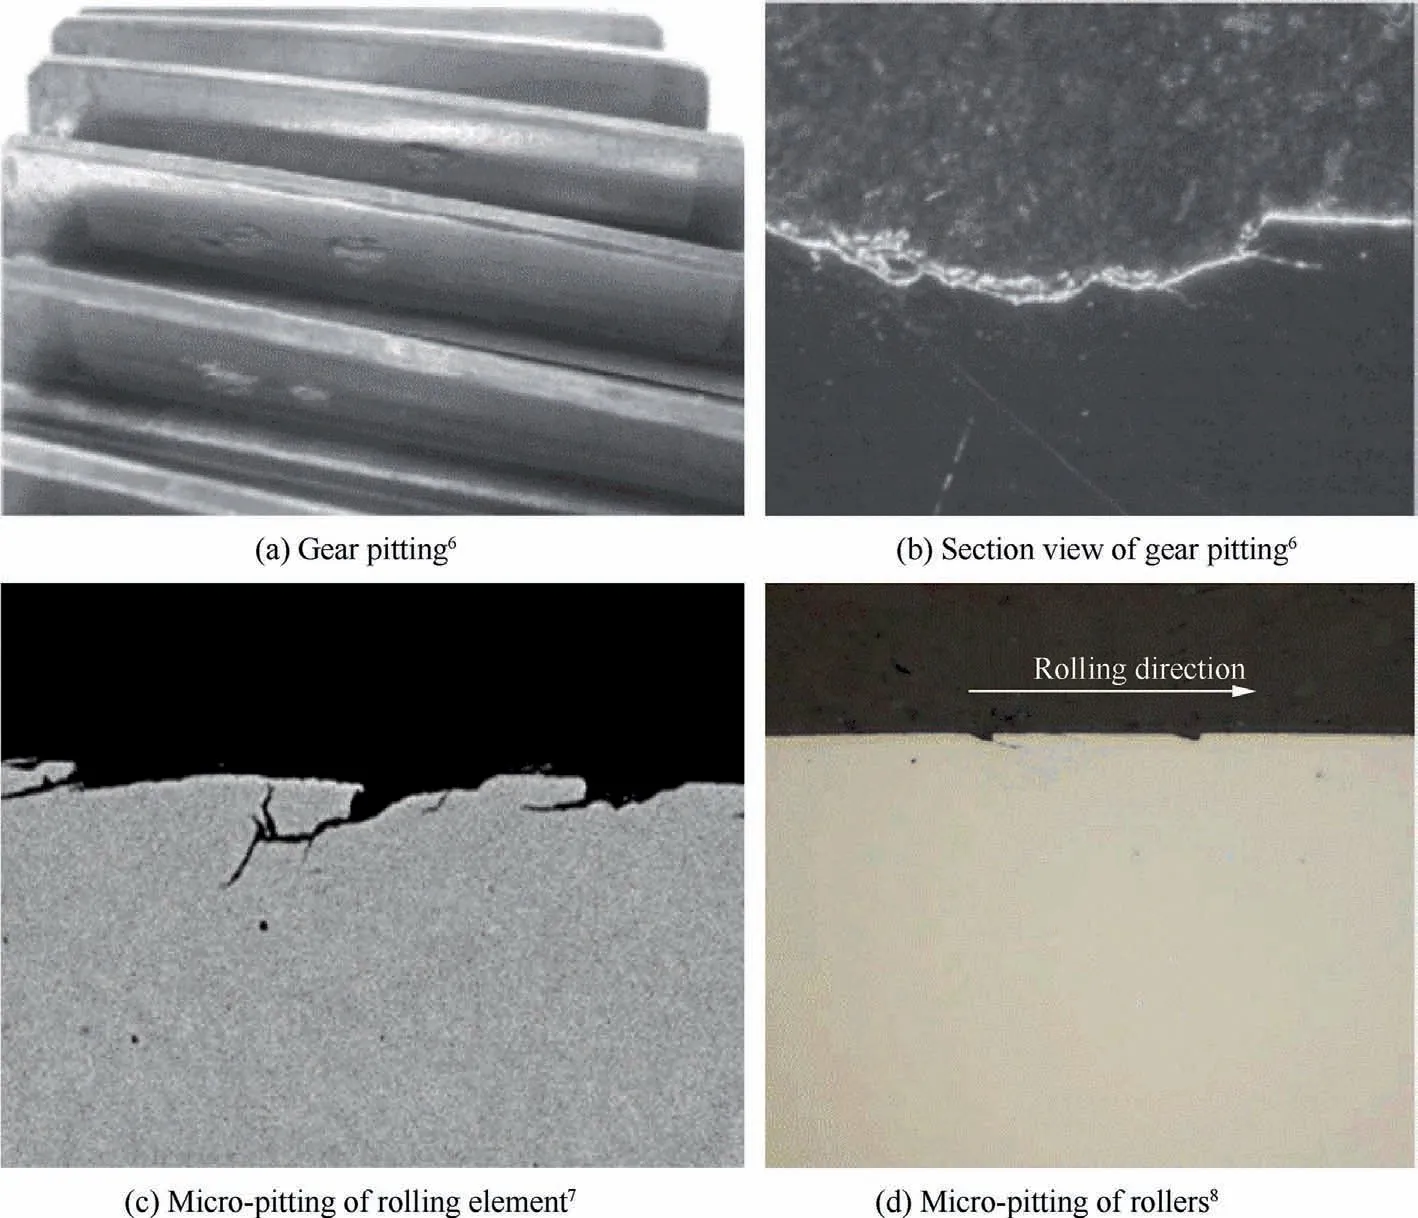
Fig. 1 Pitting, micro-pitting of rolling elements.6–8
Waywas one of the pioneers to study surface-initiated failure for rolling contact through the experimental method.He suggested that the hydraulic pressure has a great influence on the surface crack propagation in lubricated or mixed lubricated rolling contact cases. The penetration of oil into crack surface leads to the opening mode (Mode Ⅰ) rather than the shear mode (Mode Ⅱ). Based on the fracture mechanics, Keer et al.extensively studied the surface and subsurface crack under rolling/sliding conditions in order to predict the crack propagation behavior. Miller et al.focused on the short crack propagation considering the influence of other impacts such as the crack length, shot-peening, hydrogen element,etc. Results showed that shot-peening significantly decreases the short crack growth rate.Then,Bold et al.experimentally and numerically studied the RCF crack propagation for large cracks(with length more than 10 mm),which mainly occurs in rails.Guo et al.summarized some basic criteria to predict the crack propagation direction under mixed-mode condition and pointed out that the Maximum Tangential Stress(MTS)criterion is widely used for opening mode dominated crack. Ren et al.numerically simulated the surface initiated crack propagation path under lubricated contact condition for a rolling gear. However, the fatigue crack propagation life was missed in this model. In 2008, Bogdan´ski and Lewickiexplored the Liquid Entrapment Mechanism(LEM)on a surface breaking crack based on a three-dimensional Finite Element (FE)model. In the LEM frame, the entrapped oil volume was assumed to be constant to calculate the oil hydraulic pressure.Maya-Johnson et al.experientially investigated the crack growth mechanism of rail steels (R370CrHT) under dry and lubricated RCF conditions. The effect of material inclusions on the crack propagation was also explored.Recently,considering both the fluid pressurization and entrapment effects,Ancellotti et al.numerically investigated the lubricated rolling-sliding contact fatigue. They found that the effect of pressurization on the crack propagation shows similar phenomenon with that of the entrapment case for short crack.However,the RCF crack propagation behavior is still not fully recognized due to the complex non-proportional loading history in comparison with the simple tensile loading and the instability of pure shear mode crack propagation.Besides,the fatigue crack growth path and life, as the two important indicators of the RCF crack, are somewhat ignored in most previous work. Therefore, a comprehensive investigation on the fatigue crack growth behavior under lubricated rolling contact case needs to be addressed.
In the current work,a FE model which considers the effect of lubricant on crack faces is used to investigate the surfaceinitiated rolling contact fatigue using an automatic crack propagating Python script. The FE based contact pressure rather than the ideal Hertzian pressure assumption is adopted to obtain more accurate results. The uniform hydraulic pressure coupled with the pressurization mechanismare utilized to investigate the fatigue crack propagation for lubricant contact.The algorithm of interaction integral is adopted to calculate the Stress Intensity Factors (SIFs). The MTS criterion and the Paris’s law are employed to reconstruct the surfaceinitiated crack propagation and predict the fatigue life,respectively. This work provides a new surface-initiated crack propagating algorithm and lays a foundation for a further exploration of more complex RCF crack growth problems.
2. Numerical methodology
2.1. Finite element model
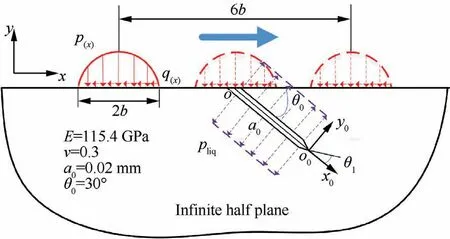
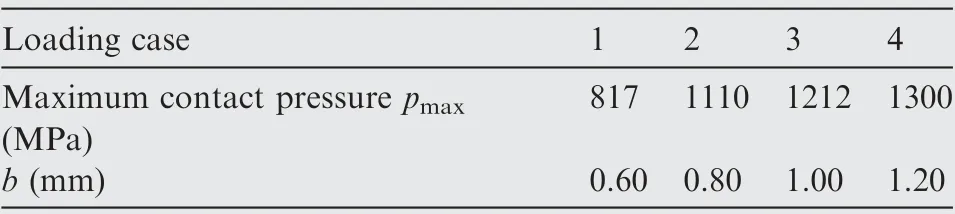
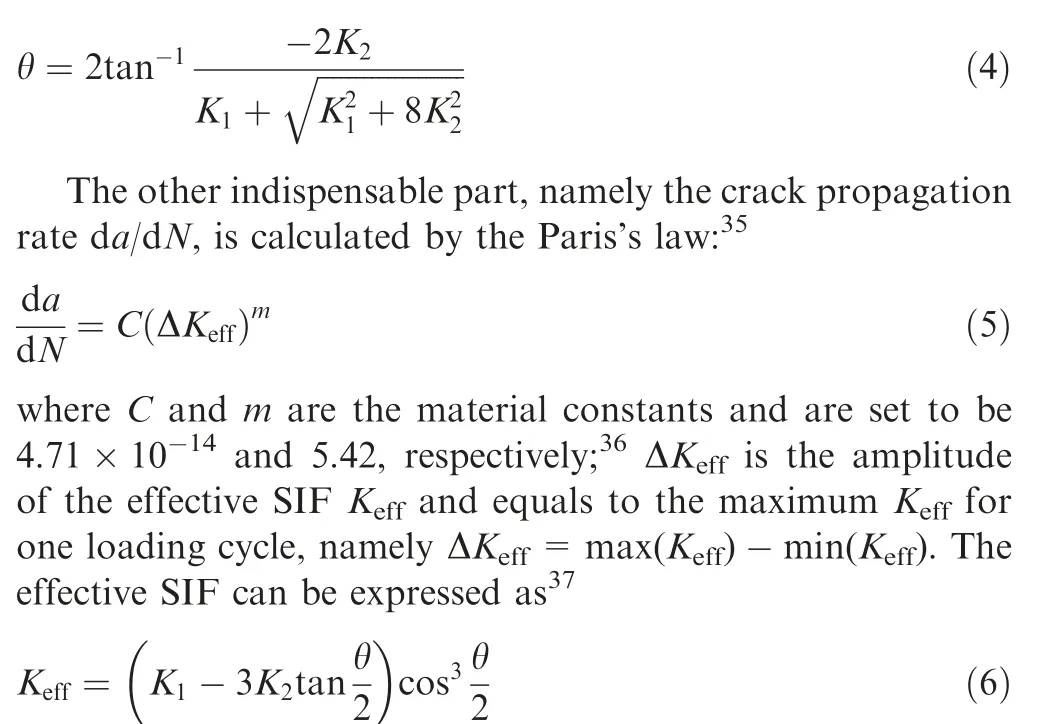
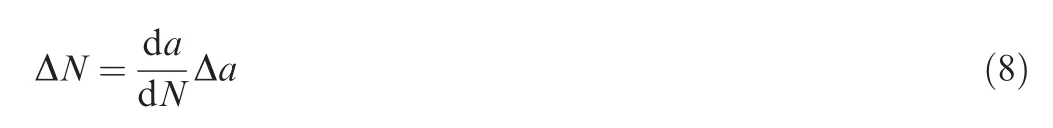
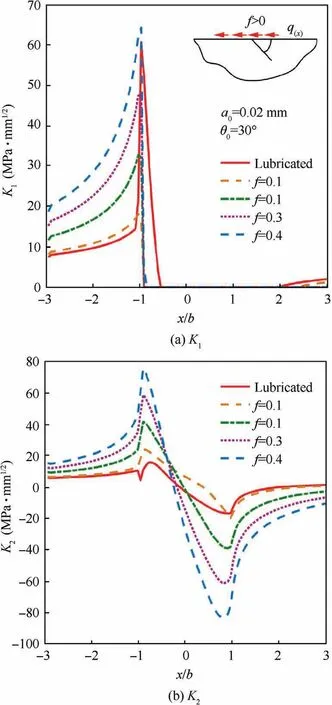
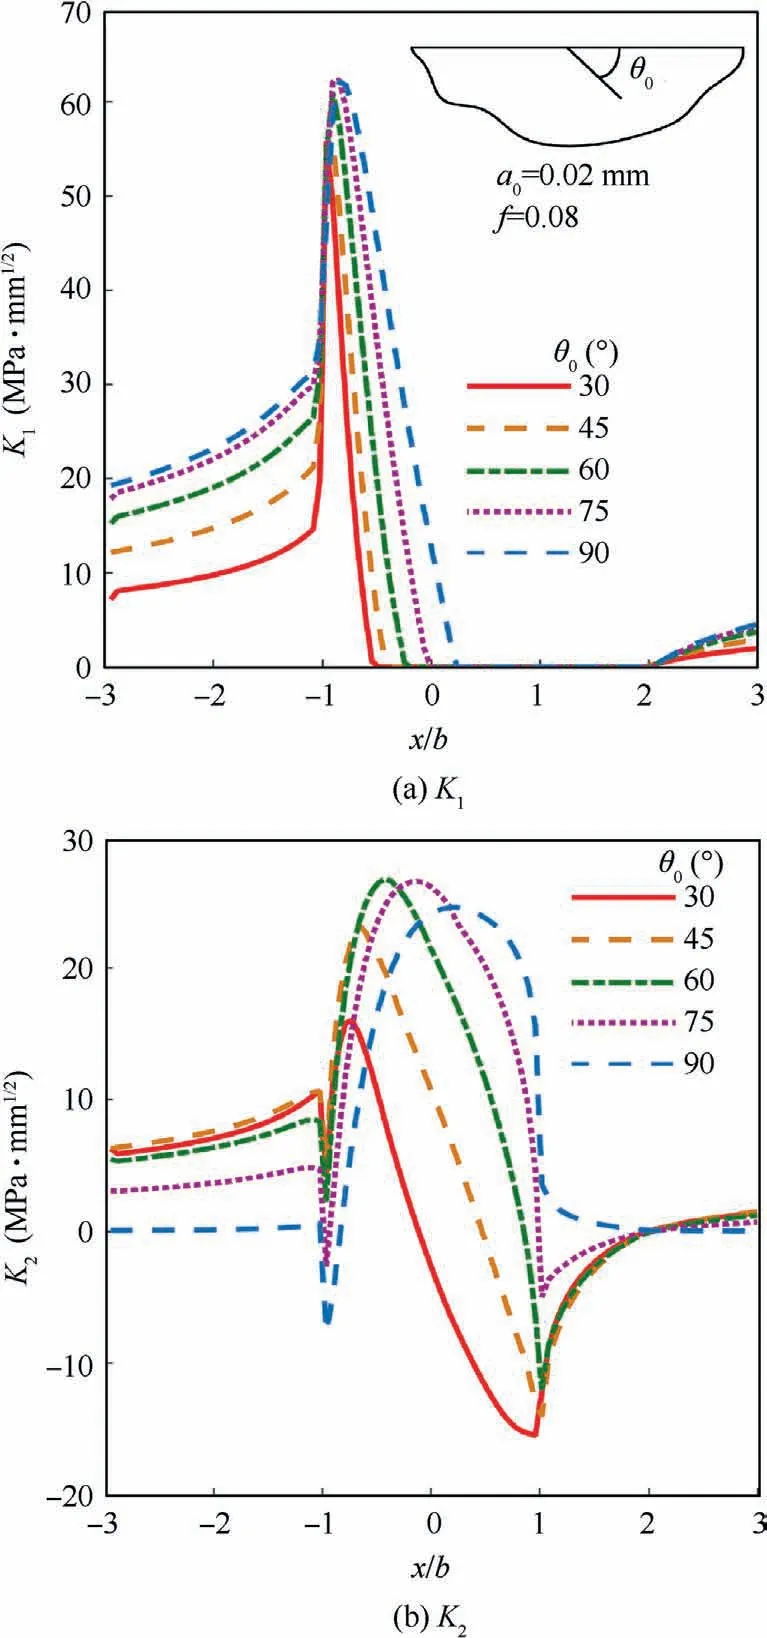
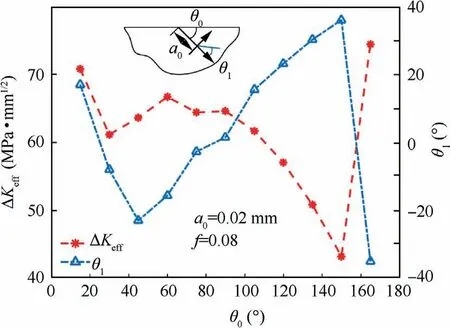
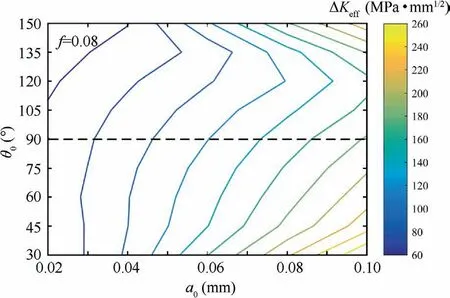
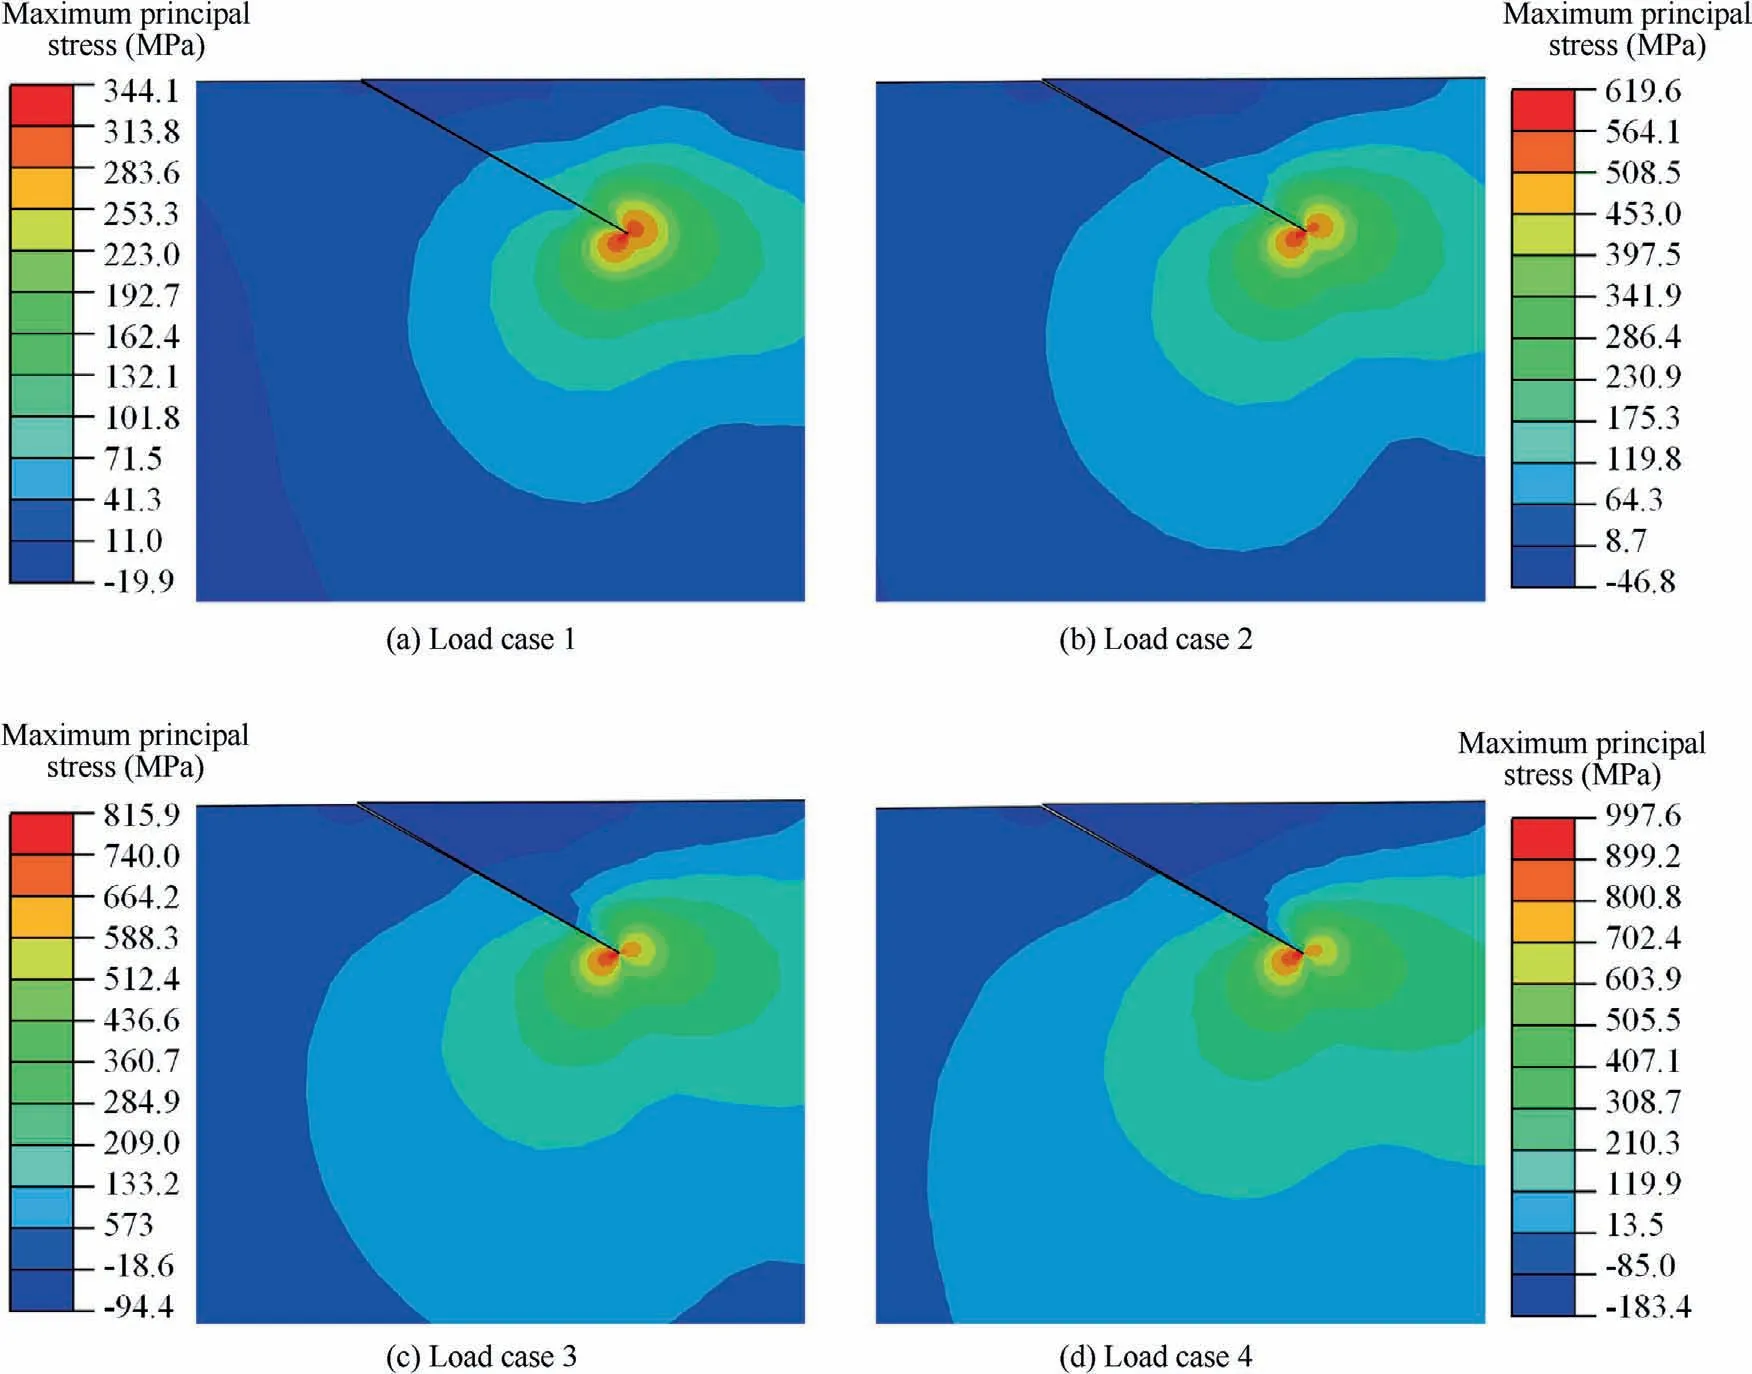
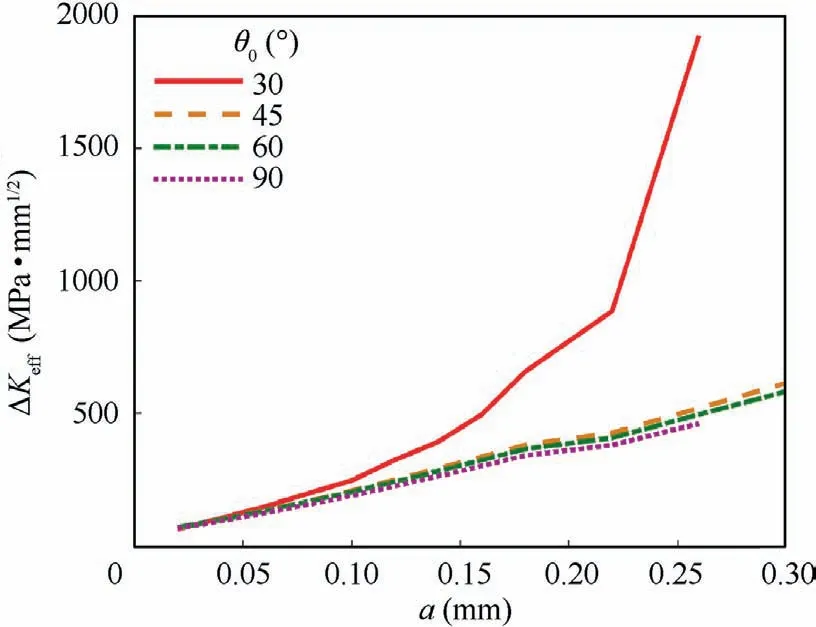
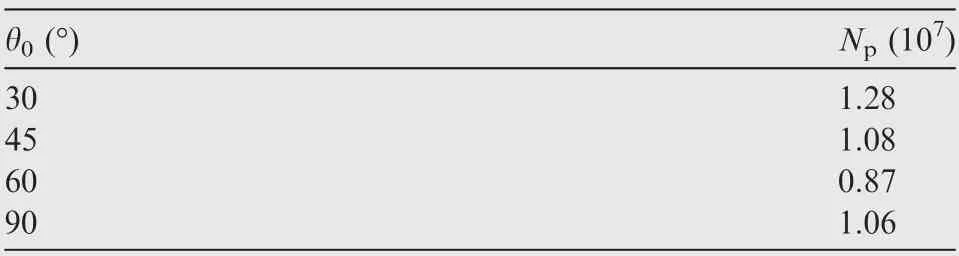
The RCF crack normally occurs in gears, bearings, rails, etc.,under repeated rolling-sliding. A numerical rolling contact model carrying a surface inclined crack is developed to investigate the typical RCF crack growth problem. The commonly used carburized steel material (18CrNiMo7-6) with the elastic modulus 210 GPa and the Poisson’s ratio 0.3 is adopted. A schematic diagram of the surface-initiated crack RCF model is illustrated in Fig. 2. The equivalent elastic modulus and Poisson’s ratio of RCF model (with infinite half plane) are E=115.4 GPa and ν=0.3 based on the Hertzian contact theory. In Fig. 2, a surface-initiated crack (crack length a=0.02 mm) with the inclining angle θis utilized to represent the crack body.x and y are the coordinate axes of the global coordinate system;xand yare the coordinate axes of the local coordinate system in the crack tip, respectively; θis the crack propagation direction;pand b are the contact pressure distribution (from -b The interacting counterpart of the infinite half plane moves from left to right on the surface. Starting from x=-3b, the contact pressure p, passes through the crack mouth and finally moves to the position of x=3b with 100 time-step in the FE simulation.The total rolling distance 6b ensures a complete loading stress history (from the engage-in to the recess point) for the crack to simulate a complete meshing cycle. It is worth noting that the commonly used Hertzian contact pressure is strongly idealistic and deviates from the actual pressure profile, especially for heavy loading conditions. Therefore,four contact pressure loading cases based on the FE calculation, listed in Table 1,are programmed in this work. The effect of surface friction is represented by means of the traction distribution q, which is expressed as where f is the frictional coefficient between two contacting surfaces. prepresents the hydraulic pressure applied on the crack faces, and is assumed to correspond with the contact pressure in the crack lip based on the pressurization mechanics. Therefore, it has Fig.2 Schematic diagram of surface-initiated crack RCF model. Table 1 Maximum pressure and half contact width under different loading cases.31 The fluid may be sealed in the crack and further results in a complex crack fluid pressure distribution, especially for long crack cases.However, considering that the initial crack length is much smaller than the half contact width b, Eq. (2)can be taken as a reasonable simplification of the pressurization mechanism.It should be noted that this is one of the simplest assumptions for crack pressure and may overestimate the actual effect of fluid pressure.In addition,the crack face is closed after the contact pressure passing through the surface crack position. However, considering that the crack growth is dominated by the pressurization mechanism in the loading process,the crack closure effectcaused by the unloading process is neglected. Fig. 3 illustrates the FE model with a initial crack. A finite computational domain 20 mm×10 mm is employed to represent the infinite half plane to decrease the calculation expense while keep the accuracy. A circular region with a radius of 0.008 mm, located in the crack tip, is partitioned for fine element meshing. The mesh size in the circular region and the crack surface is set to be 0.002 mm to ensure convergence.Gradually coarser meshes away from the critical area are generated to reduce the computational cost. The element number for the initial model is 23341.The stress in the crack tip is infinite when the crack is opening and loaded, representing the stress singularity characteristics.Therefore, the singular element type specifying to crack calculation is arranged in the crack tip and the CPE4R element type is set in the remaining area.The FE model is re-meshed after each crack propagation step. Hence, the element number increases slightly for each crack propagation process due to the use of remeshing method. The loading cycle shown in Fig. 3 is applied in the FE model for fatigue simulation. Two vital factors,namely the crack propagation direction and the crack propagation rate, are involved in this solving process. Owing to the effect of the oil hydraulic pressure, which transmits the shear mode dominated crack propagation into the opening mode, the widely used MTS criterion can be utilized to predict the surface-initiated crack propagation direction. Based on this assumption, the crack propagation direction θ is supposed to satisfy where Kand Kare the opening and shear mode SIFs,respectively. The algorithm of interaction integral is adopted to calculate the SIFs. The derivation procedure is given in the Appendix. Then, the expected extending angle can be derived as It should be noted that SIFs vary during one loading cycle,and further results in the change of crack propagation direction according to Eq. (3). Therefore, the time-varying angle θ for one loading cycle is determined based on such a criterion where the crack growth rate reaches to the maximal (da/dN(θ)). It is worth noting that the classical Paris’s law is only valid for long fatigue crack growth where the crack length is longer than the threshold crack length a: Fig. 3 Meshing of simulation model. where Δa is set to be 0.02 mm,equals to the length of the initial crack. Based on the fracture mechanics, the fatigue failure occurs when ΔKreaches a critical value K,namely the fracture toughness. The magnitude of K=630 MPa·mmfor the steel material is used.Finally,the fatigue crack propagation life Nfor gear RCF can be calculated. During simulation, some more loading cycles have been conducted after the predefined fatigue failure to form an obvious crack propagation path.However,these repeated loading cycles have negligibly small effect on the fatigue life according to Eqs.(5)and(8). The numerical scheme for the fatigue crack propagation simulation is depicted in Fig. 4, where superscript i represents the i th loading cycle. The crack coupled FE model is developed based upon the parameters of the material and the crack.The stress and strain responses are captured after the pressure moves from–3b to 3b.SIFs are calculated in the following step based on the interaction integrals,and further,the crack propagation direction and growth rate can be obtained.After that,if ΔKis less than K, an updated crack is formed for next crack propagation. Otherwise, the fatigue crack propagation simulation is finished. The singularity characteristic in the crack tip probably leads to the non-convergence phenomenon of crack tip stress even for an extremely fine mesh case. Therefore, the simulation model is verified through the comparison of the SIFs distributions given in Fig. 5(a) and 5(b) for different local mesh sizes,namely 1, 2, 4 μm, under Load case 2. The horizontal axis(x) represents the distance to the crack lip in the contact surface. The difference of the magnitude of Kdecreases from 5.7% to 2.5% when the local mesh size changes from 4 μm to 2 μm compared with the result of the finest case. This phenomenon presents the convergence of the developed FE model.Hence, the local mesh size of 2 μm coupled with Load case 2 are adopted for the following simulation. The evolutions of opening and shear mode SIFs during one loading cycle are depicted in Fig. 6(a) and (b), respectively.It should be noticed that investigates the effect of the lubricating states not merely the hydraulic pressure on the crack face.That is to say, the variation of friction as the lubrication state changes needs to be considered as well. Therefore, the frictional coefficient f is set to be 0.08representing the lubricated case. The rest different friction coefficients from 0.10 to 0.40 represent the non-lubricated conditions, where the hydraulic pressure is absent. On one hand, it can be observed that both the two SIFs display as positive values before approaching the contact center. Besides, with the increasing of the frictional coefficient f, the magnitude of both SIFs rises. On the other hand, Krises sharply while Kdeclines remarkably for the lubricated case compared with the non-lubricated condition.This is because the hydraulic pressure tends to open the crack faces and further increases the value of K. Fig.7 depicts the amplitude of the effective SIF under these two conditions. It is clear that the change of ΔKalmost linearly corresponds to f for non-lubricated cases.A higher value of f would result in a larger magnitude of ΔK. Nevertheless,the crack opening effect caused by the lubricant pressure rises the possibility of crack propagation.For instance,the value of ΔKfor the lubricated case is twice that of the non-lubricated case with f=0.10. Fig. 4 Algorithm flow chart of fatigue crack propagation simulation. Fig. 8(a) illustrates the evolution of Kduring one loading cycle for different initial crack angles (θ). According to the evolutions of K, a relative larger initial crack degree would keep the crack faces opening for a longer time during a complete loading cycle. Meanwhile, θhas a significant effect on K, as displayed in Fig. 8(b). The maximum of Krises from 16.0 MPa·mmto 26.5 MPa·mmwhen the initial crack direction changes from 30°to 75°.In addition,the corresponding minimum value increases from –15.5 MPa·mmto–5.0 MPa·mm. In other words, the positive part of Kbecomes more important as the initial crack direction increases. Fig.9 shows the amplitude of the effective SIF and the predicted crack propagation direction for different θ. What can be easily seen is that when the angle between the initial crack direction and the surface is very small, such as 15° or 165°,the amplitude of the effective SIF is considerably large compared with other cases. The crack tends to propagate to the surface for such small initial angles according to the predicted crack propagation angle θ.This is because the crack faces are more likely to open for a small initial crack angle and result in the departure of near surface materials due to the effect of hydraulic pressure. However, the value of SIF increases from 61.1 MPa·mmto 66.7 MPa·mmand then decreases to 43.0 MPa·mmwhen the initial crack angle increases from 30° to 150°. The peak value of 66.7 MPa·mmappears with the initial crack angle around 60°. The predicted propagation angle is negative for the range of θ=30°–90° and positive for the range of θ=90°–150°.That is to say,the crack would firstly propagate to the core area beneath the surface for these cases. Fig. 5 Convergence verification of simulation model. Fig. 6 Evolution of two SIF components under different conditions. Fig. 7 Amplitude of effective SIF under different conditions. Evolutions of SIFs for different initial crack lengths under one loading cycle are depicted in Fig. 10. It is obvious to see that the initial crack length ahas a significant effect on the amplitude of SIFs with similar evolution curves. The amplitude of Kdramatically rises from 35 MPa·mmto 270 MPa·mmwhen the initial crack length increases from 0.01 mm to 0.10 mm. The amplitude of Kalso rises from 23.0 MPa·mmto 96.5 MPa·mm. Besides, the position of the peak value of SIFs shifts to the right side as the initial crack length increases. Fig. 8 Evolution of SIF components with different initial crack angles. Fig. 9 Amplitude of effective SIF and predicted crack propagation direction under lubricated conditions for different initial crack angles. Fig. 10 Evolution of SIFs components with different initial crack lengths. A comprehensive effect of the initial crack parameters,including the crack length and the angle, on ΔKis plotted in Fig. 11. High ΔKis arrested when the angle between the initial crack direction and the surface is small. This phenomenon becomes more significant with the increasing of the initial crack length a. In addition, the unsymmetrical characteristic is captured in Fig. 11 even though the presented angles are symmetric about the initial crack direction(θ=90°),namely a vertical crack.This is because entirely different stress histories would emerge in the crack tip for these geometrically symmetric cracks during one complete loading cycle, which further forms different evolutions of SIF components. Fig. 11 Contour plot of ΔKeff for different initial crack parameters, including θ0 and a0. The loading amplitude is an extremely vital factor influencing the RCF behavior.The variation of the normal loading amplitude results in the change of the half contact width b and the maximum contact pressure p.Table 1 gives the corresponding data for different loading cases used. The maximum principal stress (σ), as a key stress parameter to represent the crack opening trend,is illustrated in Fig.12 for different loading cases when the contact pressure reaches x=-b. Despite the singularity characteristic of the stress response in the crack tip, the stress maps have a similar shape for all loading cases. Besides, the stress around the crack tip rises as the loading amplitude increases. In other words, the crack propagates more easily for a higher loading amplitude. It is clear from Fig.13 that the amplitudes for both Kand Krise sharply as the load increases. This is because the stress fields near the crack tip encounter a considerable growth for a heavy load condition. Besides, it is interesting to find that the positions of the maximum and minimum values for Kand Kduring one loading cycle are keeping away from the contact center as the load increases. This phenomenon is caused by the change of the half contact width. In practical, the extreme values always occur near the positions where the contact area approaches or leaves the crack mouth. Fig. 12 Maximum principal stress for different load cases when contact pressure reaches x=-b and initial angle θ0=30°. The effects of initial crack angle, length and normal loading amplitude have been investigated in Sections 3.2 and 3.3. Section 3.4 focuses on the prediction of the crack propagation path and life. Several initial crack angles (30°, 45°, 60° and 90°) with the same initial crack length 0.02 mm and load condition (Load case 2) are chosen to investigate the crack propagation.The crack increment has great effect on the predicted crack path and life. Hence, the crack propagation increment for the first ten loading cycles is set to be a sufficiently small value of 0.02 mm and extends to 0.04 mm after the 10th loading cycle to save the time expense. Fig. 13 Evolutions of SIFs components under lubricated conditions with different loading amplitudes. Fig. 14 Stress maps of σ1 for different crack propagation states when contact pressure reaches x=-b under initial angle θ0=30°. Fig. 14 depicts the stress maps of σfor different crack propagation states when the contact pressure reaches x=-b under the initial angle θ=30°. It is obvious that the maximum value of σincreases sharply with the growth of crack length a. The tremendous growth of σindicates that the crack would propagate much more easily with the increasing of crack length. It is worth noting that the stress response can only show the crack opening tread duo to the singular characteristic rather than the real stress response during crack propagation. Fig.15 illustrates the evolutions of the effective SIF amplitude with the increase of crack length for different initial crack angles. For the initial crack angle θ=30° case, ΔKgrows slowly for crack lengths within 0.20 mm while rises dramatically afterwards.In contrast,ΔKin other cases increase very slowly. That is to say, when ΔKis to be determined, the branched crack can be approximatively replaced by a straight crack for short cracks. It is worth noting that when ΔKexceeds the fracture toughness,the Paris’s law is not applicable as the rate of crack advance tends towards infinity and the crack will propagate instantaneously. However, it has a negligibly small effect on the fatigue life. Evolution of the propagation rates with the increase of crack length is depicted in Fig.16.The crack growth rate generally rises with the crack length for all cases,which has a similar tread with the experimental results published in Ref. 42.Furthermore, according to Eq. (5), the growth rate is strongly affected by ΔK. Hence, it is reasonable that the growth rate becomes larger for the initial crack angle θ=30° compared with the rest cases under the same crack length. Fig.17 depicts fatigue crack propagation paths for different initial crack angles and reveals that the initial crack angle affects the RCF fatigue crack growth path to a large extent.Cracks propagate to the core for all cases in the first several propagation steps. While, for the case of θ=30°, the crack begins to grow to the surface after reaching the deepest position around 0.072 mm, and finally forms a typical surfaceinitiated RCF failure. The RCF fatigue crack propagation lives (N) for these four cases are listed in Table 2. Similar with the crack growth rate, the initial crack angle θsignificantly affects the fatigue crack propagation life. For example, Nchanges from 1.28×10to 0.87×10, with a 32% drop, when the initial crack angle rises from 30° to 60°. This phenomenon can be explained through Eq. (4) and Fig. 9. The fatigue crack propagation rate is strongly affected by ΔK.Even a slight increase of ΔKwould sharply increase the propagation rate,and further reduce the fatigue life.Besides,the first several crack propagation steps dominate the fatigue life. Hence, according to Fig.9,the predicted RCF crack propagation lives are rational.It is worth noting that the fatigue life is calculated based on the da/dN(θ)criteria.The simulation result requires verification through future experimental studies. In engineering practice,the initial crack could have some complex shapes such as c-shape crackand semi-elliptical crack.An idealized initial crack (straight crack)is utilized for crack propagation prediction. The difference of crack shapes would influence the SIFs calculation, and further affect the crack propagation for long crack. However, the initial crack length used currently is small enough to minimize the influence of crack shape. In addition, a straight crack is convenient for obtaining a general evolution of crack propagation. Fig. 15 Evolution of effective SIF amplitude with increase of crack length. Fig. 16 Evolution of propagation rates with increase of crack length. Fig.17 RCF fatigue crack propagation paths for different initial crack angles. Table 2 RCF fatigue crack propagation lives for different initial crack angles. Both the surface traction and the hydraulic pressure are taken into consideration when the effect of lubricating state is investigated in Fig.6.This is because during the engineering practice, the existence of lubricant would reduce the surface friction and form the hydraulic pressure on the crack face.Therefore, it is necessary to consider these two factors rather than the hydraulic pressure only. In addition, the fact that Kdecreases for the lubricated condition in Fig.6 is valid only for the case that the initial crack length is much smaller than the half contact width. This is because the lubrication decreases the friction coefficient between crack faces, and further enhances the shear mode crack growth when the crack length approaches to the contact width. Therefore, the proposed methodology does not take this effect into account. In Fig.8(a),what is interesting is the phenomenon that the maximum Kfor all cases occurs near the position of x=-b.This is because the invasion of lubricant results in the hydraulic pressure on the crack faces,which further dramatically rises the value of the opening mode SIF when the contact pressure firstly reaches the crack lip at x=-b. However, the crack faces changes to closed because the crack length is much less than the half contact width after that position, leading to the aforementioned phenomenon. The phenomenon that the peak value of ΔKfor θ=30°–150°emerges around in 60°is worth discussing.In reality,this may be the combining result of the hydraulic pressure,the contact pressure and the friction force. The contact pressure would weaken the influence of the hydraulic pressure on the crack face when the vector directions of these two pressure parameters are gradually approaching to each other. Therefore, the peak value of Kdoes not occur for small angles,for example, θ=30° and θ=150°. Besides, the friction force changes the amplitude of Kfor different θ.Hence,coupled with the value of K, this interesting phenomenon is finally observed. In Fig.16,the difference between θ=30°and other cases become more significant with the increasing of the crack length. This phenomenon can be explained through Fig. 18.As the crack growths,shown in Fig.18(a)and(c),the loading area for the hydraulic pressure increases,which further arising the impact of the hydraulic pressure on the crack face considering that the contact pressure keeps constant. Besides, for a smaller initial crack angle,the crack tends to open easier compared with Fig.18(b)and(d).This combined effect results in a larger ΔKfor a small initial angle. In addition, once ΔKexceeds the fracture toughness, the fatigue crack propagation failure occurs, and ΔKwould encounter dramatic increase for the following loading cycles. The developed numerical model is verified based on the meshing size check without the comparison with experimental results. Therefore, a robust experimental verification of the current model is recommended. Another important issue is that the crack size considered in this work is with the micron scale, which has the same magnitude with the material microstructure grain sizeand surface roughness.Therefore,the homogeneous material and smooth surface assumption may be limitation when predicting the short crack propagation for RCF problems. A numerical model considering the effect of material microstructure and surface roughness would be more preferred. (1) Under the lubricated condition, the hydraulic pressure on crack faces caused by lubrication would sharply increase the opening mode stress intensity factor.Meanwhile, the lubrication between contacting surface decreases the frictional coefficient and further results in the decreasing of the shear mode SIF for short crack. (2) The initial surface-initiated crack angle has a significant effect on the RCF crack propagation path.With a small initial crack angle, the crack grows to the core in the beginning,and then propagates towards the surface till a typical RCF spalling failure is formed. The crack may propagate deeper with a larger initial crack angle. Fig. 18 Loading state for different crack lengths and different initial crack angles. (3) The fatigue life mainly depends on the early propagation period. Besides, the initial crack angle has a significant effect on RCF crack propagation life. The RCF crack propagation life decreases 32% as the initial angle increases. Declaration of Competing Interest The authors declare that they have no known competing financial interests or personal relationships that could have appeared to influence the work reported in this paper. Acknowledgement This work was supported by the National Key R&D Program of China (No. 2018YFB2001300). Appendix A.

2.2. Determination of crack propagation


3. Results and analyses
3.1. Effect of lubricating states

3.2. Effect of initial crack parameters


3.3. Effect of loading condition
3.4. Prediction of RCF crack propagation path and life


4. Discussion


5. Conclusions


杂志排行

CHINESE JOURNAL OF AERONAUTICS的其它文章
- Optimal trajectory and downlink power control for multi-type UAV aerial base stations
- Effects of flow parameters on thermal performance of an inner-liner anti-icing system with jets impingement heat transfer
- Effects of wing flexibility on aerodynamic performance of an aircraft model
- Aerodynamic performance enhancement of co-flow jet airfoil with simple high-lift device
- Adaptive fuzzy terminal sliding mode control for the free-floating space manipulator with free-swinging joint failure
- Influence of longitudinal-torsional ultrasonicassisted vibration on micro-hole drilling Ti-6Al-4V