Food safety inspection and the adoption of traceability in aquatic wholesale markets:A game-theoretic model and empirical evidence
2021-10-22JINCangyuRetsefLEVILIANGQiaoNicholasRENEGARZHOUJiehong
JIN Cang-yu,Retsef LEVI,LIANG Qiao,Nicholas RENEGAR,ZHOU Jie-hong
1 China Academy for Rural Development,School of Public Affairs,Zhejiang University,Hangzhou 310058,P.R.China
2 Sloan School of Management,Massachusetts Institute of Technology,Cambridge,MA 02139,USA
3 Operations Research Center,Massachusetts Institute of Technology,Cambridge,MA 02139,USA
Abstract Supply chain traceability is key to reduce food safety risks,since it allows problems to be traced to their sources.Moreover,it allows regulatory agencies to understand where risk is introduced into the supply chain,and offers a major disincentive for upstream agricultural businesses engaging in economically motivated adulteration. This paper focuses on the aquatic supply chain in China,and seeks to understand the adoption of traceability both through an analytical model,and empirical analysis based on data collected through an extensive (largest ever) field survey of Chinese aquatic wholesale markets. The field survey includes 76 managers and 753 vendors,covering all aquatic wholesale markets in Zhejiang and Hunan provinces. The analytical and empirical results suggest that the adoption of traceability among wholesale market vendors is significantly associated with inspection intensity,their individual history of food safety problems,and their risk awareness. The effect of inspection intensity on traceability adoption is stronger in markets which are privately owned than in markets with state/collective ownership. The analysis offers insights into the current state of traceability in China. More importantly,it suggests several hypothesized factors that might affect the adoption of traceability and could be leveraged by regulatory organizations to improve it.
Keywords:food safety,traceability,supply chain,wholesale markets,China
1.Introduction
Food safety and adulteration are global problems with a large impact on human health. Managing food safety risks,such as foodborne illness outbreaks,as well as intentional and economically motivated adulteration (EMA) of food products is particularly challenging because of the size,complexity and opaqueness of food supply chains. Food safety problems have been highlighted in a number of serious and deadly incidents affecting countries worldwide. Examples include the 2003 outbreak of Bovine Spongiform Encephalopathy (or Mad Cow Disease) affecting beef in Europe and USA,and the 2008 melamine incident,which caused multiple deaths and more than 50 000 babies to be hospitalized with serious injuries,because of the intentional contamination of baby milk formula with melamine in China. It is estimated by the U.S.Food and Drug Administration that foodborne illnesses result in 420 000 deaths annually worldwide,125 000 of which are children under the age of 5,and as a result food safety has been recognized as a key problem that needs to be solved cooperatively by governments all over the world (Yiannas 2019).
Supply chain traceability is defined as the ability to conduct full backward and forward tracking of the product to determine the specific locations and life history in the supply chain,up to the farm level,by means of records (Opara 2003). Moreover,it is considered as a core enabler of food safety (Umal-Deininger and Sur 2007). In particular,traceability enables a higher level of food safety in several direct ways. First,a higher level of traceability enables food safety problems to quickly be traced to the source. This allows regulatory organizations and businesses to address the root cause of illness outbreaks or adulteration more rapidly,and informs relevant parties that they need to modify current practices to eliminate or lower the risk of such incidents in the future. Second,it creates a higher level of accountability in the case of economically motivated adulteration,where entities in the supply chain are intentionally introducing adulteration for economic reasons such as yield or perceived quality (e.g.,the melamine incident). Traceability creates a direct disincentive for these actions,because problems can now be traced back to the entities introducing the adulteration,and they have a higher chance of being criminally punished or fined for their actions.
The need for increased traceability is especially true for China,because of its disaggregated and complex agricultural supply chain (Dinget al.2015;Yuet al.2018).However,despite the importance of traceability,there has been relatively little research done to understand the current state of supply chain traceability in China,or to understand how the adoption of traceability might be influenced (See details regarding the supply chain in China and a literature review related to traceability in Section 2). This paper seeks to address this gap,through analytical game-theoretic modeling,that is complemented by empirical analysis based on an extensive field survey of vendors and managers from 76 aquatic wholesale markets in Zhejiang and Hunan provinces. The results suggest that vendors’ adoption of traceability in the aquatic supply chain in China is significantly associated with inspection intensity,their individual history of food safety problems,and their risk awareness,assessed through measuring their involvement in aquatic products associations and social media groups. The analysis in the paper offers insights into the current state of traceability in China,as well as hypotheses for how the adoption of traceability can be improved.
This work contributes to the literature in several important ways. Methodologically,the paper puts forward an analytical game-theoretic model that captures vendors’ utility maximizing decisions to invest in creating supply chain traceability. Motivated by the analytical model,the paper provides one of the first empirical studies of traceability in the upstream parts of agriculture and food supply chains. While most current studies examine the role or the benefits of traceability,factors associated with the adoption of traceability in agri-food supply chain is rarely analyzed. In particular,the analysis highlights the associations between vendors’ adoption of traceability practices and inspection intensity,the vendor’s individual history of food safety problems,and his/her respective risk awareness,none of which have been empirically studied,to the best of our knowledge. To accomplish this,the paper also produces one of the first measures to assess the level of traceability in the Chinese agri-food supply chain in general:the prevalence of usage of the Edible Agricultural Products (EAP) Certificate among wholesale market vendors. Because of the centrality of wholesale markets in the Chinese agri-food supply chain (See Section 2),this measure allows for a broad assessment of the overall level of traceability in China,while still being tractable to assess.
The analysis in this paper is based on a unique data set,constructed from a comprehensive field survey at aquatic products wholesale markets in Zhejiang and Hunan provinces (two of the highest production provinces for aquatic products) (Fisheries Bureau of Ministry of Agriculture of Chinaet al.2018). Two structured survey questionnaires were designed,for face-to-face interviews with both managers and vendors in these markets. The data set includes comprehensive surveys of managers for all 76 wholesale markets specializing in aquatic products,as well as surveys for 753 aquatic product vendors in these markets,including at least 10% of vendors in each market. To the best of our knowledge,this represents the largest field survey of wholesale markets ever conducted in China,both in breadth (the number of managers and vendors surveyed),as well as depth (of the questions asked in the surveys).
The rest of the paper is organized as follows. Section 2 provides background on the Chinese agricultural supply chain and regulatory system,traceability practices in China,and related research. In Section 3,an analytical model is presented to offer hypotheses for the associations between inspection intensity and vendors’ adoption of traceability. Section 4 introduces the data used for the empirical analysis,including the survey design and methodology. Section 5 presents the empirical analysis of associations between the adoption of traceability with inspection intensity,an individual history of food safety problems,and risk awareness. Finally,Section 6 concludes and discusses potential policy implications.
2.Background and related research
This section provides background relevant for the paper,including an overview of the Chinese agricultural supply chain and regulatory oversight,a discussion of the history and current state of traceability for agricultural products in China,and a review of related research.
2.1.The Chinese agricultural supply chain and regu latory oversight
The agricultural supply chain in China is extremely complex and disaggregated. This is at least in part because China has 200 million farms,mostly small and family operated (Lowderet al.2016). The agricultural supply chain in China also has many layers,with less vertical integration and often having multiple entities acting as middle-men before food reaches the consumer. Fig.1 provides an overview of the agricultural supply chain in China.
There are two important facts to note from Fig.1,to provide context to this paper. The first is the existence of large wholesale markets. These are uncommon in developed countries,where the supply chains are more vertically integrated. Wholesale markets specialize in a relatively small number of product types,and serve as major consolidation points of the agricultural supply chain,aggregating about 70-80% of the total market supply through a relatively small number of markets (Ren and An 2010). Wholesale markets are especially central for aquatic products,where supply chains consist of a huge number of small aquaculture farms. For example,in Zhejiang and Hunan provinces,which have a combined population of 125 million people,there are just 76 wholesale markets that sell aquatic products. The second fact to note from Fig.1 is that aquatic products can pass through as many as four supply chain entities,before reaching the consumer. This means traceability is very challenging and particularly important. In fact,many of the government regulatory tests of aquatic products take place in downstream locations such as retail stores,while much of the adulteration risk can be attributed to further upstream locations such as farms,underscoring the importance of supply chain traceability (Jinet al.2021).As a result of these two points,the adoption of traceability among wholesale market vendors is therefore of special importance,to ensure accountability and enable effective regulatory enforcement.
As shown in Fig.1,the food safety regulatory testing of agricultural products is split among multiple agencies,each focused on different parts of supply chain. The Ministry of Agriculture and Rural Affairs (MARA) and the State Administration for Market Regulation (SAMR) are responsible for the inspections of agricultural products in the farming and circulation parts of the supply chain,respectively.
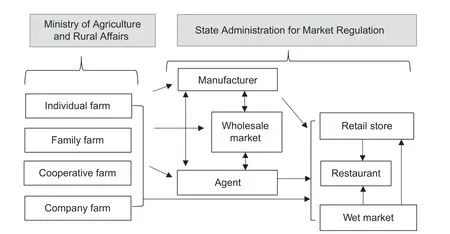
Fig.1 Agricultural products supply chain and main regulatory agencies in China.
In addition to government testing,the wholesale market managers conduct regular self-testing in their markets.1This understanding of wholesale market self-testing was developed during the field surveys in wholesale markets,which included a variety of questions to managers related to their self-testing,and multiple visits to self-testing labs in these markets.This self-testing relies on rapid test kits each dedicated to a single adulterant,as opposed to the quantitative mass spectrometry testing across multiple adulterants that the government uses,and is less likely to identify adulteration as a result. These self-tests also pose a smaller shortterm economic risk to vendors in the event of a failed test,as the respective vendors can choose to forfeit their products without facing an additional fine or criminal penalty,but may offer a larger long-term economic risk as the vendor might be asked by management to leave the market. However,because government tests in wholesale markets are very infrequent relative to market self-testing,and because vendors often do not know which party is taking a sample for testing,in the survey and empirical analysis we combined both types of tests into a single variable.
2.2.Adoption of supply chain traceability
Beginning in 2001 when China joined the World Trade Organization,in order to meet the quality and safety standards for food trade,China began to investigate creating a food safety traceability system. In 2008,the Ministry of Agriculture and Rural Affairs (formerly the Ministry of Agriculture) tried to promote a traceability system for agricultural products throughout the entire supply chain,known as the origin certificate. However,this traceability system did not succeed in gaining traction.2The government tried to promote the adoption of the Origin Certificate in 2008. An Origin Certificate is provided by producers,much like the EAP Certificate. The governmental document for the regulation of Origin Certificates is available on http://www.moa.gov.cn/xw/bmdt/201006/t20100606_1533080.htm.
Finally,in 2016,the Chinese government launched the Edible Agricultural Products Certificate (EAP Certificate),which allows agricultural products to be traced to their source.3The government enforced the EAP Certificate in six pilot provinces,i.e.,Zhejiang,Hebei,Heilongjiang,Shandong,Hunan,and Shanxi in 2016 and announced to carry out the practice of EAP Certificate in a national wide scope in the beginning of 2018. Details about the EAP Certificate are available on http://www.moa.gov.cn/nybgb/2016/dibaqi/201712/t20171219_6102792.htm.Under this approach to traceability,local Agricultural Departments issue EAP Certificates as blank forms,for a small fee,to producers (either individuals or enterprises). EAP Certificates are then filled in by the producers with information including their name,address,contact information,product name and variety,weight,quality/safety information (which can be outcomes of either self-testing or third-party tests),signature and date. The interactions of various stakeholders under the EAP Certificate are described in Fig.2.
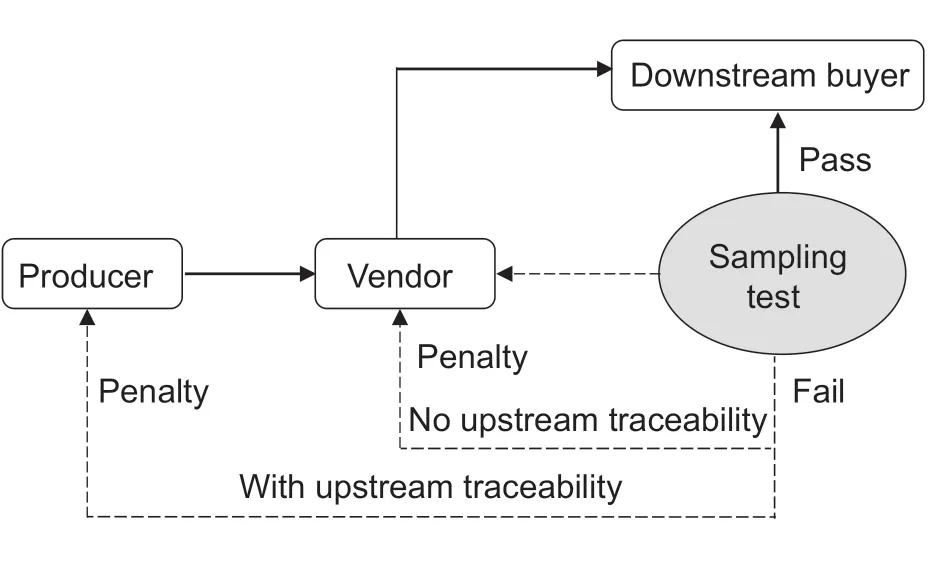
Fig.2 Interactions of stakeholders with the Edible Agricultural Products (EAP) traceability certificate.
While the practice of EAP traceability certificates is not obligatory (i.e.,there is no economic punishment for not providing traceability certificates),the introduction of EAP certificates did bring about changes in the liability between stakeholders. If a product sold by a vendor in a wholesale market fails a government test,then the vendor will be exempt from the fine if they can present an EAP certificate for the failed product. In such a case,the producer who provided the contaminated products would instead be punished. Such a policy illustrates the potential impact of regulatory inspections on traceability adoption.
There have also been some attempts at building traceability systems in the private sector,without any government involvement. Pilot traceability systems have been attempted with some success,mainly by some large enterprises in the vegetable sector (e.g.,Maet al.2016). However,traceability systems for fresh aquatic products are extremely hard and costly to implement,in part because Chinese consumers prefer to buy live aquatic products compared to frozen or packed products. Moreover,the cost of implementing traceability at the fish or shrimp unit is unaffordable (Huet al.2014;Zhanget al.2019). The same situation exists more broadly with respect to building private traceability systems among small producers in other countries (Orden and Roberts 2007;Karippacherilet al.2017). Research has supported the notion that private sector traceability systems have inherent challenges,because of the poor costs to benefits tradeoff,which therefore warrants government intervention (Hobbset al.2005).
2.3.Related work
The research in this paper relies on a comprehensive survey of wholesale market vendors and managers in Zhejiang and Hunan provinces. Prior to this work there have been some other attempts to understand behavior at wholesale markets through field surveys,however most of these wholesale market surveys cover only a few markets. For instance,Mintenet al.(2012) surveyed two wholesale markets in India to understand the transaction behaviors of vendors and Devkotaet al.(2014) surveyed three wholesale markets in Nepal to better understand the main causes of fruits and vegetable wastage. There have been several papers based on wholesale market field surveys in China as well. Ren and An (2010) provide an overview of food safety regulation system in the agro-food wholesale markets based on a case study of 8 markets in Beijing in 2008.
The most extensive wholesale market field survey previously conducted in China was done by the All China Federation of Supply and Marketing Cooperatives,a large wholesale market collective,together with Management Academy of China Cooperatives. They surveyed 220 agro-product wholesale markets throughout China in 2008,but targeted limited market-level information such as the ownership and shareholder composition and extent of governmental subsidies. In contrast,this work surveys the census of aquatic products wholesale markets in Zhejiang and Hunan provinces,and includes 829 manager and vendor field surveys including more comprehensive questionnaires.
There has been a significant amount of literature studying the role of traceability in agricultural supply chains,its importance,the current level of adoption,and how adoption might be improved. Many studies have documented the association between traceability and quality/safety in agricultural products (e.g.,Akerlof 1970;Hobbs 2004;Starbird and Amanor-Boadu 2006;Pouliot and Sumner 2008;Resende-Filho and Hurley 2012;Fenget al.2013;Pantet al.2015;Leviet al.2019;Song and Yang 2019). Empirical studies on the current level of traceability have been done in animal products before (Meuwissenet al.2003;Hobbset al.2005;Pouliot and Sumner 2008;Souza Monteiro and Caswell 2009;Zhouet al.2013). However,to the best of our knowledge,all such studies have focused on countries other than China. While regulatory inspections are also considered as important tools to reduce food safety risks (Hirschauer and Musshoff 2007;Souza-Monteiro and Caswell 2013),the association between them and the adoption of traceability has also not been empirically studied.
There have been several papers that rely on theoretical/analytical models to explore the role of traceability in improving food safety (e.g.,Hobbs 2004). In the field of agricultural economics,it is generally believed that food safety problems are a result of information asymmetry between buyers and sellers,and theoretical models have been created to show how traceability can therefore improve food safety (Starbird 2005). The interaction between regulation and traceability has also been studied theoretically,although the work focused more on revenue impacts rather than the effect on traceability adoption (Xieet al.2016). The effect of product quality/safety on traceability has been modeled,but these previous theoretical results show that suppliers are more likely to adopt traceability for safer products (Pouliot and Sumner 2008). In contrast this paper focuses on vendors,who are intermediaries in the supply chain,and finds both empirically and theoretically that they are more likely to adopt traceability for more dangerous products.
Therefore,this paper attempts to fill several important gaps in the understanding of traceability,including the current level of traceability adoption in China. It provides an empirical analysis of the adoption of traceability and associated factors,and theoretical incentive-based models offering model-driven explanations for these empirically-observed relationships.
While this paper measures traceability through the use of EAP certificates (the government traceability system for agricultural products in China),it should be noted that traceability in the nominal sense is also a function on the type of traceability system used,and there is no consensus on the best traceability system,or even the best way to measure traceability. Some researchers suggest to measure traceability systems from three aspects,including breadth,depth and precision (Zhenget al.2018). Specifically,breadth evaluates the amount of information the traceability system contains,depth evaluates the backwards and forward levels of the traceability enabled by the system,and precision evaluates the degree of assurance that a particular product’s information about its movement and history is accurate. The work in this paper is focused on understanding the adoption of traceability for the current system,and not on the effectiveness of the system.
3.Analytical model
This section describes a stylized incentive-based model that describes a vendor’s profits and costs,and how they are affected by the adoption of EAP certificates. This model also captures how vendors’ adoption of traceability practices is affected by the intensity of regulatory food safety tests,their individual history of failed tests,and their food safety risk awareness. The model aims to provide analytical observations to be tested in empirical analysis.
3.1.Model overview
Consider the incentives from the perspective of wholesale market vendors who source from producers/farms.Denote∈{0,1} to be the decision of vendorjon whether to buy products with traceability from produceri,i.e.,it takes the value 1 when the vendor buys product with traceability and 0 when the vendor buys product without traceability. Denote the risk level of produceriasri∈[0,1],with 1 indicates the highest risk level and 0 the lowest risk level. Although this risk level is approximately known to the vendor,because vendors often have long business relationships with their producers,it is not perfectly known,so we let∈[0,1] denote vendorj’s assessment of the risk of produceri. A vendor pays a pricea+to the producer and receives a pricea´+from the customer,wherea(a´) denotes the prices without traceability andb(b´) denotes the price premium with traceability. Based on conversations with wholesale market vendors,the premium customers are willing to pay for traceabilityb´is very small,and we assumeb´<b.
An inspector samples vendors randomly and conducts tests at wholesale markets with a testing rate oft∈[0,1],with 0 indicates the lowest testing rate and 1 the highest testing rate. Hence,the possibility that a product would not be tested is 1-t. There are two possible outcomes of tests,i.e.,passing and failing. Denote the probability that a test of produceri’s products results in failure asf(ri),wheref(·) is a strictly increasing and continuous function. When there is a failed test,a penaltyγwill be exerted on the vendor if the vendor cannot show traceability information for the products. If the vendor can show traceability information,then the vendor will not be punished and the producer will be punished instead.
Vendorjmakes their traceability decision for products from produceribased on the following optimization problem,in order to maximize their expected profit:

3.2.Inspection intensity and the adoption of traceability
This section considers how regulatory inspection intensity influences vendors’ choices of traceability adoption. Vendors’ choices for traceability largely rely on the expected penalty from inspections. A vendorjis indifferent in between buying products with and without traceability when (b´-b)+γtf()=0.
If (b´-b)+γtf()>0 (or equivalentlyt>(b-b´)/γf(),the vendor’s payoff is larger when=1 than that when=0,so the vendor always adopts traceability,as the extra cost paid for the traceability outweighs the potential penalty of not purchasing it. Likewise,if (b´-b)+γtf()<0,the producer would not purchase traceability. Therefore,given the associated costs,and perceived risk levelof produceri,there exists some threshold of inspection intensitytabove (b-b´)/γf(),vendorjwill adopt traceability. Prediction 1 captures the above insights.
Prediction 1:A stronger inspection intensity drives more wholesale market vendors to adopt traceability for purchased products.
3.3.Traceability and product quality safety
Vendorjis indifferent between buying products with and without traceability information whenor equivalentlyTherefore,given the associated costs,and inspection intensityt,there exists some perceived risk levelat which vendorjis indifferent to adopting traceability. Becausef(·) is a strictly increasing and continuous function,so isf-1(·).Therefore,vendorjwill adopt traceability above this threshold,and not adopt traceability below this threshold. We plot this relationship in Fig.3.
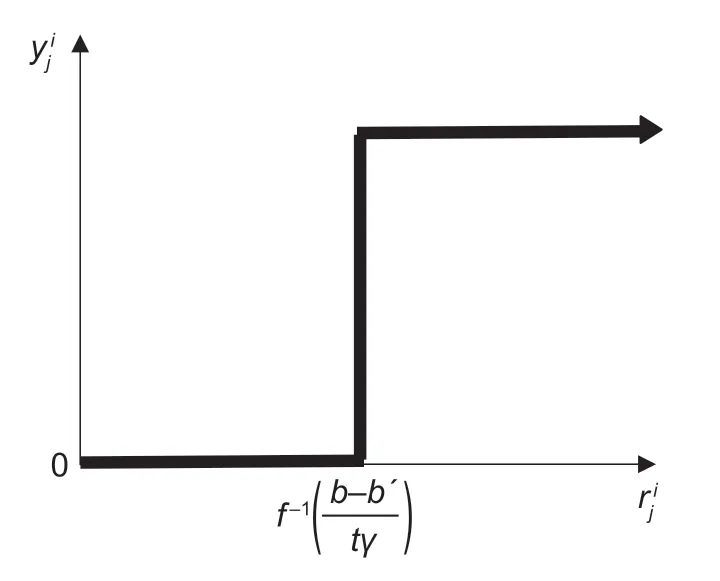
Fig.3 Vendors’ traceability decisions and perceived risk level.
Under this model,a vendor therefore tends to buy products with traceability if they expect that the products are risky,while they would not like to pay the cost of traceability otherwise. Prediction 2 captures these insights.
Prediction 2:Vendors are more likely to adopt a higher level of traceability for products they perceive to be riskier.
3.4.Vendors heterogeneous in risk awareness of food safety
In this section,the model is extended to capture the impact of the heterogeneity in the food safety risk awareness of vendors. For high risk aware vendors,we assume they tend to over-evaluate risk,i.e.,For low risk aware vendors,we assume they underestimate risk,i.e.,Following the same logic as in Section 3.2,we see that high-risk aware vendors will adopt traceability whenever (b´-b)+We have that:becauseis larger for vendors with high risk awareness than that for vendors with low risk awareness,andf(·) is a strictly increasing function,[∂(b´-b)+is also larger for high risk aware vendors.
Therefore,as the inspection intensitytincreases,the threshold (b´-b)+γtf() at which a high-risk aware vendor chooses his/her traceability adoption will increase more than the corresponding threshold for a low risk aware vendor. Prediction 3 is formulated to capture these insights.
Prediction 3:For any level of inspection intensityt,a vendor is more likely to adopt traceability if they have a high level of risk awareness,as opposed to a low level of risk awareness.
4.Data and methods
This section introduces the survey design and data collection methodology. These survey data are then used in Section 5 to empirically test the predictions of the analytical model. Then the empirical model is provided.
4.1.Data
The data underlying the empirical analyses in this paper were collectedviacomprehensive field surveys of aquatic products wholesale markets in Zhejiang and Hunan provinces during 2018. The survey collection effort was conducted by researchers from a university and a research institute. The researchers from the two organizations used the same questionnaires and underwent survey training together,to ensure the survey was administered consistently.
Aquatic products were selected for study because the aquatic supply chain features a huge number of small and disaggregated aquatic farms and wholesale markets play a central role in distribution,and also because aquatic products are especially risky,with a higher failure rate than many other agricultural products (Jinet al.2021).These factors cause traceability to be especially important for aquatic products.
Zhejiang and Hunan provinces were chosen for a variety of reasons. For one,both provinces are among the largest aquaculture producers. The total fishery output,including freshwater and saltwater aquatic farms,was 29.62 billion US dollars in Zhejiang and 8.07 billion US dollars Hunan in 2017.
The two provinces also contrast with each other in several important qualitative ways. First,Zhejiang and Hunan provinces are located on the coast and inland respectively,which affects how aquatic products are produced (more freshwater products are produced inland,and seawater products on the coast). Second,the two provinces have different levels of economic development. Zhejiang is one of the most developed provinces,while Hunan has a much lower level of economic development. Third,Zhejiang stands out as being one of the pioneers in the development of wholesale markets. All of these contrasting differences could affect the adoption of traceability,so studied in tandem,the hope is that results will be more generalizable to all of China.
Several steps were taken to comprehensively select the markets and vendors for sampling. First,the full lists of wholesale food markets were obtained from the Zhejiang and Hunan provincial administrations for market regulation organizations. These lists included 117 wholesale food markets in total in Zhejiang and 43 in Hunan. Second,the lists were filtered to only include wholesale markets which sell aquatic products. This included 38 markets in Zhejiang and 38 in Hunan. All 76 of these markets were included in the surveys. For each of these wholesale markets,the managers were then approached to get a complete list of all vendors involved in the sale of aquatic products. Vendors were then randomly selected to be surveyed,based on the following rules,to ensure the representativeness of the sample from each market:(1) At least 10% of vendors were sampled for markets with more than 100 vendors;(2) At least 10 vendors were sampled for markets with 10-100 vendors;(3) All the vendors were sampled for markets with less than 10 vendors.
Two structured survey questionnaires were designed for face-to-face interviews with managers and vendors. The questionnaires were designed to understand the behavior and dynamics of these wholesale markets in a variety of important aspects,and questions were designed more broadly than those needed for the specific analysis described in this paper. In particular,information collected includes current state of traceability,food safety risk awareness,level of testing of vendors,market infrastructure,sourcing of products,sales of products,determination of product quality,determination of price,and so on.
To create the questionnaires,literature on survey design was consulted. In particular,the methodology fromThePowerofSurveyDesignwas followed when designing the questionnaires (Iarossi 2006). This book includes a comprehensive review of academic research on how survey design relates to response accuracy and participation,and was written by economic researchers at the World Bank whose survey targets share many commonalities with those in this paper. Following the methodology set forth above,both questionnaires were also revised for multiple rounds based on pre-survey interviews with managers and vendors not selected for the final survey. Interviewers were also trained extensively with standardized conversation prompts related to each question in the surveys. Following this training,face-toface interviews were conducted with the managers and randomly selected vendors,in all 76 wholesale markets,between April and September 2018. The final survey database consists of answers from 76 market managers and 753 aquatic product vendors,among which 463 vendors were from Zhejiang and 290 from Hunan.
4.2.The model
To model the association between the adoption of traceability,and the independent variables,a logistic regression is used. Logistic regressions are commonly used where the dependent variable,in this case the adoption of traceability as measured by the use of EAP certificates,is binary. Because the data collected through the survey questionnaires involve a large set of variables relative to the number of samples,and more importantly may have variable collinearity and overfitting problems,a Least Absolute Shrinkage and Selection Operator (LASSO) penalty is initially added to the logistic regression to perform feature selection and protect against this (Tibshirani 1996;Zou 2006).
LetXidenote the vector of independent variables andyidenote the adoption of traceability for vendori,and letβdenote the model coefficients. The relevant probabilities for the model are then given by:

The log-likelihood across the observed dependent variablesY,is therefore given by:

And after adding the LASSO penaltyλ,the loglikelihood is given by:
The model is fit through maximum likelihood estimation (MLE),and the lambda penalty for feature selection is chosen using k-fold cross validation. This was accomplished using thecv.glmnetfunction from theglmnetpackage inR. From a 10-fold cross validation,it was found that the best value ofλwas 0.0046. The LASSO-logistic was then rerun on the entire dataset for feature selection,using thisλvalue. The only feature removed from the analysis (based on it having a fitted value of 0.0) was the indicator for primary markets. An unpenalized logistic regression is then run on these selected features,to give interpretableP-values for the fitted model coefficients,as the bias introduced through regularization is commonly thought to makeP-values uninterpretable (Kyunget al.2010).
5.Results and discussion
Using the survey data introduced in Section 4,the analysis presented in this section seeks to empirically tests the predictions formulated from the analytical model. To be specific,this empirical analysis seeks to understand the association between vendors’ adoption of traceability and inspection intensity,their individual history of food safety problems,and risk awareness.
Table 1 introduces the variables used in the empirical analysis. These were created using the results of the survey described in Section 4. Table 1 includes the dependent variable used to model traceability,the independent variables hypothesized to be related to the adoption of traceability,and a number of control variables,included due to their possible influences on vendors’ adoption of traceability.
There are a couple details regarding the independent variables in Table 1 worth noting. First,the number of inspections in the last year was recorded based on vendors’ responses,and might capture a vendor’s perception of how often they were tested,in addition to how often they were actually tested. Nevertheless,this figure is the most reliable value for testing intensity available to us,as market self-testing data are either not recorded by the markets or kept private. The question was also designed with a specific,recent time frame in mind to maximize response accuracy (Iarossi 2006).Second,past failure experience is regarded as an indicator of the expected quality of products,because vendors tend to source from suppliers with which they have a long-term business relationship. Third,risk awareness was approximately measured through membership in aquatic products related associations and WeChat groups. While this membership does not directly measure risk awareness,asking directly about risk awareness could be perceived as a loaded question,and would invite very biased and inaccurate responses (Iarossi 2006). Because quality and safety are regularly discussed in these aquatic products related associations and WeChat groups,this may be a more accurate approach to approximate risk awareness.
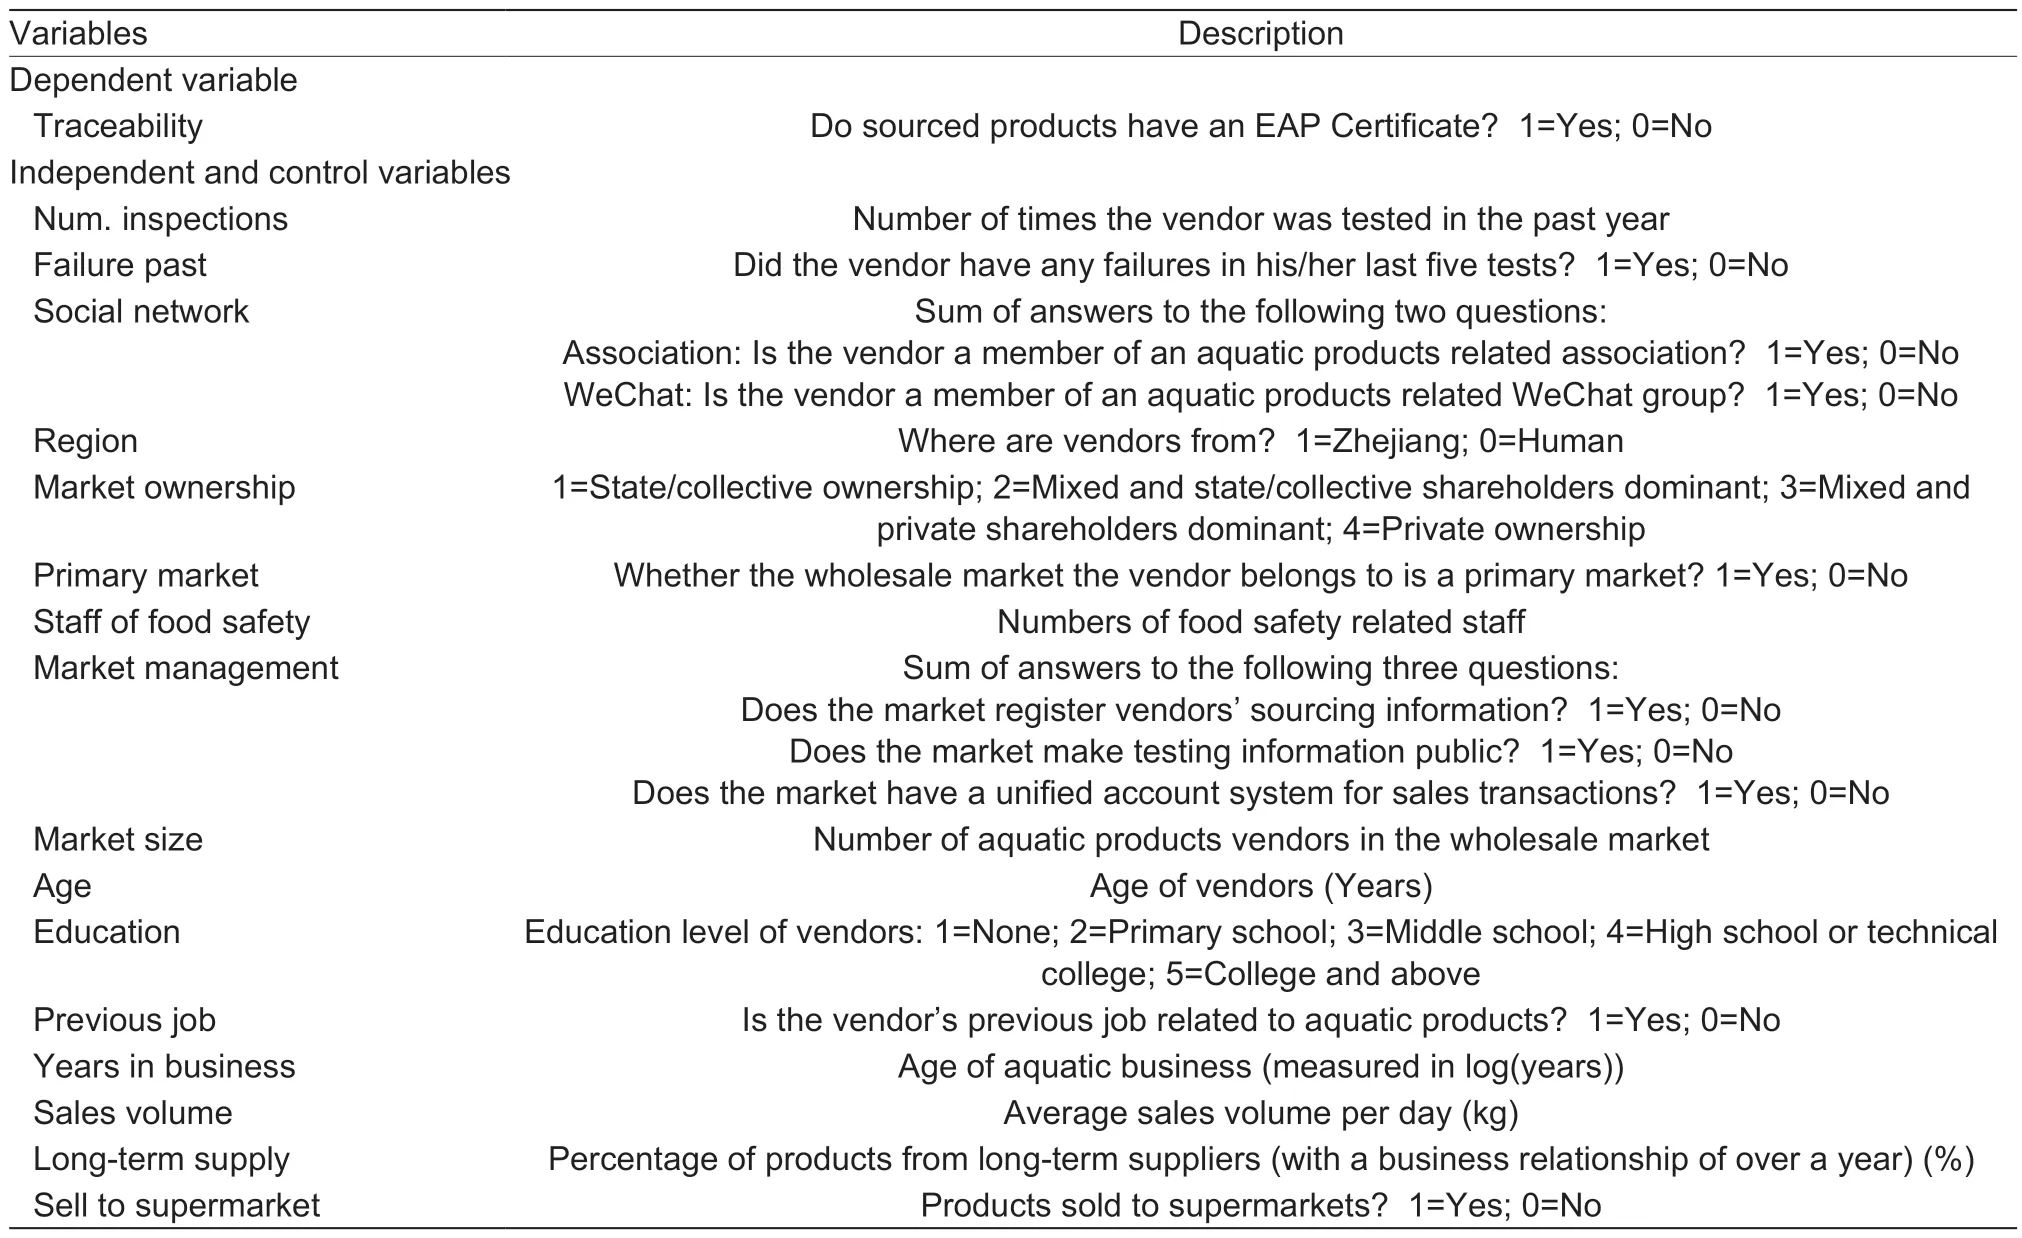
Table 1 Defining variables
Note that many of the control variables from Table 1 reflect the characteristics of the respective wholesale market management system,rather than vendor specific information. This includes information such as the geographical area of markets,ownership types of markets,the number of food safety related staff,the market size,and market management practices. Three indicators related to the management system of markets are considered,specifically whether the market collects information regarding vendors’ sourcing channels,whether the market has a unified account system for sales transactions,and whether the market publishes the outcomes of its self-inspection. These three indicators are added,to create the variable referred to as“market management”.
Table 2 provides descriptive statistics of the dependent variable and explanatory variables. In places where the number of observations for a variable in Table 2 is less than 753,this represents cases where the vendor or market manager either did not know the answer to a question,or refused to answer. Most notably,we observe that about one third of vendors surveyed buy products with EAP certificates,while two thirds of vendors do not.This indicates that there is a substantial opportunity to improve the adoption of traceability.
It can be observed from Table 2 that a substantial number of the vendors (12.6%) said their products had a failed outcome in the last five tests. Also,27.8% of vendors are members of either aquatic product related associations or WeChat groups,with 6.1% of these vendors belonging to both types of groups.
A large amount of heterogeneity in the vendors and wholesale markets surveyed is also observed from Table 2. Vendors surveyed are split fairly evenly across primary and secondary markets,with those market types accounting for 44.2 and 55.8% of the data points,respectively. The management level of markets is limited in scope,as only 14.21% of markets adopted all three measures of accounting practices and transparency that were studied (record of vendors’ sourcing channels,uniform account system,and publishing tests outcomes). The majority (about 70%) of the vendors are over 40 years old and 21.6% of vendors had aquatic products business experience in their previous job. Around 20% of vendors sell some of their products to supermarkets,while in contrast most vendors sell to downstream wholesalers or wet markets.
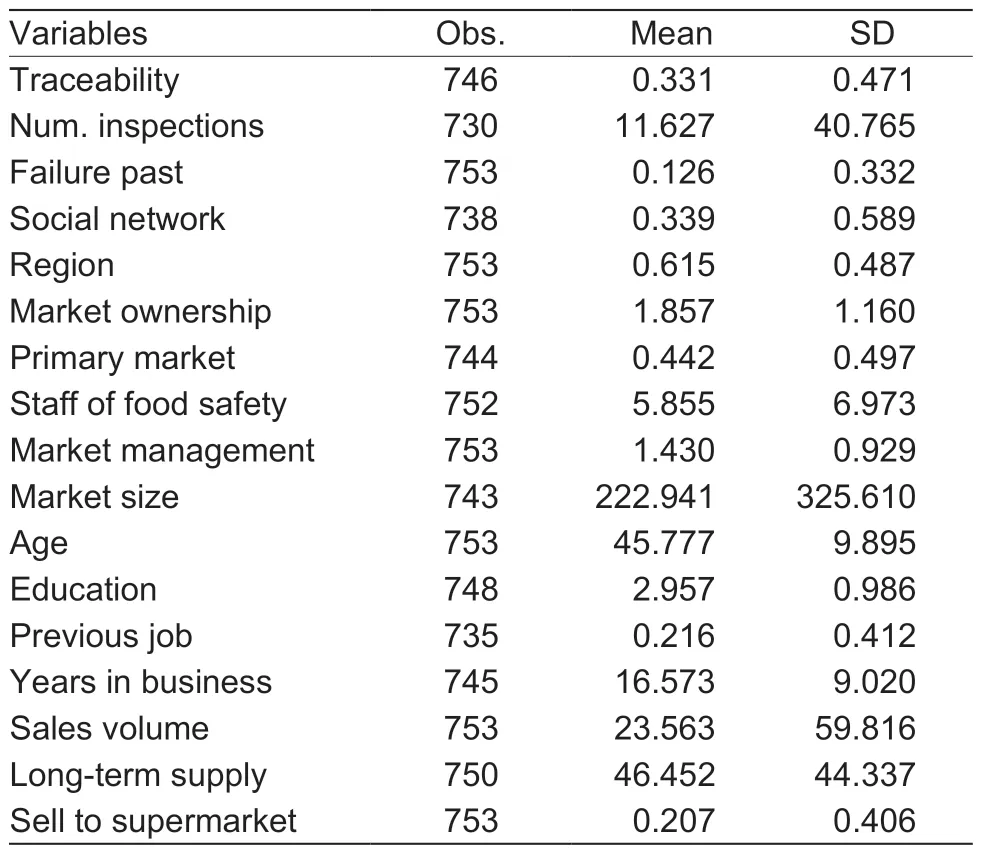
Table 2 Descriptive analysis of variables
To assess the factors associated with the adoption of traceability,the survey dataset of 753 vendors was filtered to remove vendors that did not answer some of the important questions in Table 2. In particular,the dataset was first filtered to remove vendors who did not report whether they use EAP traceability certificates,leaving 746 vendors. It was then filtered to remove vendors not reporting one of the three independent variables,leaving 716 vendors. Finally,it was filtered to remove records for which the manager did not report the number of aquatic vendors in the market or the level of management practices (as these were the most important control variables,each with a significance level ofP<1×10⁻⁷),leaving 706 vendors for the final analysis.
Then the LASSO-logistic regression with k-fold cross validation was used to subset features for the analysis,which removed the control variable for primary markets (see Section 5.2). Finally,a logistic regression was run on these selected features,to find statistically significant associations with traceability. The results are displayed in Table 3,including the fitted model coefficients,standard deviations,and significance level of theP-value.
From Table 3,it is observed that the empirical analysis of the survey data,shows support for all three predictions from the analytical model. In particular,it is observed that the intensity of inspections has positive and significant effect on traceability adoption by vendors. It is also observed that traceability adoption by vendors is positively and significantly associated with a history of past failures. This is especially interesting,as it relates to ongoing debate in the literature on whether to expect traceability adoption to be more likely for safe or for risky products (see Section 2,for a further discussion). Table 3 also shows that risk awareness (specifically exposure to quality and safety issues as measured by their involvement in aquatic products social media groups) is positively and significantly associated with the adoption of traceability. Hence,prediction 3 derived from the analytical model is supported.
It is possible that the punishment exerted by the government for the failure is heterogeneous across markets with different ownership types. For example,the government may exert lighter punishment on vendors in markets with shares owned by the government than that in privately owned markets. Therefore,we also look at the heterogeneity of the effect of sampling intensity on vendors’ adoption of traceability by including the interaction of inspection and market ownership in the model. The results show that the effect of inspection intensity on the adoption of traceability by vendors is heterogeneous across markets with different ownership types,i.e.,the adoption of traceability by vendors are more sensitive to inspection intensity in markets with private ownership than in markets with state/collective ownership. To be specific,the increase in one inspection test by the government or market management results in an increase in the possibility of traceability adoption by vendors by around 5.52% in privately owned markets and by only 0.37% in markets with state and/or collectively owned capital shares.
There are also additional insights suggested by the analysis,related to the control variables. Traceability adoption tends to be higher at privately owned markets,all other factors held constant. The management level of wholesale markets (Table 1) and market size both have a very significant positive effect on vendors’ adoption of traceability,withP-values ofP<1×10⁻⁷. As for vendors’ personal features,both a higher level of education and more previous experience in an aquatic products business are associated with the adoption of traceability.Interestingly,it is shown that sales volume is actually negatively correlated with traceability adoption,with smaller vendors being more likely to adopt traceability.Traceability adoption is also seen to be higher for vendors that purchase more from long-term suppliers. Sales channels also influence vendors’ decision of traceability adoption. In general,supermarkets have more requirements for product quality and traceability,and therefore it is unsurprising to see that vendors selling to supermarkets seem to have a higher level of traceability adoption (Boselieet al.2003).
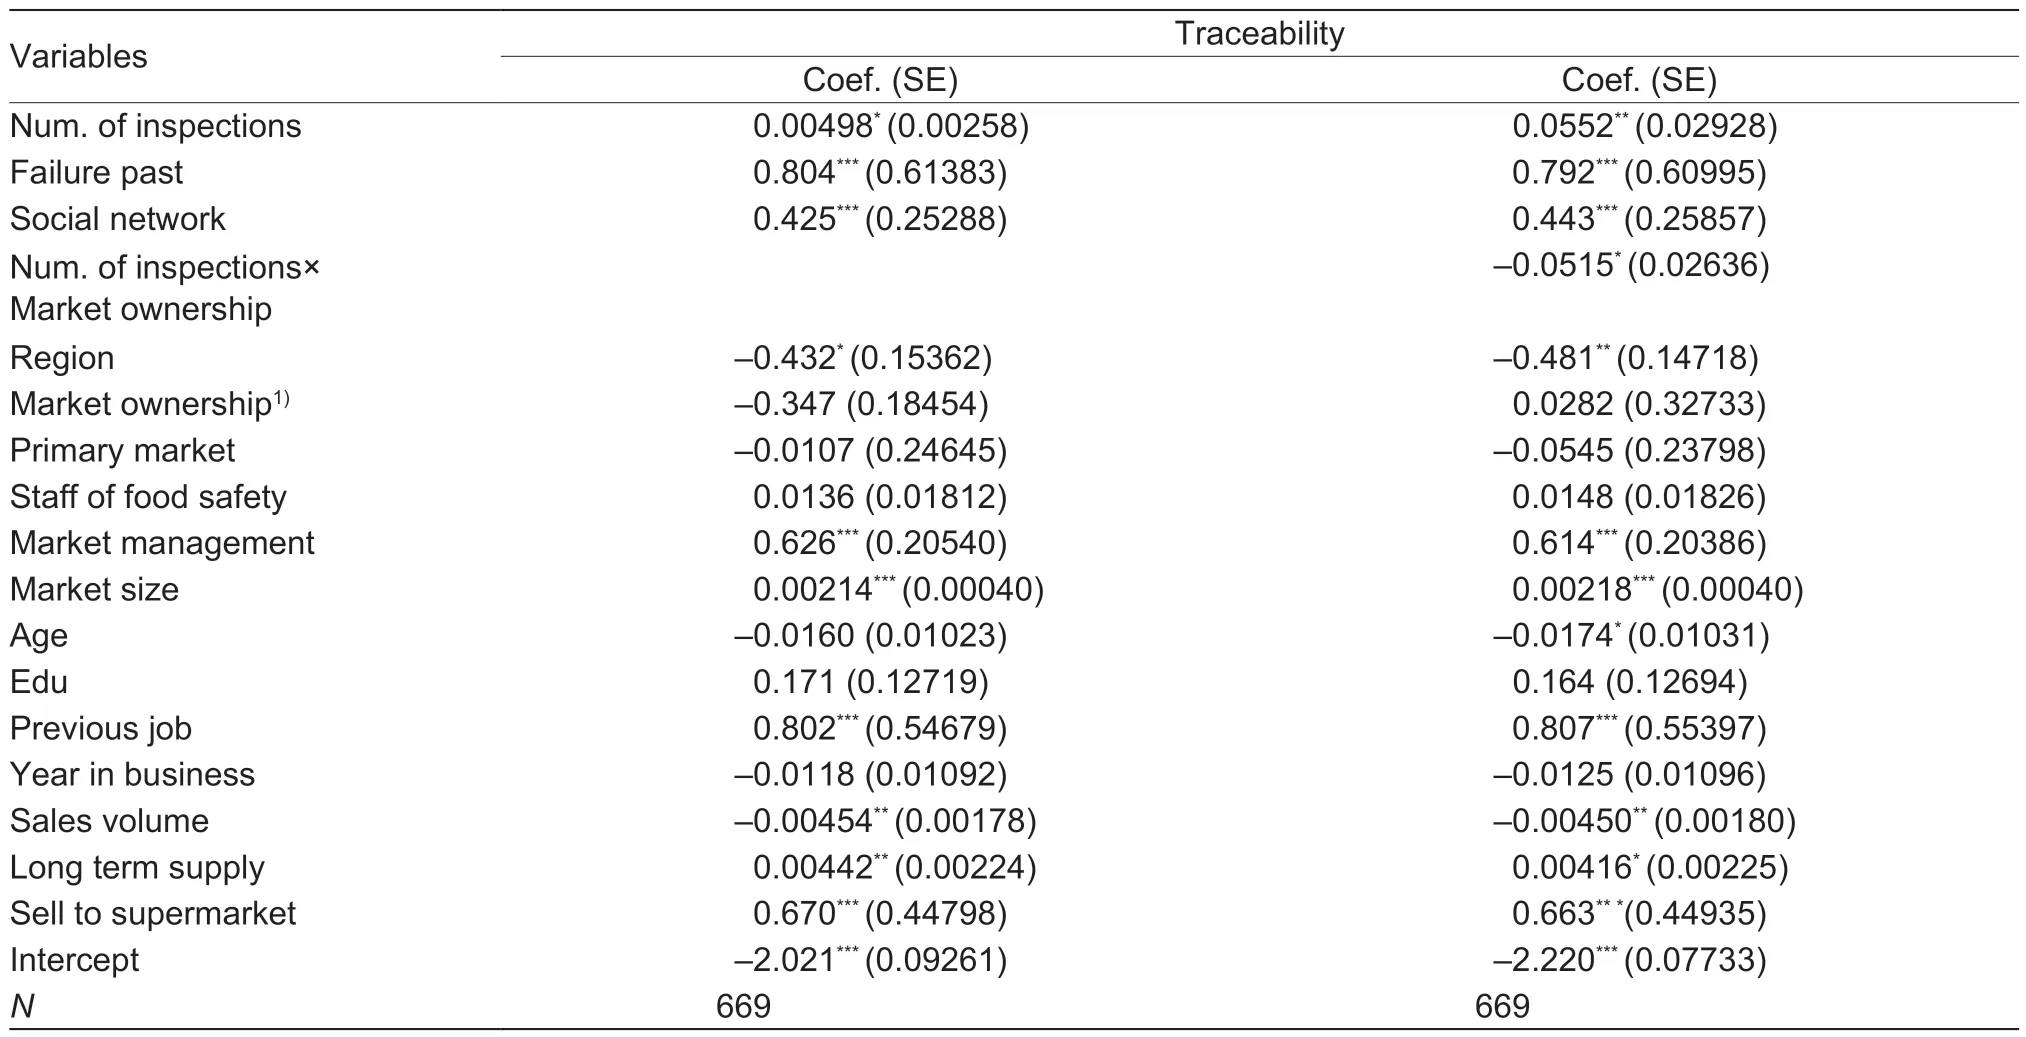
Table 3 Logistic regression fitted model coefficients
6.Conclusion
This paper studied the adoption of traceability amongaquatic products wholesale market vendors in China,established an incentive-based analytical model to predict vendors’ profit-maximizing decisions on whether to adopt traceability,and provided a first-of-its-kind empirical analysis to show evidence for these predictions. The empirical analysis was based on a major effort to design and administer the largest wholesale market field survey ever conducted in China,both in breadth and in depth. The survey included market managers from all 76 wholesale markets selling aquatic products in Zhejiang and Hunan provinces,China,as well as 753 vendors from these markets. In the empirical analysis of the survey results in Section 5,three key relationships,predicted from the analytical model,were observed with a high-level of statistical significance. First,it was found that a higher intensity of government inspections is associated with a higher adoption of traceability by vendors as measured by adoption of EAP certificates,and the association is stronger in privately owned markets than in state/collectively owned markets. Second,it was observed that among vendors with a history of food safety problems (as measured by past inspection failures),traceability adoption is higher. Third,it was observed that adoption of traceability is higher for vendors with a higher risk awareness (specifically exposure to quality and safety issues as measured by their involvement in aquatic products social media groups).
These statistical associations could suggest several important policy considerations and insights. First,from the perspective of the government,food safety tests may have more value than merely the value derived from failed tests. In addition to the first-order effects of food safety tests (removing adulterated products from circulation and punishing the relevant businesses),there would be some additional second-order effects (motivating more vendors to adopt traceability practices). However,the intensity of inspection depends on the budget constraint and the allocation of sampling strategy. This is beyond the scope of the current research,though. Second,it would motivate investing more in raising awareness of food safety issues,in order to increase traceability adoption.This could be done directly,through wholesale market vendor education related to food safety,or indirectly by promoting membership in aquatic products related organizations and social media groups.
While China has already made significant progress in managing food safety,there is still much room for improvement. As seen in Table 2,just one-third of wholesale market vendors have adopted use of the EAP certificates. The hope is that this paper,with its datadriven approach,will help fill the gaps in understanding factors associated with the adoption of traceability,and empower regulatory agencies to incentivize the adoption of traceability even further to reduce food safety risks.
The paper has some drawbacks which can also be the possibility of future research. First,the effects of food safety tests by the government and the wholesale markets are not able to be separated due to the limit of data. Second,farmers’ provision of traceability and the willingness-to-pay of downstream buyers or consumers for the traceability of products are only mentioned in the analytical model,but not included in the empirical model. This may be further considered in future work.
Acknowledgements
The research was funded by the Fundamental Research Funds for the Central Universities,China and ZJU-IFPRI Center for International Development Studies,and the National Planning Office of Philosophy and Social Science of China (19ZDA106). The authors would like to thank Dr.Ai Yongmei,Dr.Liu Xuan,Dr.Wang Jun,Dr.Wei Wei,and Dr.Zhu Wenhao from Beijing Business Management College,China,for leading the survey in Hunan.
Declaration of competing interest
The authors declare that they have no conflict of interest.
杂志排行
Journal of Integrative Agriculture的其它文章
- lmpacts of climate change on drought risk of winter wheat in the North China Plain
- Assessing the impact of non-governmental organization’s extension programs on sustainable cocoa production and household income in Ghana
- Bacterial diversity and community composition changes in paddy soils that have different parent materials and fertility levels
- lncreased ammonification,nitrogenase,soil respiration and microbial biomass N in the rhizosphere of rice plants inoculated with rhizobacteria
- Regional distribution of wheat yield and chemical fertilizer requirements in China
- Changes in organic C stability within soil aggregates under different fertilization patterns in a greenhouse vegetable field
