lmpacts of climate change on drought risk of winter wheat in the North China Plain
2021-10-22ZHANGLiCHUQingquanJlANGYulinCHENFuLElYongdeng
ZHANG Li,CHU Qing-quan,JlANG Yu-lin,CHEN Fu,LEl Yong-deng
1 College of Agronomy and Biotechnology,China Agricultural University,Beijing 100193,P.R.China
2 Key Laboratory of Farming System,Ministry of Agriculture and Rural Affairs,Beijing 100193,P.R.China
Abstract Drought is a major natural disaster causing crop yield losses,while its occurrence mechanism and spatiotemporal variations in a changing climate are still not clear. Based on a long-term climatic dataset (during 1958-2015) from weather stations in the North China Plain (NCP),the influencing mechanism of various climatic factors on drought risk of winter wheat was quantified by using sensitivity analysis,Mann-Kendall trend test and slope estimation. The results indicated that climatic factors have changed considerably over the past six decades in the growth season of winter wheat. As a result,winter wheat suffered from severe droughts (with 350 mm of water deficit during its growth season),particularly at the jointing-heading and heading-mature stages,which were critical to crop yield formation. There were large spatial and temporal variations in drought risk and climatic change factors at different growth stages of winter wheat. Despite precipitation playing a vital role in determining the spatiotemporal patterns of drought risk,high temperature and low humidity along with other climatic factors at key growth stages of winter wheat aggravated drought risk. Particularly,temperature at nearly 90% weather stations showed a notablely upward trend,which exacerbated water deficit and drought risk of winter wheat. Given the complexity and high uncertainty of climate change,these findings provide important information for adapting crop production to future climate change and accompanied droughts while ensuring food security and agricultural sustainability.
Keywords:climate change,winter wheat,drought risk,spatiotemporal variations,food security
1.lntroduction
The continuous global climate changes,especially the abnormal changes in the spatiotemporal patterns of temperature and precipitation,have posed great challenges to agricultural production and water resources security.A warming trend in China has been established in the literature (Donget al.2013),with temperature increasing by 1.2°C from 1960 to 2010 (Piaoet al.2010). In addition,the response of crop production to climate change has been evaluated from different perspectives and scales (Sommeret al.2013;Tacket al.2015;Yanget al.2015). Climate change can cause a range of eco-environmental problems,including severe droughts and water scarcity,crop yield losses and further social-economic consequences (Piaoet al.2010;Lobellet al.2011;Chenet al.2014;Xieet al.2018). Particularly in the North China Plain (NCP),a main production area for winter wheat in China,due to climate change and variable precipitation,droughts often affected winter wheat during its growing season (Chenet al.2018).In order to maintain stable production,huge amounts of irrigation water has been applied,which has caused a rapid decline in groundwater level and exacerbated the influences of droughts (Shiet al.2010;Aliet al.2017). As a result,large reductions in crop yields caused by climate-related droughts have been seen in recent years. It is urgent to identify the influencing mechanism and spatiotemporal variations of drought risk in a changing climate in order to ensure regional food security.
Given the complex dynamics of climate change,the study on the impact of climate change on drought risk should not only focus on single factors such as precipitation or temperature,but also need to analyze the comprehensive effects of various climatic factors. There are many climatic factors influencing droughts and crop yield (Chenet al.2013;Wang 2017). A rising temperature will increase drought frequency and induce yield losses for winter wheat (Lobell and Ortiz-Monasterio 2007;Liet al.2015). Unlike reduced temperature,reduced solar radiation may also damage crop production (Chenet al.2013;Yanget al.2014). The potential evapotranspiration,which is always used to estimate the crop water demand and agricultural irrigation,has been evaluated to analyze the effect of climate change (McVicaret al.2012;Namet al.2015;Liuet al.2016). Recent evidence suggested that the potential evapotranspiration and drought risk of crops varied greatly across regions,and its determinants also diversified (Huoet al.2013;Liuet al.2016,2019). However,by now,the drought occurrence mechanism of winter wheat and its response to climate change are still not clear. More in-depth studies are needed to reveal the spatiotemporal variations of drought risk for winter wheat at different growth stages in different regions,especially under a warming and drying climate in the NCP in recent decades.
Previous studies have carried out drought monitoring and risk assessment by using various indicators and methods (Zouet al.2012;Chen and Sun 2015;Parket al.2017;Bettset al.2018). Current drought assessment indicators are mainly divided into meteorological drought,hydrological drought and agricultural drought,such as precipitation anomaly,Palmer drought index and standardized precipitation evapotranspiration index (Liet al.2007;Trnkaet al.2011;Yuet al.2014;Wuet al.2018).Among them,aridity index (AI) is an indicator that could comprehensively reflect drought risk and its influences on crop yields (Bannayanet al.2010;Zarchet al.2015;Huanget al.2016). It has been used to evaluate drought risk,at the global and regional scales,to indicate the spatiotemporal variations of crop drought (Zarchet al.2015;Huanget al.2016). Therefore,this study employed AI to analyze the spatiotemporal patterns of the drought risk of winter wheat in the NCP.
The objective of this study is to reveal the occurrence mechanism and spatiotemporal variations of drought risk of winter wheat affected by climate change at different growth stages,which is helpful for mitigating the adverse impacts of climate change and drought risk on regional crop production. Based on a synthetic evaluation of drought risk of winter wheat at its different growth stages over the past 60 years,this study quantified the effects of various climatic factors on drought risk of winter wheat including precipitation,temperature,humidity,and wind speed in a changing climate.
2.Materials and methods
2.1.Study area
The NCP is the second largest plain in China,covering an area of about 300 000 km2,which includes Beijing,Tianjin,Hebei,Henan,and Shandong. This region is one of the major grain-producing regions dominated by a“winter wheat-summer corn”rotation cropping system. Due to the mismatch between regional precipitation and wheat production,excessive agricultural irrigation water was consumed (Wanget al.2018). Large-scale winter wheat irrigation has led to a significant decline in groundwater level and,as a result,the NCP has become one of the most serious groundwater overdraft regions in China (Tiet al.2018). Statistics of the regional climatic variables (Table 1) indicate a warming and drying climate in recent decades,which aggravates drought severity and its impacts on crop production. Therefore,it is urgent to study the occurrence mechanism and spatiotemporal variations of drought risk during the growth season of winter wheat under a changing climate.
2.2.Data sources
The climatic data used in this study are from 47 national standard weather stations in the NCP from 1958 to 2015,which include temperature,precipitation,sunshine hours,wind speed,relative humidity,etc. The crop phenology data of winter wheat come from the crop growth and development dataset of China Meteorological Data Network. According to the growth characteristics of winter wheat,its growth period can be divided into four stages:sowing-returning green,returning green-jointing,jointing-heading,and headingmature. As shown in Table 2,the NCP is divided into four sub-regions according to the difference in heat conditions at different latitudes from south to north. Crop coefficients arethe monthly reference values of winter wheatKccoefficients provided by the national standard for agricultural drought (GB/T 32136-2015).

Table 1 The province-level statistics of the climatic variables during 1958-2015

Table 2 The initial dates of different growth stages of winter wheat at different latitudes of the North China Plain
2.3.Methods
Reference crop evapotranspirationIn this paper,the Penman-Monteith equation recommended by FAO was used to calculate the evapotranspiration of reference crops (Allenet al.1998):

where∆is the slope of the saturation vapor pressure at mean air temperature curve (kPa °C-1),RnandGare the net radiation and soil heat flux density in MJ m-2d-1,γis the psychrometric constant (kPa °C-1),Tmeanis the daily mean temperature (°C),U2is the mean wind speed in m s-1,esis the saturation vapor pressure (kPa) calculated from the mean air temperature (°C) for the day,andeais the actual vapor pressure (kPa) calculated from the mean dew point temperature (°C) for the day.
Crop water demandCrop water demand is equal to the product of crop reference evapotranspiration and crop coefficientKc(Allenet al.1998):

whereETcis the crop water demand andET0is crop reference evapotranspiration. The values of crop coefficientsKcfor different months at the growth stages of winter wheat are shown in Table 3.

Table 3 The values of crop coefficients for different months at the growth stages of winter wheat1)
Effective precipitationThe following equation presents the calculation method of effective precipitation (Yinet al.2016):

wherePe,αandPare the effective precipitation,utilization coefficients and precipitation,respectively. WhileP≤5 mm,α=1;while 5 mm<P≤50 mm,α=0.9;whileP>50 mm,α=0.75.
Aridity index (Al)AI was used to quantify drought severity at different growth stages of winter wheat.It can be calculated as follows (Some’eet al.2013;Zarchet al.2015;Huanget al.2016;Tiet al.2018):

wherePis the total precipitation (mm) at different growth stages of winter wheat;ET0is the reference crop evapotranspiration. The smaller the value ofAI,the more severe the drought situation.
Sensitivity analysisIn order to explore the occurrence mechanism of drought risk and clarify the influences of different climatic factors on the drought risk of winter wheat at different growth stages,this paper analyzed the sensitivity of AI to different climatic factors. In the fields of meteorology and hydrology research,many scholars used the sensitivity analysis method to study the relationship between crop evapotranspiration or drought index and various climatic factors (Estevezet al.2009). The calculation method (eq.(5)) was commonly used to quantitatively analyze the sensitivity difference of AI to different climatic factors such as temperature,precipitation,relative humidity,etc.(Zhanget al.2010;Yanget al.2017):

whereSViis the sensitivity coefficient ofAIto a certain climatic factor,andViis the corresponding climatic factor. WhenSViis positive,it means that theAIincreases with the increase of climatic factors. The larger its absolute value is,the greater the influence degree is.
Mann-Kendall trend test and slop estimationThe methods of Mann-Kendall trend test and Sen’s slope estimator are widely used to analyze the variation trends in the meteorological and environmental fields (McVicaret al.2012;Huoet al.2013;Liuet al.2016). Here,this study followed the method of Mann-Kendall trend to evaluate the trends of different climatic factors (Hesset al.2001),and Sen’s slope estimator was used to estimate the trend magnitudes (Sen 1968).
In this study,both the Mann-Kendall trend test and Sen’s slope estimator were calculated by a“trend”package of R Programming Language.
Spatial analysisArcGIS 10.5 and R Programming Language were used to analyze the spatiotemporal variations of different indicators,and to perform result statistics and mapping.
3.Results
3.1.Water supply and demand during the growth stages of winter wheat
As shown in Fig.1,the average water demand and effective precipitation at each growth stage of winter wheat were calculated. Overall,the water demand and effective precipitation of winter wheat decreased first and then increased during the growth period of winter wheat. As for all growth stages,the effective precipitation cannot meet the water demand,of which the total water deficit was 350 mm. However,the water deficit varied at different growth stages. Winter wheat at the first three stages required less water,so the water deficit was correspondingly lower than the heading-mature stage.
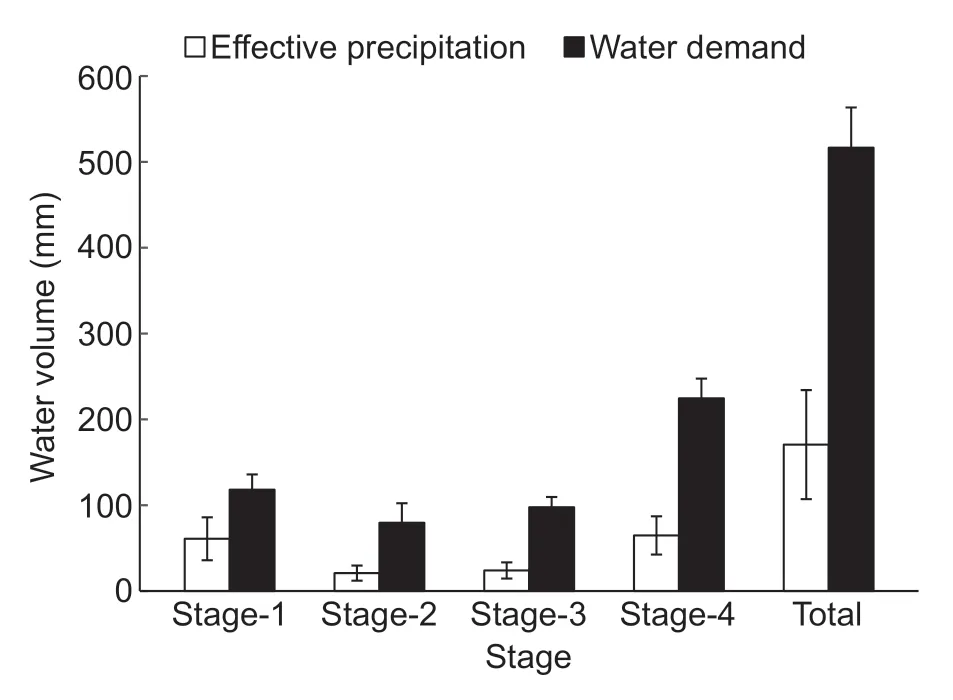
Fig.1 Water demand and effective precipitation of winter wheat in the North China Plain (NCP). Stage-1,Stage-2,Stage-3,and Stage-4 represent the growth stages of sowing-returning green,returning green-jointing,jointing-heading,and headingmature,respectively;total represents the values at the whole growth stage of winter wheat. Bars mean SD (n=47).
As for the province-level statistics,the water demand in Henan at the whole growth stage was the lowest,of which the effective precipitation was the highest (Table 4). The average water demand at the whole growth stages of all locations showed a decreasing trend. Opposite to water demand,the average effective precipitation at the whole growth stages showed an increasing trend except Henan. At the same time,the returning green-jointing stage of all regions had an uptrend of water demand,while the trend of effective precipitation presented a downtrend except Beijing.
3.2.Spatiotemporal variations in drought risk of winter wheat at different growth stages
By calculating the average AI of all weather stations in the NCP,this study analyzed the interannual variations in AI from 1958-2015 at each growth stage of winter wheat. A decreasing trend for the average value of AI at the returning green-jointing and jointing-heading stages,which suggested that drought risk at these two stages was growing (Fig.2). There was a growing trend of average AI at the joint-mature stage,suggesting a declining trend of drought risk.
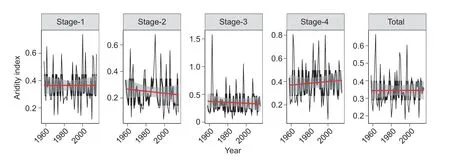
Fig.2 Interannual variations in aridity index at different stages of winter wheat. Stage-1,Stage-2,Stage-3,and Stage-4 represent the growth stages of sowing-returning green,returning green-jointing,jointing-heading,and heading-mature,respectively;total represents the whole growth stage of winter wheat.
The trends of AI in different growing seasons of winter wheat were further analyzed spatially (Fig.3). In general,winter wheat faced a serious increase in drought risk in the southern and eastern regions of the NCP. At the sowingreturning green stage,drought risk in northern regions of the NCP showed a declining trend,while the other regions indicated an increasing trend. Compared with the sowingreturning green stage,more weather stations showed an increase tendency of drought risk at the returning greenjointing stage. The spatial patterns of the drought risk trends at the jointing-heading and heading-mature stages were different with the previous two stages. The number of weather stations with a decrease trend of drought risk in the last two growth stages exceeded that in the first two growth stages. Drought risk in the southern NCP showed an increase trend at both the jointing-heading and headingmature stages.
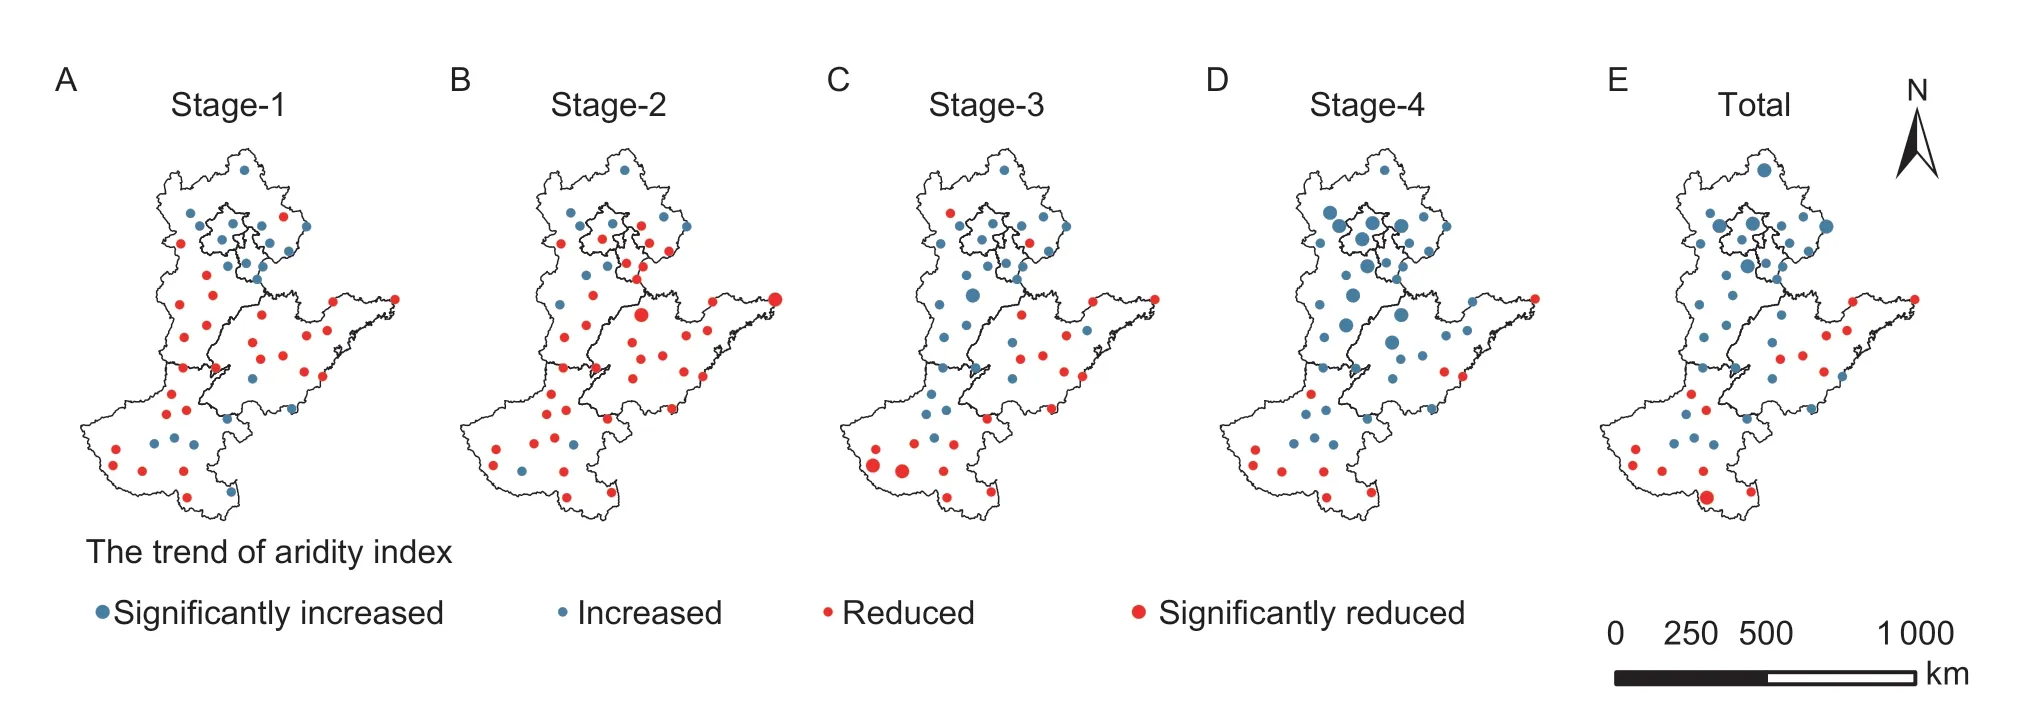
Fig.3 Spatial variations in aridity index at different growth stages of winter wheat in North China Plain. Stage-1,Stage-2,Stage-3,and Stage-4 represent the growth stages of sowing-returning green,returning green-jointing,jointing-heading,and heading-mature,respectively;total represents the whole growth stage of winter wheat.
3.3.Spatial correlations between drought risk and various climatic factors
The spatial patterns of the average values of AI,relative humidity,sunshine hours,mean temperature,wind speed and precipitation at the whole growing season of winter wheat are shown in Fig.4. There was a clear variation in the spatial pattern of all indicators except wind speed. Drought risk increased from the south to north with lower AI value in the northern NCP. The spatial patterns of relative humidity,sunshine hours and precipitation were similar with the AI,which meant that,compared to the south regions,the north regions in the NCP suffered from more severe drought risk mostly attributed to lower relative humidity,longer sunshine hours and less precipitation. Mean temperature was the highest in the central region of the NCP while wind speed was high in the eastern part.
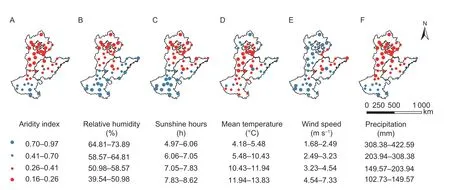
Fig.4 Spatial patterns of aridity index (A),relative humidity (B),sunshine hours (C),mean temperature (D),wind speed (E),and precipitation (F).
In order to dissect the spatial formation mechanism of drought risk,this study analyzed the spatial correlations between AI and different climatic factors (Fig.5). The results indicated that the spatial pattern of AI was most correlated with precipitation (R2=0.96),followed by sunshine hours (R2=0.58) and relative humidity (R2=0.57),implying their dominant role in determining the spatial pattern of drought risk. The correlation between mean temperature and AI was quiet low,as same as wind speed,but this did not contradict the fact that mean temperature and wind speed could affect drought risk.
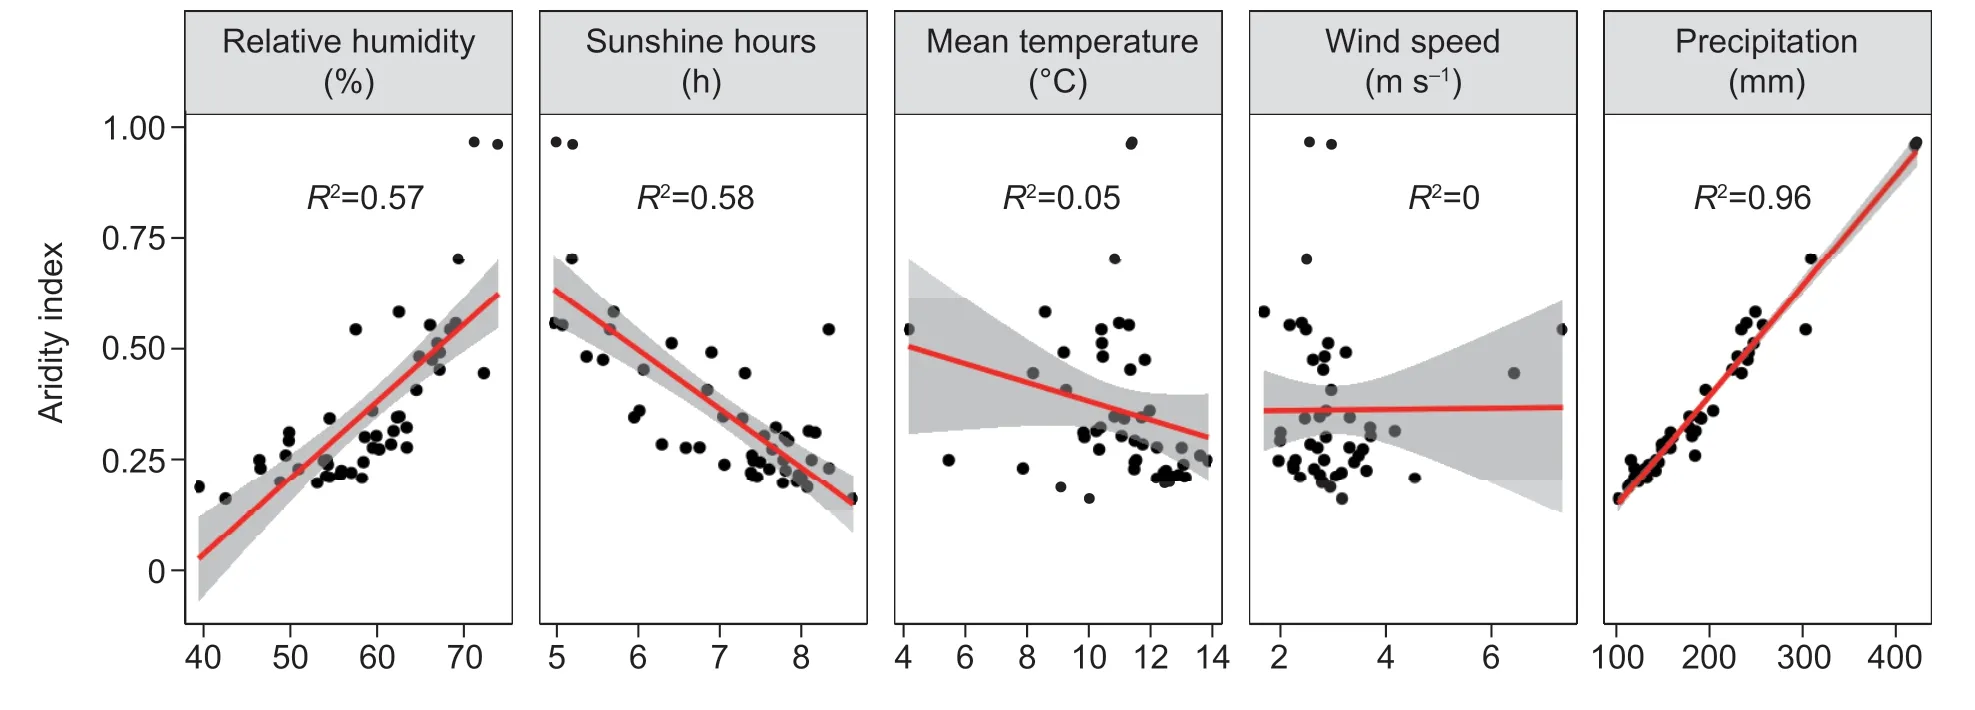
Fig.5 Spatial correlations between aridity index and various climatic factors. Each point in the figure represents a weather station.
When examining the spatial correlations between climatic factors and AI at different growth stages of winter wheat (Table 5),it was found that the average value of the whole growth stage underestimated the effect of temperature. During the jointing-heading and heading-mature stages,the mean temperature was 13.98 and 19.98°C,respectively,while theR2of spatial correlation with AI was 0.35 and0.28,respectively. The value of relative humidity varied from 56.19 to 61.9%,and the sunshine hours showed an increase trend with the growth of winter wheat. Precipitation at different stages varied greatly,and its correlation with AI is the highest among all the climatic factors during the whole growth period.

Table 4 The province-level statistics of the water demand and effective precipitation in the North China Plain1)
This study also estimated the trends of different climatic factors at different growth stages (Fig.6). The relative humidity at the first two stages mainly had a decease trend,while increased at the last two stages in the central regions of the NCP. At the same time,both sunshine hours and wind speed showed decrease trends at all growth stages. Opposite to sunshine hours and wind speed,the mean temperature at nearly 90% of the weather stations showed a notablely upward trend. Precipitation increased in the north regions of the NCP and decreased in the south at all growth stages.
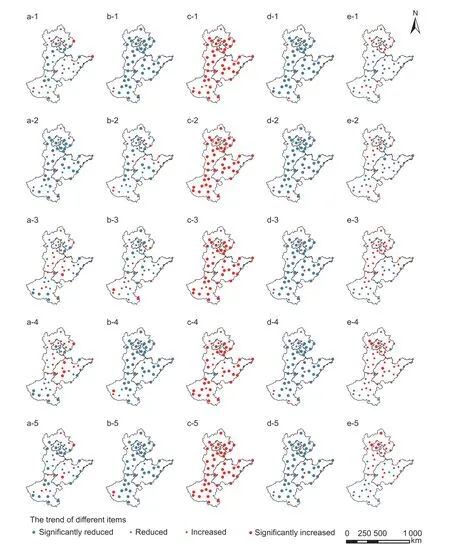
Fig.6 Spatial variations in relative humidity,sunshine hours,mean temperature,wind speed,and precipitation at different growth stages of winter wheat. The number 1-4 represent the four growth stages of sowing-returning green,returning green-jointing,jointing-heading,and heading-mature,respectively. The number 5 represents the whole growth stage of winter wheat. The letters a-e represent the factors of relative humidity,sunshine hours,mean temperature,wind speed,and precipitation.
3.4.The sensitivity of drought risk to different climatic factors
There were significant variations in the effects of different climatic factors on AI at different growth stages of winter wheat (Table 6). The sensitivity coefficients of precipitation and relative humidity were positive throughout the growth period,while the remaining three factors were negative.It indicated that the higher the precipitation and relative humidity,the higher the AI and the lower the drought risk,while temperature,sunshine hours and wind speed showed the opposite effects.

Table 5 Average values of climatic factors and their correlation coefficients with aridity index

Table 6 Sensitivity coefficients of aridity index to various climatic factors at different growth stages
By comparing the absolute values of different sensitivity coefficients,it was found that AI was most sensitive to the change of precipitation,followed by relative humidity,mean temperature,wind speed,and sunshine hours. The sensitivity coefficients of other climatic factors varied at different stages. Therefore,irrigation should be supplemented according to the precipitation and water deficit conditions at different growth periods,so as to reduce the occurrence of drought. In addition to precipitation,the absolute value of the relative humidity at the sowingreturning green stage was 1.00,followed by wind speed and temperature. Among the three factors with negative effects,the sensitivity coefficient of temperature was the highest,followed by wind speed and sunshine hours. With climate change over the past six decades,temperature during the growth period of winter wheat has increased significantly,which increased its water consumption and drought risk.
The sensitivity analysis was further divided into five groups based on the quintile of different climatic factors,which provided a clearer insight into how sensitive AI would become as climatic factors change in the future (Fig.7). There was no significant distinction among different quintiles of climatic factors such as precipitation and wind speed. The results confirmed that the effect of climate warming on drought risk becomes more dominant in the higher temperature divisions. The regions with higher relative humidity will be more prone to drought risk driven by decreasing relative humidity. Sunshine hours in the northern NCP were relatively high with a decrease trend,which indicated that a possible increasing drought risk in this region will be offset by a decrease in sunshine hours.
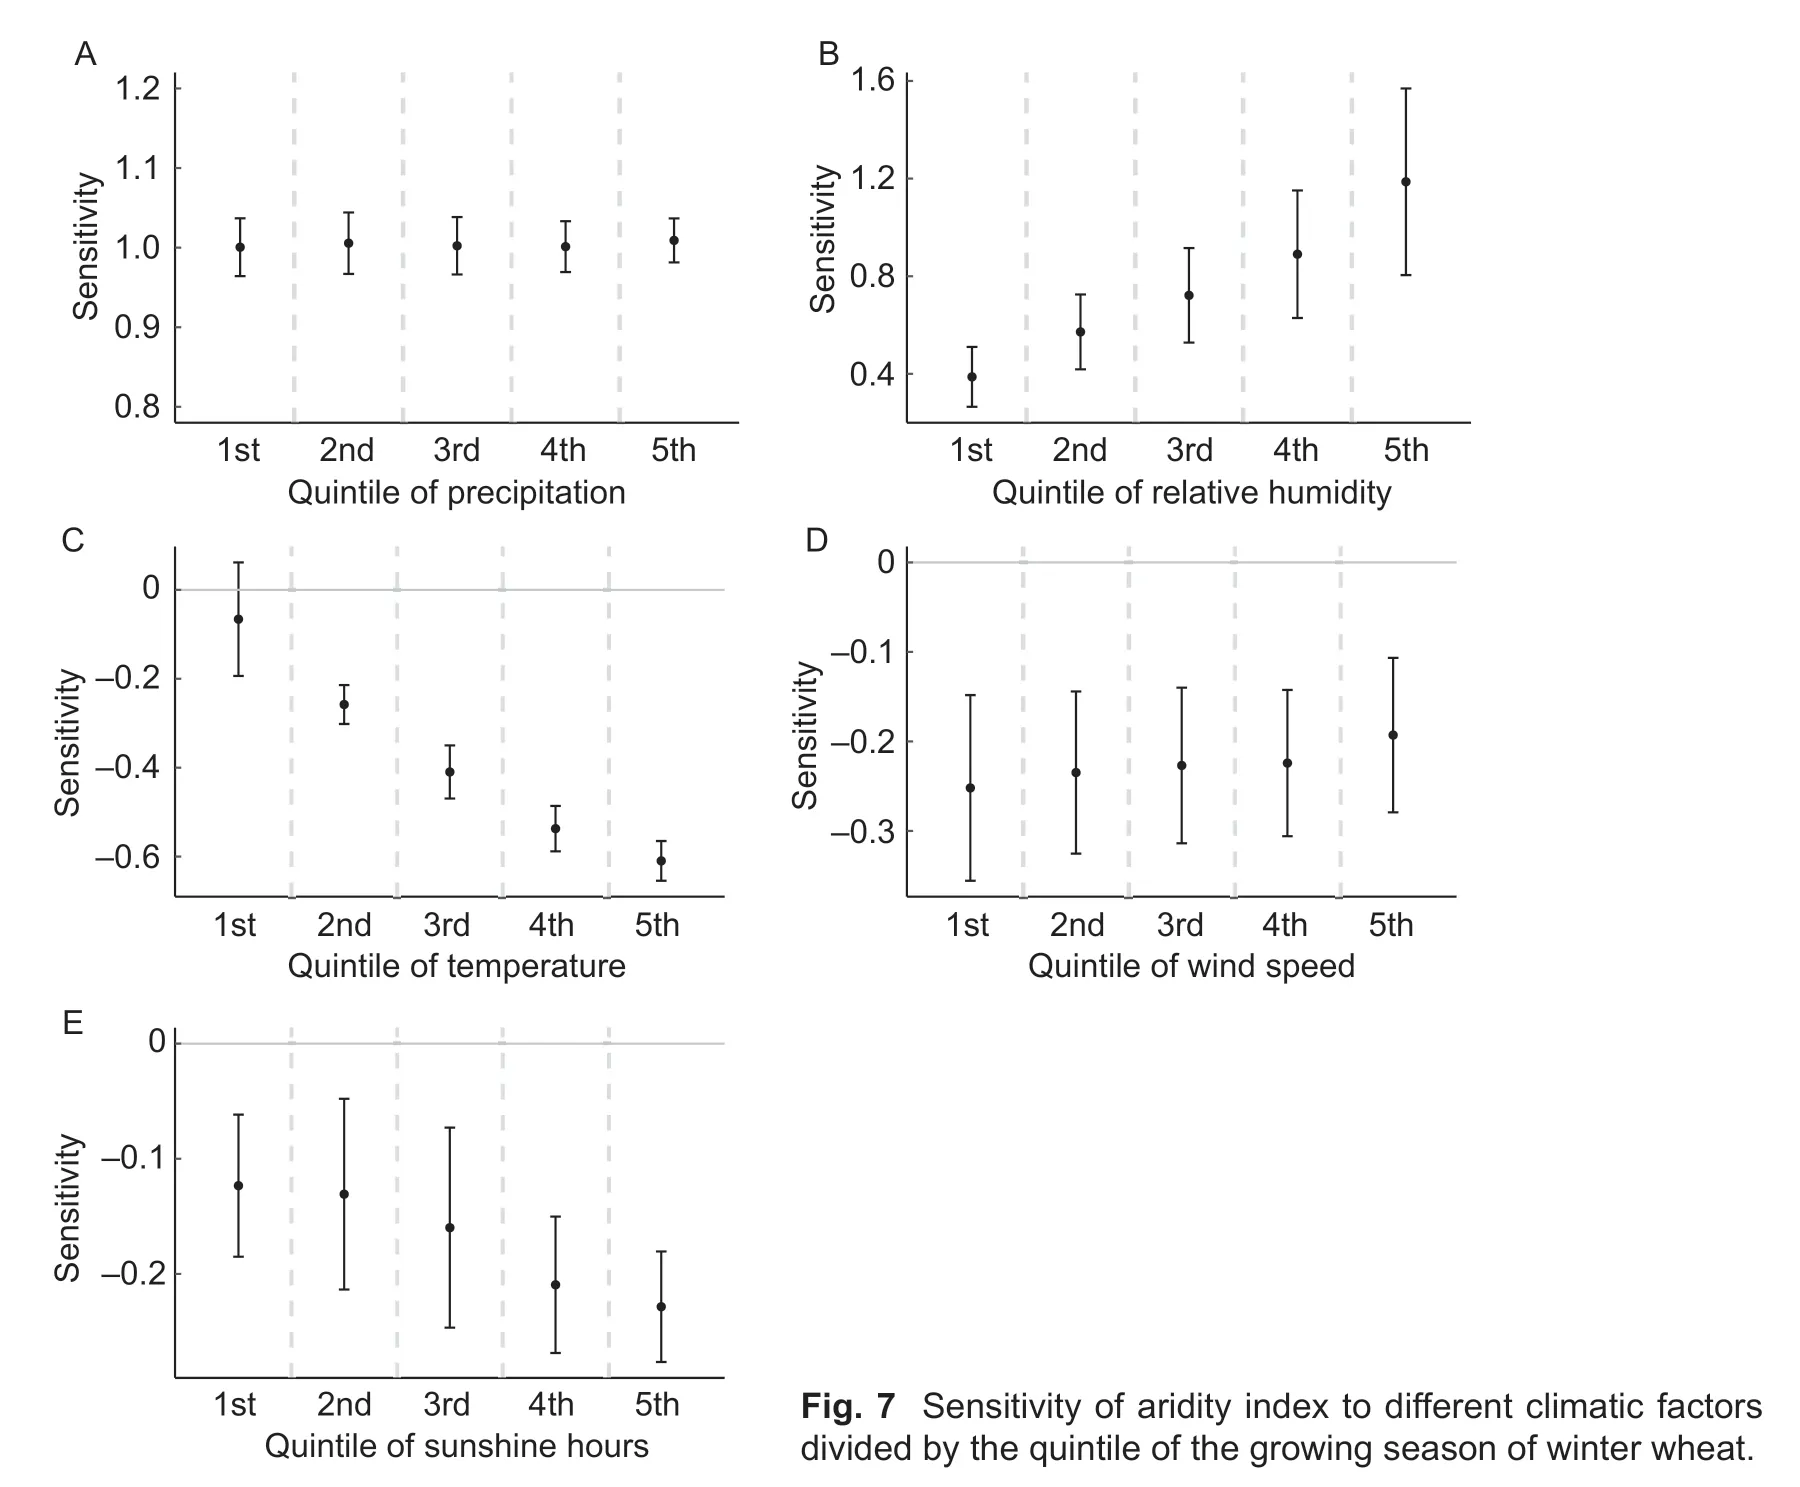
Fig.7 Sensitivity of aridity index to different climatic factors divided by the quintile of the growing season of winter wheat.
4.Discussion
In this study,AI was used to quantitatively evaluate the drought risk of winter wheat at different growth stages and regions in the NCP. This study analyzed the historical changes in various climatic factors including precipitation,temperature,humidity,wind speed,and their differentiated effects on the drought risk of winter wheat at different growth stages. The key climatic factors affecting the water deficit and drought risk of winter wheat were identified.
4.1.The drought risk of winter wheat
Winter wheat was exposed to severe drought risk during its growth period. Insufficient precipitation and high temperature during key periods of yield formation such as the jointing-mature stage had led to a significant increase in water demand of winter wheat,resulting in serious water deficit and drought risk. Some related studies showed that the water deficit of winter wheat in the NCP was serious,and the jointing-heading and heading-mature stages were key to determine the grain weight of winter wheat (Yaoet al.2019). As a result,drought occurring during these two stages severely reduced the yield of winter wheat. In termsof the spatial pattern of drought risk,this study found that winter wheat suffered from more serious drought risk in the northern region of the NCP. Previous studies evaluating the drought risk of winter wheat in the NCP using SPEI or other indicators obtained similar conclusions to the present study (Wanget al.2016). Of course,there were differences in the classification of crop growth stages and the thresholds of drought severity grades among studies.
4.2.The influencing factors of drought
Drought is driven by both precipitation and potential evapotranspiration (Zarchet al.2015). Prior studies have noted the importance of precipitation and potential evapotranspiration,yet most studies have focused on their effect on crop production and their driving factors (McVicaret al.2012;Chenet al.2013;Liet al.2015). Results of the present study confirmed that sunshine hours and wind speed,in addition to temperature,also had great impacts on evapotranspiration (Xuet al.2006;McVicaret al.2012;Huoet al.2013). The sensitivity analysis of AI in this paper indicated that in addition to the precipitation and relative humidity,temperature was a key influencing factor that determine the intensity of drought risk. Previous studies showed that temperature in the NCP had increased significantly over the past few decades,and the relative humidity and average wind speed were generally decreasing at the growth stages of winter wheat (Zhanget al.2015;Fanet al.2016). The results of main influencing factors of AI in this study were basically consistent with the conclusions of relevant literatures. Of course,some differences exist due to the differentiations in geographical environment,as well as the spatial and temporal scales. In the future,it is necessary to analyze the drought risk variations in different crop varieties and cropping systems,in order to provide more reasonable approaches to reduce exposures to drought risk of crop production.
4.3.Study limitations
Due to the difficulty of obtaining the actual soil conditions in such a big region of the NCP (with an area of about 300 000 km2),this study did not consider the influences of different soil types on soil moisture and crop drought (Seidelet al.2019),which need to be completed in the future research. Although precipitation in September affects soil moisture,considering that farmland in the NCP is usually fully irrigated before winter wheat is sown in order to ensure its seedling emergence rate,the impact of precipitation before sowing can be ignored to some extent. In addition,AI mainly considers the drought conditions during the crop growth stage,but does not take into account precipitation outside the growth stage. Further studies may adopt some other indicators such as crop water deficit index (CWDI) (Gaoet al.2019) to overcome this shortcoming and provide a more comprehensive reference for regional agricultural water management.
5.Conclusion
During the whole growth period of winter wheat,precipitation cannot meet its water demand (with totally 350 mm of water deficit),especially at the jointing-heading and headingmature stages. The growth season of winter wheat was dominated by different degrees of drought,especially at the middle-late stages that are critical to crop yield formation. The degree of water deficit and drought risk of winter wheat were affected by multiple climatic factors including precipitation,temperature,humidity,and other factors.Despite precipitation playing a vital role in determining the severity of drought risk,high temperature and low humidity along with other climatic factors at the key growth stages of winter wheat aggravated drought risk. Over the past six decades,regional temperature showed a significantly upward trend,which increased the water demand and drought risk of winter wheat.
There are large spatial and temporal variations in drought risk and climatic factors at different growth stages of winter wheat. AI in the northern part of the NCP was high,which meant that winter wheat located in this area was exposed to more serious drought risk. Despite the fact that winter wheat in the southern NCP suffered from lower drought risk than in the northern NCP,drought risk showed an increasing trend in recent decades. Temperature at nearly 90% of the weather stations showed a notably upward trend over the past few decades,which exacerbates the water deficit and drought risk of winter wheat. The results also showed that the regions or growth stages with higher sunshine hours and wind speed and lower relative humidity would be more sensitive to drought risk. Effective adaptation strategies,such as appropriate irrigation according to the drought conditions of winter wheat at different growth stages,should be undertaken to mitigate the adverse impacts of climate change and drought risk on regional water resources and food security.
Acknowledgements
This research was funded by the National Natural Science Foundation of China (31801315,72061147001 and 31871581),the National Key Research and Development Program of China (2016YFD0300201),the Major Projects of the National Social Science Foundation of China (18ZDA074),and the Chinese Universities Scientific Fund (2019TC015).
Declaration of competing interest
The authors declare that they have no conflict of interest.
杂志排行
Journal of Integrative Agriculture的其它文章
- Assessing the impact of non-governmental organization’s extension programs on sustainable cocoa production and household income in Ghana
- Triple bottom-line consideration of sustainable plant disease management:From economic,sociological and ecological perspectives
- A rice geranylgeranyl reductase is essential for chloroplast development
- Rapid determination of leaf water content for monitoring waterlogging in winter wheat based on hyperspectral parameters
- Does nitrogen application rate affect the moisture content of corn grains?
- Effects of drought stress on root morphology and spatial distribution of soybean and adzuki bean
