Using agent-based simulation to assess disease prevention measures during pandemics∗
2021-09-28YunheTong童蕴贺ChristopherKingandYanghuiHu胡杨慧
Yunhe Tong(童蕴贺),Christopher King,†,and Yanghui Hu(胡杨慧)
1Department of Engineering Mathematics,University of Bristol,Bristol BS8 1UB,UK
2State Key Laboratory of Fire Science,University of Science and Technology of China,Hefei 230027,China
Keywords:pedestrian dynamics,occupant exposure,COVID-19,simulation study
1.Introduction
With the rapid spread of COVID-19 around the world,the World Health Organization(WHO)declared a pandemic.[1]It has fundamentally altered the daily activities of humans all over the world.Governing bodies recognize that intervening strategies are needed to reduce the spread of COVID-19 and so reduce its impact on human health.[2]These measures include banning mass gatherings,introducing social distancing,where people must remain a fixed distance apart,and one-way systems in spaces with high footfalls.These restrictions could be present for months or years to come,[3]so it is worthwhile to attempt to model and quantify the transmission risk of people when they make necessary trips and expose them to other people.
Modelling epidemiological transmission is crucial to understand the transmission dynamics of the pandemic and provide insights into the design of alternative interventions.[4]In previous work,the susceptible-infected-removed(SIR)model has been used widely to predict the spread of infectious diseases in humans.[5]In this model,people are categorized by S,I,or R(susceptible,infectious,or removed)states and can move between these states.SIR model and its extended modifications have been used to estimate disease spread at large scales.[6,7]However,these models do not explicitly consider the day-to-day interactions between people at smaller scales,such as in buildings.
Understanding pedestrian dynamics is essential for studying disease transmission within buildings and has been extensively investigated through statistical modelling and simulation.These models can represent realistic pedestrian behaviors and are generally distinguished into macroscopic and microscopic ones.Macroscopic models generate the bulk properties of groups of pedestrians,such as flows and densities,without considering individuals,[8]and cannot be readily used for studying disease transmission.In contrast,microscopic models consider each pedestrian as a self-driven agent which has simple rules for interacting with both the environment and other agents,and aggregating these behaviors over large numbers of agents can lead to interesting collective phenomena.Cellular automata,[9,10]floor field models,[11]and force-based models[12]are common examples of these kinds of models.
Exposure risk of pedestrians to most diseases in a confined space largely depends on the local interactions between other,potentially infected,pedestrians.Much empirical research has been done to enhance the understanding of interactions.[13–15]In force-based models,interactions of a pedestrian with both others and the environment can be thought of as attractive or repulsive forces acting on said pedestrian.[16,17]For example,a pedestrian is assumed to keep a certain distance from others(personal space),if someone enters this space,the pedestrian will try to move away to maintain their personal space.[18]Alternatively,there are some cases where pedestrians will stay close to others,for example,traveling with relatives or friends,or following guides.[19]
While previous research has carefully studied pedestrian dynamics in various contexts,little is known about the influences of pedestrian behaviors on the spread of disease,especially in supermarkets,where everyone must visit to buy food.This is one of the essential activities which puts people at greater risk of contracting disease,due to being around others in a confined space.To try to reduce this risk,supermarkets have taken measures such as limiting the maximum number of occupants,introducing directional floor markings and signs to create one-way movement around the store(oneway system),and asking customers to maintain social distance from others.[20]Recently,the“exposed”model has been developed to assess the exposure risk of individuals in confined spaces during pandemics.[21]This model is designed to be used in tandem with microscopic pedestrian dynamics models to investigate different types of disease transmission.The effect of some preventative measures taken in supermarkets,including restricting the number of customers,keeping social distance,and entering with a shopping cart on the average contact degree of each person,has been investigated through simulation.[22]However,these restrictions may increase the amount of time people spend in supermarkets and thus increase their exposure time.So,it is essential to investigate the risk-efficiency trade-off to find the optimal strategy for the shopper.
In this contribution,we employ a force-based model to implement preventative measures seen during this pandemic,such as social distancing.We focus on the influence of these measures in supermarkets on the exposure risk of customers.Specifically,we investigate the trade-off between exposure risk and the shopping time to develop the optimal shopping strategy when such protective measures are in place.
There are two main aspects of innovation in this work.First,we develop a simulator that can illustrate disease transmission and pedestrian movement dynamics.It can generate data to assess a variety of metrics regarding strategies to limit the spread of disease and/or optimize pedestrian flow.The other is to establish a model that can evaluate the impact of different disease-prevention measures on customer shopping efficiency and infection risk simultaneously and determine which are the most suitable,given a user’s set of priorities.
Compared with previous studies,the method we proposed considers how a manager of a supermarket may optimize their store in order to comply with local restrictions while maximizing store turnover.This work also compares shopping strategies that maybe used by customers and determines which has the maximum reduction in exposure risk.More importantly,our model can allow supermarket managers to adjust the weighting of risk and efficiency according to their needs.In addition,this framework allows for the inclusion of empirical data to calibrate the model.
In the following,we first present an integrated simulation for shopper movements(Subsection 2.1)and choice behavior in a supermarket(Subsection 2.2).We then describe the exposed model and how we use it to assess a shopper’s exposure risk(Subsection 2.3).Using this framework,a simulation study(Subsection 3.1)is conducted,implementing different restrictions,including social distance and one-way systems,along with different shopping habits(Subsection 3.2).Results from this study are presented,examining the tradeoff between customers’exposure risk and shopping efficiency(Subsection 4)for the different scenarios.Finally,we assess the implications of these results on shopping behavior during the current pandemic(Subsection 5).
2.Model
We develop an integrated model to study pedestrian movements and shopping behavior in a supermarket.Specifically,we employ a modified force-based model that can vary the social distance between pedestrians to simulate current restrictions(Subsection 2.1).A simple destination choice model is used to govern the activities that shoppers perform(Subsection 2.2).In addition,the exposed model[21]is used to assess the exposure risk of pedestrians over the course of their shopping trip(Subsection 2.3).
2.1.Force-based model with social distance

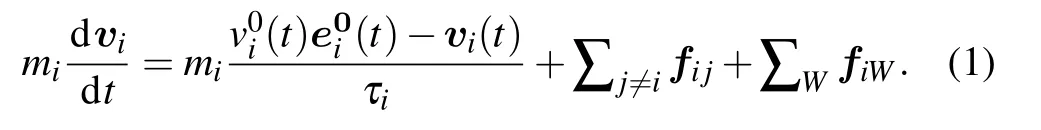
Assuming that each person can be represented by a circle of given radius,the repulsive interaction between two people,i and j,is given by
The interaction of person i with the wall W is treated analogously as

where riis the radius of i,diWis the distance between the center of i to the closest point of the boundary of an obstacle,W.niWis the normalized vector acting perpendicularly to diW,and tiWis the vector acting tangentially to diW(perpendicular to niW).
We use the minimum distance rij−dijto represent the social distance between people.Birepresents the effective length scale over which the interpersonal repulsive force takes effect,such that increasing Biincreases the effective distance between people.To calculate the value of Binecessary for rij−dijto be a specific social distance between two people,i and j,we use the following relation:

where|vi(t)|is the magnitude of vi(t).Aiand Biare the same as that in Eq.(2).This assumes that the distances from person i to all other people(that are not j)and to all obstacles are much greater than dij,so that their contributions to fijin Eq.(1)are negligible.
2.2.Pedestrian shopping behavior
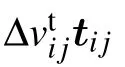
In this simulator,each agent is assigned a set of activities to perform in the supermarket.Each activity can be performed at only one destination in this work,though this need not be the case in general.Based on this schedule of activities,the probability of choosing which activity to perform/destination to visit next is computed using a multinomial logit discrete choice model[23]specified as follows:
where Psis the probability of an agent choosing destination s,βdis the desirability parameter,and H is the normalization constant which ensures that the sum of choice probabilities over all destinations is unity.dsis the desirability of s,and is determined by the position of the activity associated with s in the activity schedule of the agent,such that
where a is the position of the activity in the agent’s current schedule.For example,consider a scenario where an agent can choose from one of four destinations,and each has an activity labeled A–D,sequentially.If an agent has the schedule‘A,B,C,D’,then d1=e−1,d2=e−2,d3=e−3,d4=e−4.In this work,an agent’s next destination depends exclusively on its activity schedule,where the destination most likely to be visited is the one with the next activity.To ensure that agents almost always perform the next activity in their schedule,we setβd=20.
3.Simulations
3.1.Simulator description
This section describes the agent-based simulator used in this study,which was written in Java.The simulator can be used to look at both movement and choice behavior of pedestrians in public spaces and is based on the simulator used in Bode and Codling.[26]There is a video showing the simulator in action in the supplementary materials.

When agents reach a destination,they spend a short amount of time there,mimicking browsing or purchasing behavior.This shopping time,tsis sampled from a shifted exponential distribution,
where t is the time measured in simulation time-steps(0.05 s),and t0andλare parameters such that t0=5 s andλ=0.01.t0controls the minimum possible waiting time at a destination andλcontrols the spread of possible waiting times.The values of t0andλwere chosen to produce a distribution of waiting times that are reasonable and intuitive.Once they have spent tstimesteps at the destination,they then select their next destination using the model described in Eq.(5).Their activity schedule is updated to remove the associated activity.They do this for each activity in their schedule until it is empty.At this point,the agent’s next destination is the exit,where they then leave the simulation.
The simulator takes the following of inputs:
•the layout of the environment,
•the total number of agents,
•the total number of time steps to run the simulation for,
•the values of any choice model parameters,
•the length of the activity schedule for all agents.
The different supermarket environments used in this study are shown in Fig.1.There are 12 destinations where each has one unique activity that can be performed(so there are 12 activities with only one place to perform each of them).For this study,agents are added at the entrance and initially prescribed a set of randomly allocated activities to perform.The activities are then sorted in order of increasing distance from the entrance to their associated destination.This is done to prevent agents from doubling back in the one-way system scenarios and represents the real-life tendency for supermarket shoppers to visit places closest to the supermarket entrance first.[27]The total size of the simulated spaces is 20×20 m2and,to replicate the capacity constraints imposed during a pandemic,a maximum of 20 agents are allowed in the spaces at any time,corresponding to an average density of 0.05 agents/m2.When there are fewer than 20 agents in the simulation,the simulator places new agents at the entrance,if no other agents are too close(i.e.,beyond social distance).
The Aiand Bifrom Eq.(1)are fixed across all agents,with Ai=2000 andτi=0.5 s,as originally specified by Helbing et al.[12]Social distancing is implemented by changing the Biparameter(see Subsection 2.1).Under normal conditions,we use Bi=0.08,[12]and using Eq.(4),Bi≈0.15 for 1 m social distancing,and Bi≈0.4 for 2 m social distancing.However,due to the limitations in the simulator,Bicould not be increased above 0.2,so a social distance of 2 m was not possible,and instead we used Bi≈0.2,corresponding to a social distance of 1.2 m.This is smaller than the recommended social distances[28]but should be sufficient to establish general relationships between social distance with both exposure risk and shopping efficiency.For each scenario,the simulation is run for 1-hour of simulated time(72000 time steps at 0.05 s per time step)and repeated ten times.The average exposure risk and shopping efficiency over the 10 replicates is reported.The simulator outputs the positions and directions of each entity at each time step along with whether the agent has left the simulation.
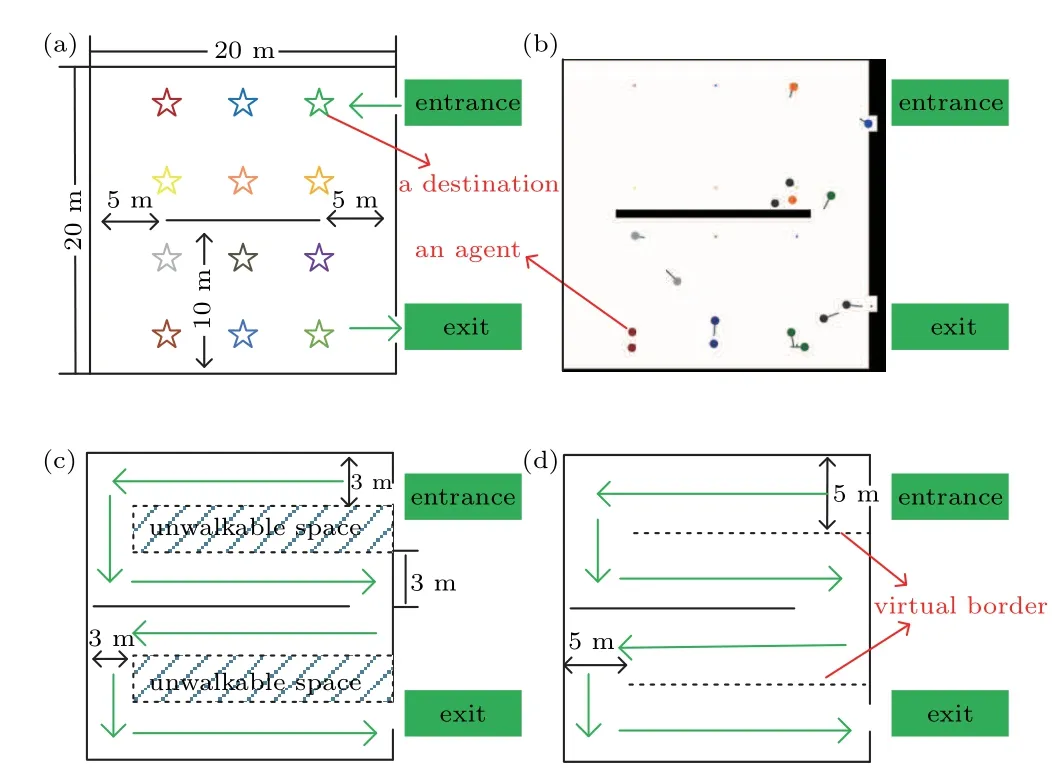
Fig.1.Destination layout of the supermarket(a)and three environments used in the simulations:the supermarket where agents can move freely(b),the one-way system with narrow passages(c),and one-way with wide passages(d).Each agent enters the supermarket through the entrance and then begins to visit each destination in the assigned schedule.Once their schedule is complete,each person heads toward the exit and are removed from the simulation.The colored stars represent destinations agents may visit.Each agent is represented as a circle colored according to which destination they are heading towards.The line indicates their current direction,and the length of it represents their current speed.
3.2.Different scenarios
Several different strategies/scenarios are investigated,looking at both a person’s exposure to others and how quickly they can complete their shopping trip.The different strategies considered are shown in Table 1.Firstly,there is the prepandemic shopping situation,where agents can move around supermarkets freely and do not need to observe social distancing.This“free-for-all with no social distancing”is our base case to which all other scenarios are compared.To look at the effect of social distancing on exposure and shopping efficiency,a scenario where agents can still move freely but observe social distancing(free-for-all with social distancing)is included.To investigate this further,two additional scenarios are defined,where the social distancing is 1 m or above 1 m,as commonly described in government guidance.[5]
Customers often adopt two different strategies when shopping,both before and during the pandemic,where some shop frequently(e.g.,maybe every 2–3 days),but only shop for a small amount of time/buy only a few items,and others may shop relatively infrequently(e.g.,maybe once a week),but spend more time in the store/buy more items.To assess whether one of these strategies is better for people who are more concerned with minimizing their exposure or maximizing their shopping efficiency,these two strategies are included.These different shopping strategies are represented using the length of agent’s activity schedule as a proxy.
In some supermarket chains,one-way systems are in place in an attempt to minimize the exposure risk of customers.[20]To test this idea,one-way versions of the freefor-all supermarket environment are created by placing artificial barriers to force entities to move along a prescribed route from the entrance to exit.One has wide walkways,where agents can pass each other,and the other has narrow walkways where they cannot.As mentioned in Subsection 3.1,to ensure that agents obey the one-way system,their schedules are ordered in terms of the distance of the destination associated with that activity from the entrance.The social distance for the scenarios is above 1 m,and each agent visits 5 different destinations in the scenarios unless otherwise specified.
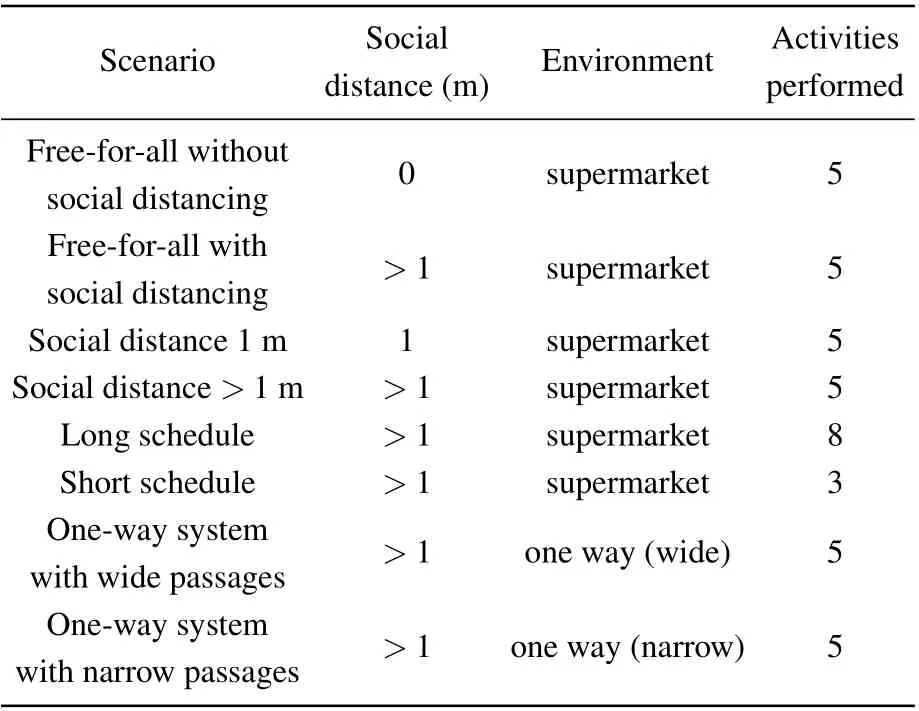
Table 1.Summary of the different scenarios.
3.3.Scenario metrics
COVID-19 can be transmitted in several ways,such as airborne and physical contact.[24]The EXPOSED model[21]allows for several types of disease transmission.When considering exposure by physical contact(the distance of two agents is smaller than two times of body radius)in this simulator,it is almost impossible for two agents to touch one another.This is due to the values of Bineeded to implement social distancing(see Subsection 2.1)and the small number of agents present at any one time(see Subsection 3.1).We consider exposure to others within some distance(here we use d≥1 m),with an additional face-to-face exposure if agents are facing each other within the social distance,defined by a fixed angle of contact(<120°)between the current directions of agents.Therefore,we assess two kinds of exposure:social distance and face-toface contact disease transmission in this work.
We use the global assessment of exposure G defined as in the exposed model below:[21]
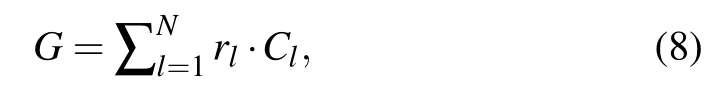
where l is the number of people an agent is exposed to during a simulation,N is the maximum number of agents to which an agent is exposed,and rlis the risk degree.In this paper,we assume that the risk degree is equal to the number of people an agent is exposed to,i.e.,r1=1 means that an agent is exposed to 1 agent,r2=2 means that an agent is exposed to 2 agents,and so on.Clis cumulative exposure time-steps to l people.According to the literature,[25]the exposure mass percentage at 0 m is 100%,that at 1 m is about 40%,and that at 2 m is about 30%.In our study,the exposed distance we used is 1 m both for social distance method and face-to-face method.We assume that a homogeneous distribution of air in the environment.So the weights of exposure of two methods are weighted equally.
The cumulative exposure time Clis defined below:

The exposure time of each agent i exposed to a given number of agents l is calculated as follows:
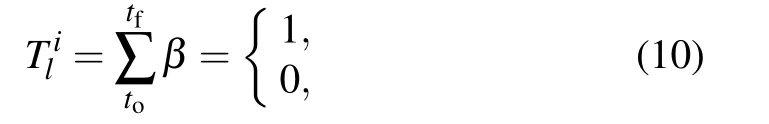
where to=1,tf=72000,i.e.,the total number of simulation time-step.When i is exposed to l agents,β=1,otherwise β=0.
Though preventative measures can reduce the spread of disease,they can also impact the time spent by people in shops.From the perspective of supermarket managers,the rate of throughput(number of people that enter and leave the store per hour)is a good measure of store turnover.Therefore,we define the shopping efficiency as the total number of distinct agents that appeared over the course of the simulation(i.e.,over the course of 1 hour)and then subtracting 20,the maximum occupancy in the simulations.This assumes that there are 20 agents at the last time-step that have not finished their shopping.To consider the fact that agents with shorter schedules will,on average,finish their shopping quicker than those with longer schedules,we standardize shopping efficiency by multiplying by the length of activity schedules in each scenario.Similarly,since the length of activities in eight scenarios is different,to make our exposure results comparable,we standardize G in Eq.(6)by dividing by the schedule length in each scenario.Thus,we get a global assessment of exposure per activity per hour and shopping efficiency as the total number of activities completed over all agents per hour.
4.Results
4.1.Effects of social distancing
We first establish how social distancing influences exposure risk and shopping efficiency.As shown in Fig.2(a),the total exposure due to agents being within social distance decreases as the social distance between agents increases.The exposure due to face-to-face contact also decreases when social distance is enforced.However,it does not make a big difference when the social distance is 1 m and above 1 m.This implies that,in this case,if a disease is primarily transmitted through face-to-face contact,then only relatively small social distances need to be implemented.Despite having no empirical validation,our results show that keeping social distancing is an effective way to reduce costumers’exposure during a pandemic in supermarkets.
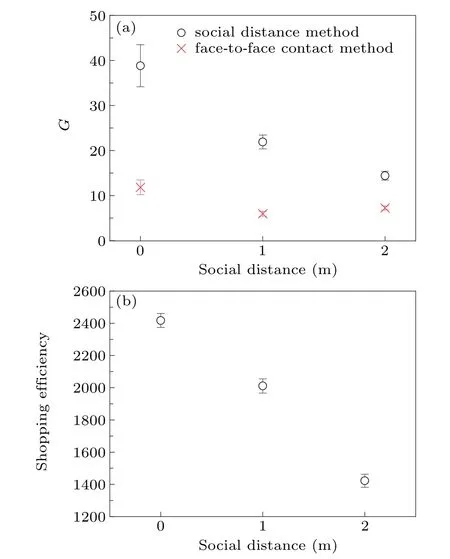
Fig.2.Average values over ten simulation replicates of the global assessment of exposure through social distance and face to face transmission(a)and shopping efficiency of people(b)with increasing social distance.Error bars represent one standard deviation from the average.
In terms of shopping efficiency(Fig.2(b)),it is obvious that as social distance increases,the agents’shopping efficiency significantly decreases,dropping about 40%when the social distance is above 1 m.One possible explanation for this is that keeping social distance impedes the natural movements of agents,as agents must wait until there is sufficient distance from others before moving or performing activities.
Our simulation results confirm the effectiveness of social distancing in reducing contact among customers and reveal the decrease in customers’shopping efficiency when implemented in supermarkets.
4.2.Effects of shopping strategy
Figure 3 shows the exposure and shopping efficiency of agents with different shopping strategies.When costumers have a longer shopping schedule,they have less exposure risk through both social distance and face-to-face contact.One possible reason for this might be that agents who have more activities to complete tend to stay longer in the supermarket and thus relatively reduce the maximum possible number of agents that enter the supermarket while they are present due to the occupancy constraint.The risk of exposure from adding more agents in the confined space might be greater than the risk of agents staying in the store for a long time.
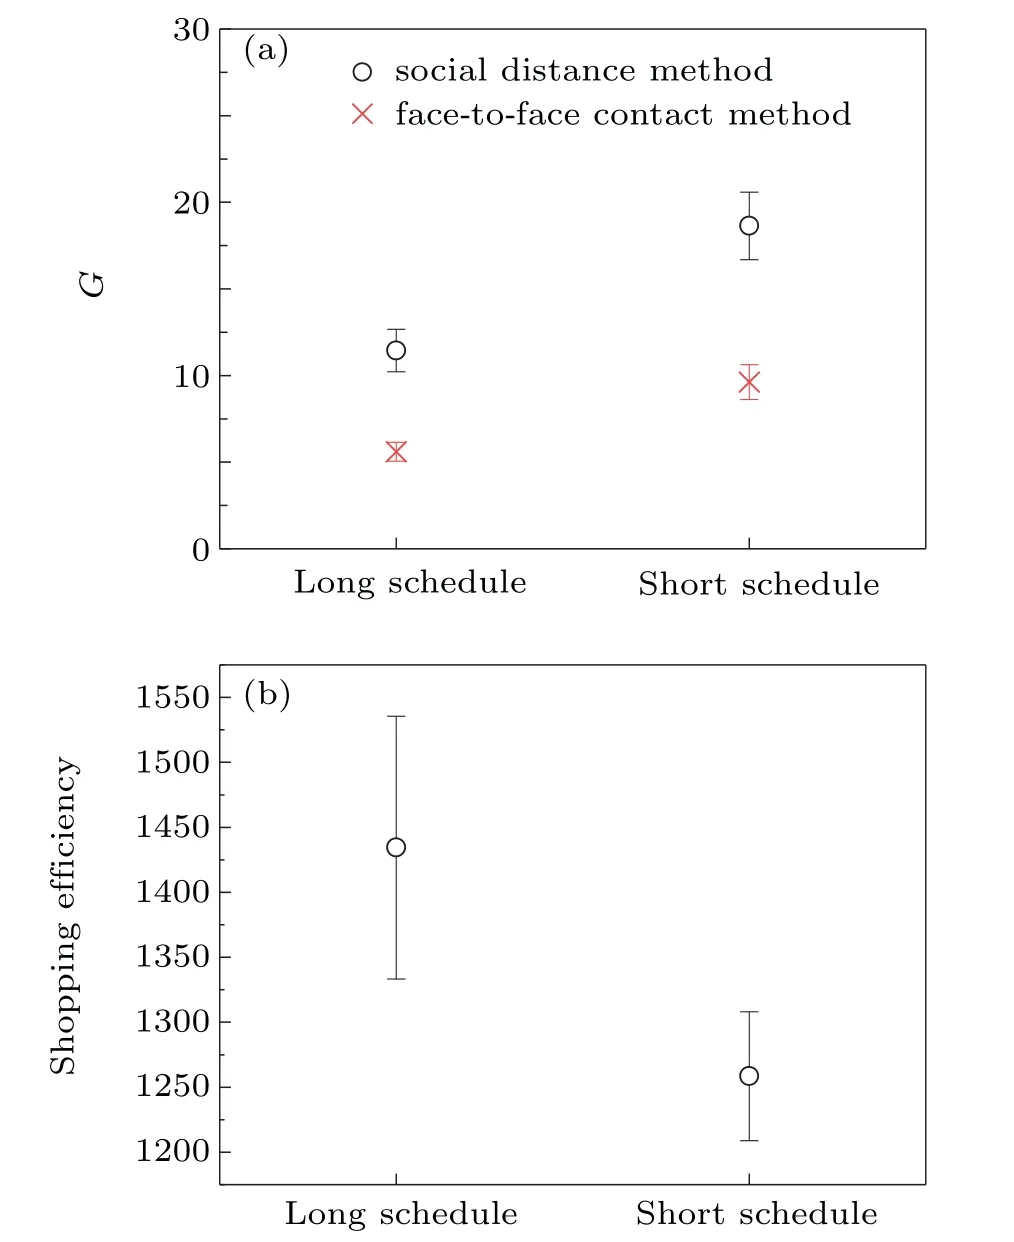
Fig.3.Average values over ten simulation replicates of the global assessment of exposure through social distance and face to face transmission(a)and shopping efficiency of people(b)when they have different shopping strategies,using schedule length as a proxy.Error bars represent one standard deviation from the average.
In terms of shopping efficiency(Fig.3(b)),agents with a longer schedule are more likely to have higher shopping efficiency.Shopping efficiency is defined as the total number of activities agents perform in a simulation.Compared to agents with a long schedule,the agents with a short schedule can quickly complete the required shopping activities,while spending roughly the same amount of time entering and leaving the store.Therefore,from a general perspective,agents with a short schedule tend to spend a larger proportion of time entering and leaving the supermarket than those with a long schedule,therefore making better use of their time.This finding indicates the shopping strategy of shopping infrequently but buying more items is better than shopping frequently for a few items both in terms of reducing the exposure and improving shopping efficiency.
4.3.Effects of one-way system
Figure 4 shows agents’exposure risk and shopping efficiency with narrow/wide or without a one-way system.It is found that when agents can move freely in the supermarket,they have the highest shopping efficiency and highest exposure risk.There is only one obstacle in the supermarket(see Fig.1),so in this situation,agents with random assigned shopping schedules can direct head for the destinations freely,without considering the influence of the one-way system.It can reduce the time each agent spends on reaching the destinations but increase the chance to contact other agents,leading to higher exposure risk.It is also clear that the exposure risk for both wide and narrow one-way systems is similar,so there is little added benefit from narrowing passages such that people cannot pass each other.
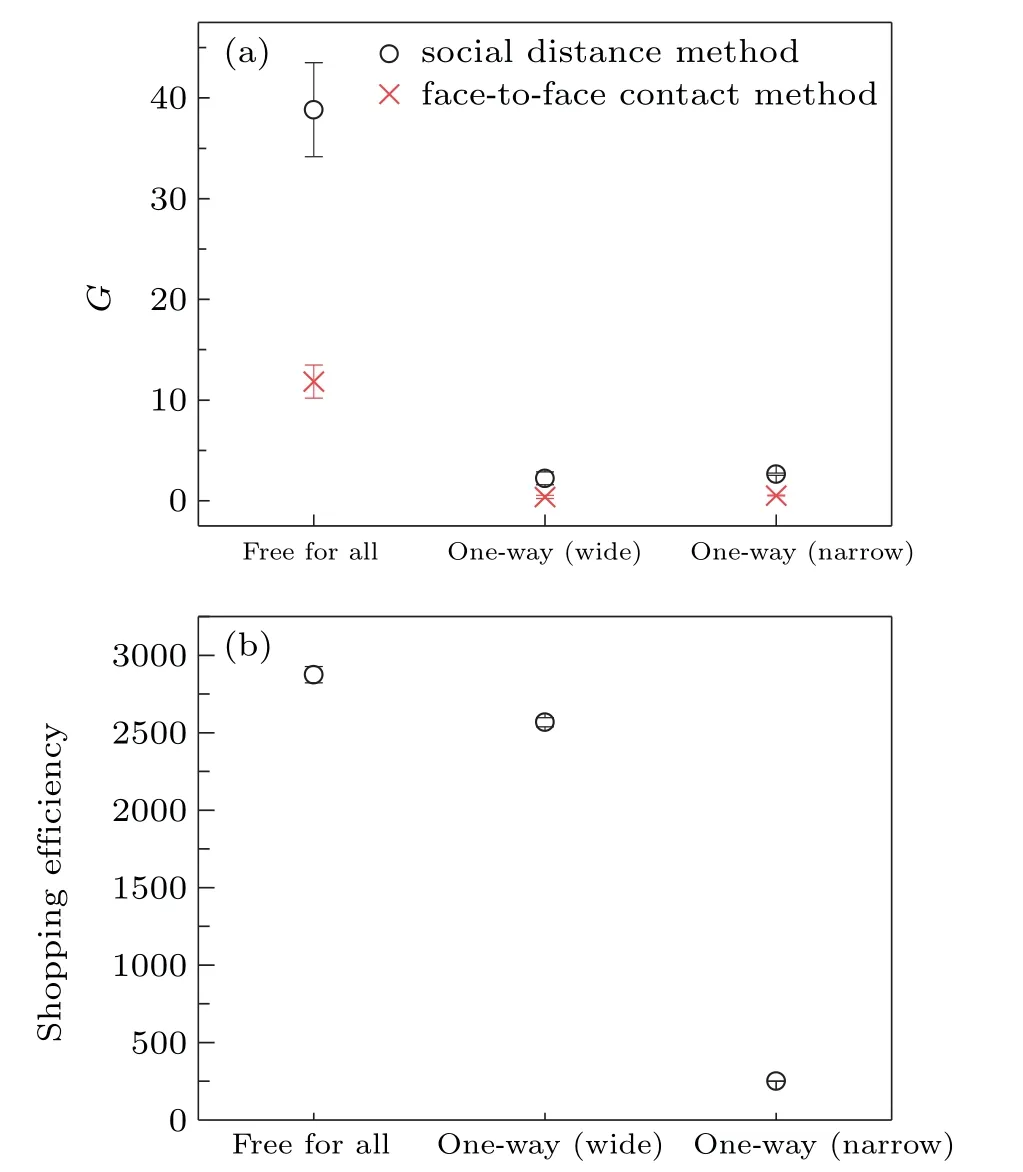
Fig.4.Average values over ten simulation replicates of the global assessment of exposure through social distance and face to face transmission(a)and shopping efficiency of people(b)both with and without a one-way system with either a wide or narrow passage.Free-for-all is a pre-pandemic shopping situation in which people can move around supermarkets freely.Error bars represent one standard deviation from the average.
In contrast,when the one-way system is implemented in the supermarket,shopping efficiency decreases,particularly when narrow passages are employed.As agent movements are restricted by the one-way system,they are only allowed to move along pre-designed routes,which are unlikely to be the optimal ones in terms of travel time between destinations.On average,each agent’s speed may significantly decrease,due to other agents blocking the way,particularly when narrow passageways are used.In this case,customers must wait until others complete their shopping activities before they can proceed further along the passageway.
Therefore,we confirm that the one-way system is effective in lowering the exposure risk of agents.In terms of the two kinds of the one-way system,both have similar exposure risks.However,the one-way system with wide passages only slightly decreases shopping efficiency compared to the prepandemic free-for-all scenario.So,the one-way system with wide passages is a good solution for supermarket managers in balancing infection risk while maintaining average throughput.
4.4.Trade-off between exposure risk and shopping efficiency
As discussed above,social distancing,a long shopping schedule,and a one-way system can all reduce the exposure of each agent to others.However,these measures reduce the shopping efficiency of agents of varying degrees.Therefore,it is worth developing a strategy that can take agents’exposure risk and shopping efficiency into consideration simultaneously.
In this work,we introduce a ranking R,which scores each scenario in terms of minimizing exposure risk while maximizing shopping efficiency.R is given by
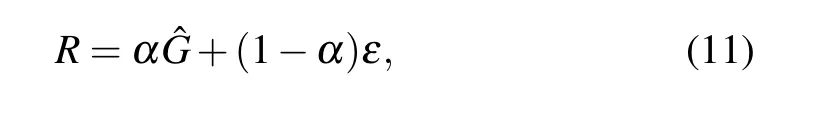
Figure 5 shows the ranking strategies according to the importance of exposure.The strategy with the highest R at any given value ofαis the optimal one in terms of balancing exposure risk with shopping efficiency.The wide one-way system is the best strategy,reducing exposure risk while maintaining shopping efficiency for all values ofα.This implies that implementing one-way systems with passageways wide enough for people to move past each other while obeying social distancing is the ideal strategy for supermarket managers,who would need to implement measures for reducing exposure without compromising store turnover.This is followed closely by the narrow one-way system,except forα=0,where freefor-all with no social distancing higher in rank.However,this assumes that all agents strictly obey the rule of the one-way system,and therefore shows the theoretical result if everyone always obeys the one-way system.As for social distancing,it depends on the customer’s motivation,for example,if a customer is more concerned about minimizing the risk of infection,then they should obey social distancing rules,with larger distances providing more safety.Of course,this assumes that everyone is always equally compliant with social distancing.Finally,customers should shop less frequently but buy more when they do,as the long schedule has both a lower exposure risk and higher shopping efficiency during a situation where social distancing restrictions are in place.
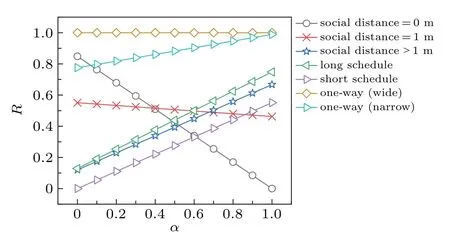
Fig.5.Ranking strategies as the weight of the exposure risk changes.The strategy with the highest ranking for a given exposure risk weighting is the optimal strategy for shoppers.
5.Discussion
This work aims to develop the optimal strategy for minimizing the exposure risk of people to disease while maximizing the shopping efficiency of customers in supermarkets during a pandemic.We propose an integrated agent-based simulator which can model both the decision behavior and movement of people.Agents make decisions on where to go next using a discrete choice model based only on their schedule of desired activities.Step-by-step locomotion is described by a force-based model.We implement social distance restrictions between agents by varying a parameter in the force-based model.A recent disease exposure model[21]is used to assess the exposure risk of shoppers in a supermarket environment.Two kinds of disease transmission are considered,based on known transmission routes of COVID-19:[24]social distance and face-to-face contact.
We use our simulator to investigate several measures taken to slow down the spread of COVID-19 in supermarkets.These measures are social distancing(≥1 m),and one-way systems.However,these measures are likely to make it harder for shoppers to complete their shopping quickly,so the impact of these protective measures on shopping efficiency is also considered.We also investigate how shopping habits of customers impact their exposure risk,comparing the strategies where customers visit supermarkets less often but spend more time shopping,and the other where customers visit frequently but spend less time shopping.We rank these measures in terms of exposure risk and shopping efficiency to find the optimal shopping strategy during a pandemic.
Our results confirm previous work[22]that the following government and general health guidelines can reduce the exposure risk of people to disease at the cost of the speed and ease of shopping.This work shows that supermarket managers should adopt one-way systems as they lower customers’exposure risk while preserving turnover,if the passageways are wide enough to allow for customers to move past each other while obeying any other social distancing restrictions.Narrowing the passageways of a one-way system to prevent people passing each other does not decrease overall exposure but does decrease shopping efficiency,so one-way systems should be deployed in stores whose layouts allow for wide passageways.One-way systems could be particularly effective in places where the culture and attitude of people improve compliance to restrictions.For the customers interested in minimizing their exposure to disease,reducing the number of shopping trips but buying more is the optimal strategy,and provides a more efficient use of time,compared to short,frequent store visits.This could be particularly useful in places where people are less likely to obey restrictions,as concerned individuals can benefit from this strategy even if others do not follow disease-prevention measures.
We use simulations of our proposed model to illustrate the consequences of various measures taken by customers and supermarket managers in terms of exposure risk and shopping efficiency.Although we simplify the scenarios and only consider a few possible factors in disease transmission and customer behavior,we believe that it can achieve reasonable and intuitive results.However,further validation in more complex scenarios is still needed.
Although some of these results are intuitive,they show that even a simple pedestrian dynamic simulator shows great potential to provide decision-makers and business owners with helpful information to predict infection risks and customer turnover.Of course,there are several limitations to this work that could provide several avenues for future research.
These include potentially unrealistic assumptions about the behavior of shoppers,for example we assume that customers always obey restrictions all of the time,and that people choose their next destination based only on a pre-defined‘schedule’,whereas in reality,many factors could be important,such as distance traveled.Other behaviors could be included,such as impulse stops,which could be particularly disruptive for one-way systems and reduce their efficacy in both reducing exposure risk and shopping efficiency.The simulated environments could also be expanded to include areas such as checkouts and promotional stands,all of which could influence the amount of time spent in the supermarket and the extent of agent interactions.Perhaps using an environment based on the floorplan of a real supermarket would provide a more realistic setting.Validating these results with empirical data from current or previous pandemics would also be useful to do in the future.These are in addition to the limitations mentioned in previous sections.
Microscopic pedestrian dynamics simulations could provide reliable and accurate quantitative forecasts for disease transmission,average shopping times,and many other metrics of pedestrian behavior,not just for this current pandemic,but any similar events in the future.
Acknowledgment
We are very grateful to Dr Nikolai Bode,who helped guide and improve this project through many helpful discussions and ideas.
杂志排行

Chinese Physics B的其它文章
- Origin of anomalous enhancement of the absorption coefficient in a PN junction∗
- Protection of isolated and active regions in AlGaN/GaN HEMTs using selective laser annealing∗
- First-principles study of plasmons in doped graphene nanostructures∗
- Probing thermal properties of vanadium dioxide thin films by time-domain thermoreflectance without metal film∗
- An improved model of damage depth of shock-melted metal in microspall under triangular wave loading∗
- Signal-to-noise ratio of Raman signal measured by multichannel detectors∗