Thermoacoustic assessment of hematocrit changes in human forearms∗
2021-09-28XueWang王雪RuiZhao赵芮YiTongPeng彭亦童ZiHuiChi迟子惠ZhuZheng郑铸EnLi李恩LinHuang黄林andHuaBeiJiang蒋华北
Xue Wang(王雪),Rui Zhao(赵芮),Yi-Tong Peng(彭亦童),Zi-Hui Chi(迟子惠),Zhu Zheng(郑铸),En Li(李恩),Lin Huang(黄林),†,and Hua-Bei Jiang(蒋华北)
1School of Electronic Science and Engineering(National Exemplary School of Microelectronics),University of Electronic Science and Technology of China,Chengdu 611731,China
2Center for Information in Medicine,University of Electronic and Technology of China,Chengdu 611731,China
3Department of Medical Engineering,University of South Florida,Tampa FL33620,USA
4School of Optoelectronic Engineering,Chongqing University of Posts and Telecommunications,Chongqing 400065,China
Keywords:thermoacoustic imaging,hematocrit change,human forearm
1.Introduction
Microwave-induced thermoacoustic imaging(TAI)is an emerging noninvasive and nonionizing imaging modality,combining high contrast of microwave imaging and high resolution of ultrasound imaging.[1–7]When tissues are irradiated by microwave pulses,tissues with a higher dielectric loss absorb more energy and thus create stronger thermoacoustic(TA)waves than other tissues;this provides a high microwave contrast,and the TA waves are then ultrasonically detected in high resolution.[8]TAI has been thus far applied for various biomedical applications including detection of breast,[9–11]kidney,[12]prostate[13]cancers,imaging of joint,[3,14]brain[4,15,16],thyroid,[17]blood vessels,[18,19]and functional imaging.[19]
We have previously shown that blood vessels can be anatomically imaged by TAI.[16]However,the ability of TAI for imaging changes of blood content,like hematocrit(Hct)value,in blood vessels or other soft tissues such as muscle has not been documented,to the best of our knowledge.It is well-known that blood is a suspension composed of blood cells with low conductivity and plasma with high conductivity.[20,21]Hematocrit refers to the proportion of red blood cells(RBCs)in the volume of full blood.An increase in the Hct value is closely related to the reduced venous return,[22]increased blood viscosity,[23]and increased platelet adhesiveness.[24]Related studies have shown that subjects whose Hct value are higher than the normal range of the population,such as patients with primary or secondary polycythemia,are susceptible to arterial cardiovascular disease and venous thromboembolism.[25–29]Hct is also associated with an increased risk of pre-hypertension and all-cause death in the general population.[30,31]Therefore,monitoring the changes in the Hct value of blood can offer early insight into the occurrence of these diseases.
Manual microhematocrit method based on the visual counting of the blood cells[32]and the method based an automatic hematology analyzer[33]are the current tools used for Hct determination in clinics.While the former is the gold standard,the Hct value determined by this method is often overestimated due to the trap of plasma in erythrocytes.[34]It is time-consuming to remove the trap of plasma.The automatic method is considerably faster to complete the counting of blood cells;however,it cannot accurately detect specimens with distributional or morphological abnormalities.[35]Most importantly,both methods require blood samples taken from subjects for the in vitro measurement,and cannot be used for in vivo determination of changes of Hct values.[36–38]
Here,in this study,we demonstrate the ability of TAI to monitor changes in Hct both in vitro from the blood samples and in vivo from the blood vessels and muscle tissues in human forearms during vascular occlusion stimulation.
2.Materials and methods
2.1.System description
The TAI system used is schematically shown in Fig.1.A custom-designed 3 GHz magnetron generator(peak power:70 kW,pulse width:750 ns and repetition rate:50 Hz),coupled with a handheld dipole antenna(aperture size:60×60 mm2)[39]via a semi-rigid coaxial cable(1.5-meter-long with 1.2 dB insertion loss),was used as the excitation source.The TA signals were detected by a 128-element linear array transducer(8.5 MHz center frequency,SH7L38,SASET.Inc.,China),and then amplified by a home-made 128-channel amplifier and averaged for 50 times to achieve a good signaland-noise ratio by a 64-channel acquisition system with two 32-channel data acquisition cards(5752B,NI.Inc.,USA),requiring a data acquisition time of~2 s.For the TA image reconstruction,a back-projection algorithm in MATLAB was used.[40]A B-mode ultrasound imaging platform(iNSIGHT-37C,SASET.Inc.,China)was included in this system,which used the same 128-element linear array transducer,allowing the TA and ultrasound(US)images to be co-registered precisely.The purpose of US imaging was to allow the objects of interest(i.e.,the muscle,vein,and artery in the forearm)for TAI to be identified easily.For high-efficiency delivery of both the microwave and US signals,the forearm was completely immersed in mineral oil(Fig.1).According to our previous study,[39]the maximum average microwave power density at the surface of the handheld dipole antenna was 8.6 mW/cm2,when a 10 Hz repetition frequency was used.However,the microwave power density exciting the targets in this study was far below the surface power density as estimated above,and also below the IEEE standard for safety level(20 mW/cm2),[41]because the microwaves would spread out drastically due to diffraction.Specifically,it is known from Ref.[39]that the attenuation factor for the electric field propagation from the handheld dipole antenna was 1/r2.In this study,the distance between the target and the surface of the antenna was about 4 cm,and the coaxial cable had an insertion loss of 1.2 dB.Therefore,the maximum microwave energy density at the target surface was about 2.0 mW/cm2[8.6×10(−0.12)×(1/42)×5=2.0](in the case of 50 Hz repetition rate).
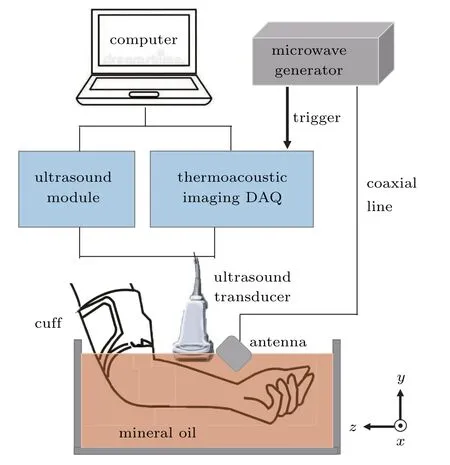
Fig.1.Schematic of the TAI and US systems.
2.2.In vitro blood samples
The study protocol for human subjects used in this research was approved by the Ethics Committee of the University of Electronic Science and Technology of China.All the subjects were healthy,and such statuses were verified by their medical history and physical examinations.
The in vitro blood samples of three healthy volunteers(A,B,and C;average age:24)were taken from the antecubital vein in the morning after an overnight fasting period and immediately loaded into vacuum blood collection tubes containing the anticoagulant EDTAK2.After being turned upside down slightly and mixed evenly,the plasma and RBCs were separated immediately by centrifuging for 15 minutes at 3000 rpm.Six blood samples with Hct values of 0%(plasma),20%,40%,60%,80%,and 100% were then configured using sterile pipettes for each subject.The electrical conductivity of the blood samples from the three subjects was measured at 2.4 GHz and room temperature 25°C with an openended coaxial resonant probe based on the method reported previously.[42,43]In addition,these blood samples were loaded into transparent plastic tubes(3 mm in diameter)and were imaged using the TAI system under the same experimental conditions.
2.3.In vivo vascular occlusion stimulation
A total of 7 healthy volunteers with an average age of 24 were recruited for the in vivo experiments.The radial artery,cephalic vein,and lateral brachioradialis of the left forearm were selected as the objects of interest and were imaged along the transverse plane with both TAI and US.
Once the forearm was placed in position,a vascular stimulation was then induced by pressing the upper arm with an air cuff above the elbow,aiming to change the Hct value in the blood vessels and muscle tissues by blocking the venous return/blood flow to varying degrees.[22]The stimulation consisted of five stages,as shown in Fig.2.First,the volunteer was at a resting state,and a baseline measurement was taken for 1 minute.Second,the pressure cuff was inflated to 80–100 mmHg to cause venous occlusion.The pressure was held for 1 minute and then released quickly.In the third stage,the subject rested for 1 minute.In the fourth phase,a 160–180 mmHg was applied to occlude the arm arteries.After 1 minute,the pressure was released.Finally,the subject was back to the resting state and imaged for 1 minute.The five-stage protocol was applied four times to each volunteer to ensure the repeatability of the experiment.In our experiments,the pressure varied according to the systolic blood pressure measured on the arm of each volunteer.During the imaging procedure,the subjects were constantly asked about if there were any unpleasant sensations.No adverse reactions were observed in this study.
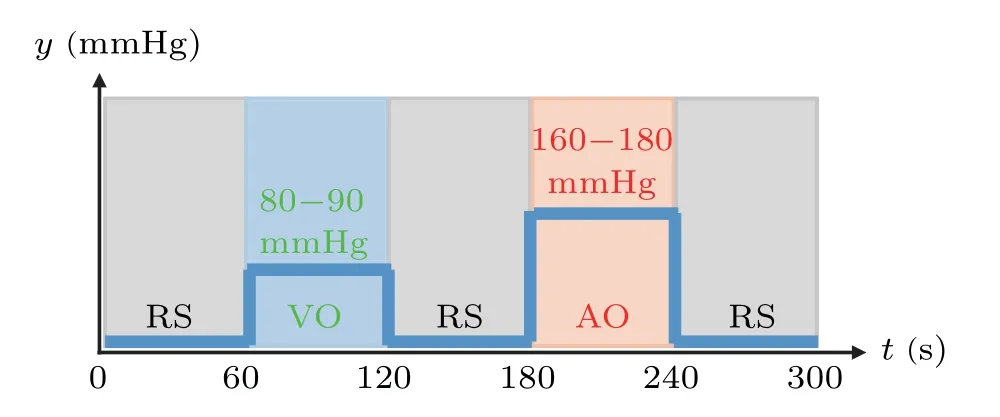
Fig.2.Five-stage stimulation protocol used for in vivo TAI.RS:resting state;VO:venous occlusion;AO:arterial occlusion.
3.Results
3.1.Conductivity and TAI for in vitro blood samples
Figure 3 shows the TA image and electrical conductivity obtained for the in vitro blood samples.In the TA image[Fig.3(a)],the area inside the tube was selected as the TA signal area(red circle),and an adjacent region at the same depth of the tube was selected as the background signal area(green frame).The image contrast was defined as the ratio of the average TA amplitude of the signal area to the average TA amplitude of the background area,and the selection of background region remained unchanged for all the samples.This contrast was used to represent the relative change of the TA signal in different blood samples for a constant background.Figure 3(b)shows the averaged contrast and electrical conductivity of the blood samples for volunteers A,B and C(each blood sample was measured for three times and the results shown were averaged using the three measurements).
From Fig.3(b),we can immediately see that the conductivity of the blood sample almost linearly decreases as the Hct value increases,which is consistent with the findings reported in the literatures.[20,21,44]The decreased electrical conductivity of blood sample results in a corresponding decrease in microwave absorption characteristics,and thus decreased contrast,i.e.,the contrast also linearly decreases with the increase of Hct value[Fig.3(b)].These results show that microwave absorption characteristics in the blood is different if the Hct value in the blood is different,enabling us to monitor the changes of Hct values in the blood using TAI.
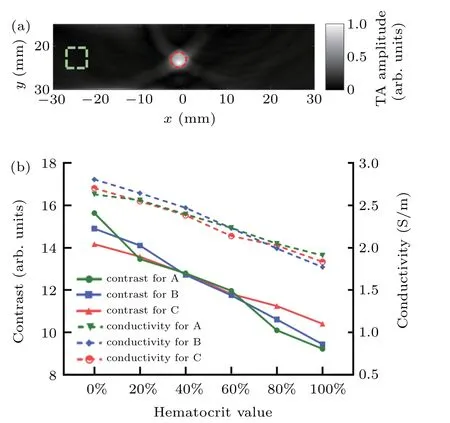
Fig.3.In vitro experiment using human venous blood with different hematocrit(Hct)values.(a)A representative TA image of blood-containing tube with 20%Hct.(b)Quantitative plots of in the blood contrast and conductivity vs.hematocrit value for the three volunteers(A,B,and C).The red circle and dashed green square in(a),respectively,represent the target and background regions that the TA signals were sampled area.
3.2.TAI monitor during in vivo vascular occlusion stimulation
Figure 4 shows the cross-sectional color Doppler US[Fig.4(a)]and TA[Fig.4(b)]images,and the overlaid TA/US image[Fig.4(c)]of the forearm for a representative volunteer at the resting state.By examining the overlaid TA/US image[Fig.4(c)],the objects of interest are clearly detected,i.e.,the positions of the radial artery and the cephalic vein(red and green circles,respectively),and the brachioradialis muscle(orange rectangle).In the TA image[Fig.4(b)],the full width at half maximum(FWHM)of TA signal along the red dotted line crossing the vein was estimated to be 4.1 mm as shown in Fig.4(d),which matches well with as a value of 4.0 mm measured by color Doppler US image for the diameter of the vein[white dotted line crossing the vein in Fig.4(a)].
Figure 5 shows the averaged TA signals(relative to a baseline measurement before the stimulation)over time in the radial artery,cephalic vein,and brachioradialis for all the seven volunteers during the five-stage stimulation,where the gray lines represent the TA signals for each volunteer,while the red,green and orange lines are the TA signals averaged over all seven volunteers with standard deviation(indicated with blue dotted lines)in the artery[Fig.5(a)],vein[Fig.5(b)]and muscle[Fig.5(c)],respectively.
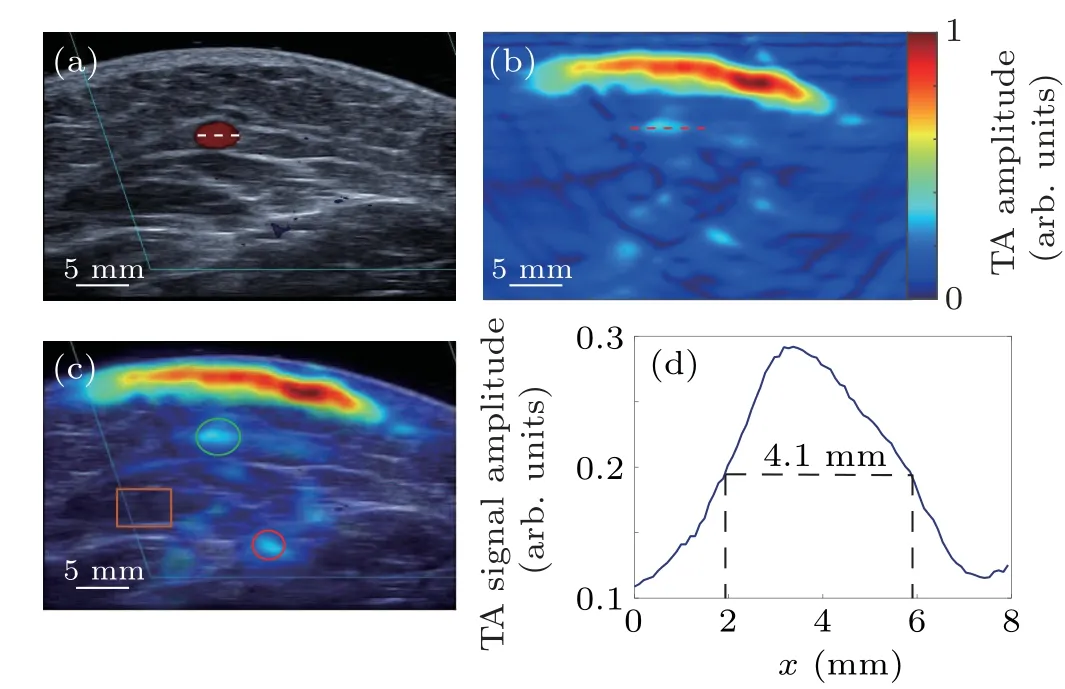
Fig.4.In vivo cross-sectional TA and US images of the left forearm for one of the seven volunteers.(a)the color Doppler US image;(b)the TA image;(c)the overlaid TA/US image.The green and red circles and the orange rectangle,respectively,indicate the positions of the cephalic vein,radial artery,and brachioradialis muscle;(d)the normalized TA profile along a red dashed cut line through the center of cephalic vein in(b).
From Fig.5,we see that the responses of the blood vessels/muscle tissues to venous and arterial occlusion are consistent for all the volunteers.During the VO or AO stage,the radial artery at the distal heart of the forearm was in an ischemic condition because of its restricted blood flow.As a result,its Hct value decreased and the corresponding electrical conductivity increased,[22]leading to an increase in the amplitude of TA signal in the artery.We note that this increase in the TA signal was larger during the AO stage with increased occlusion pressure.After the pressure was released,the TA signal returned to the baseline level.During the VO or AO stage,the cephalic vein at the distal heart of the forearm was in a congestion state because of its retarded backflow.As a result,the Hct value increased and the corresponding electrical conductivity decreased,leading to a decrease in the amplitude of TA signal in the vein.Similar to the artery,this decrease was larger during the AO stage because of the higher occlusion pressure applied.After the pressure was released,the TA signal returned to the baseline level.During the VO or AO stage,muscle tissue was in ischemia,and thus the Hct changes vs.TA signal variation were similar to that in the artery.
4.Discussion
Since the goal of this study was to demonstrate the possibility of thermoacoustic assessment of Hct changes,we did not attempt to conduct an in-depth study to quantify parameters such as the minimal Hct change that TA can distinguish.However,the TAI results of in vitro venous blood(Fig.3)showed that TA can distinguish at least 20% of Hct change.Moreover,in the TAI results of in vivo occlusion stimulation(Fig.5),the TA signal change of the vein relative to the resting state was at least~15%.According to Refs.[21,38],the Hct of healthy human whole blood is about 40%,and so the Hct value of venous blood in resting stage[Fig.5(b)]could be estimated as about 40%.For in vitro venous blood TAI experiments(Fig.3),when Hct was 40%,the contrast was 12.8.The contrast value was 10.88 after a 15% reduction[12.8×(1−0.15)=10.88].In Fig.3(b),Hct value was about 80% given this contrast value of 10.88.Hence,we can conclude that the Hct change of the vein in the occlusion stimulation measured by TAI was at least greater than 20%(80%–40%>20%).
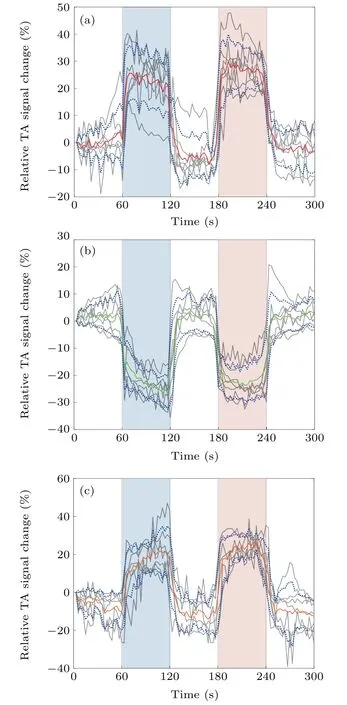
Fig.5.Averaged relative TA signals from(a)the artery,(b)the vein and(c)the muscle for the seven human subjects during the left forearm occlusion.Gray lines:TA signals for each individual subject;red,green or orange line:averaged TA signals over seven subjects;blue dotted lines:the standard deviation for the averaged TA signals over seven subjects.
According to Ref.[19],plasma mainly contains eight kinds of polar molecules including Alb,Glo,Nacl,Fib,Glu,Gly,Lys and Arg,and the sum of Alb,Glo,Nacl and Fib accounted for 99.68%of all the polar molecules.It is also indicated that the higher the concentration of polar molecules in blood,the stronger the TA signal intensity.Hct value refers to the proportion of plasma and red blood cells(RBCs)relative to whole blood,i.e.,Hct=0% means that the blood sample is just plasma,while Hct=100% means that the sample has pure RBCs.In our study,when we changed the proportion of plasma in blood,we automatically changed the proportion of polar molecules in blood proportionally.From the in vitro and in vivo TA experiments,we have observed that the Hct value decreased since both the proportions of plasma and polar molecules increased,and that the intensity of TA signals increased.Thus,this finding is complementary to the conclusion reported in the above mentioned reference,and confirmed each other.The conclusion is that the polar molecules in blood do not affect the reliability of the TA experiments in this study.
However,the current study has some limitations.The conductivity in vitro blood samples was measured at 2.4 GHz,which was slightly different from the frequency used for TAI.However,according to a previous study by Wolf et al.and an open data site“Calculation of the Dielectric Properties of Body Tissues in the frequency range 10 Hz–100 GHz”,[21,45]the dielectric properties of blood at 2.4 GHz(σ=2.50 S/m,εr=58.35)and 3.0 GHz(σ=3.05 S/m,εr=57.35)are very close.In addition,Wolf et al.showed that from 10 kHz to 10 GHz,as the Hct value increased,the conductivity showed a decreasing trend,which was consistent with the conductivity results from our in vitro blood experiment.So the conductivity results measured at 2.4 GHz holds a significant reference value and should not affect our observation on the change of Hct value.In addition,the temporal resolution of the system was limited,which can be improved using a microwave source with a higher repetition rate.The ultrasonic linear array with a center frequency of 8.5 MHz was selected to receive both ultrasonic and TA signals,which was not optimal for TAI performance because most of the TA signals were below 8.5 MHz,as shown in Fig.6.It is worth noting that an x-shaped artifact in the TA image shown in Fig.3(a)is seen,which was caused by the use of a linear array for receiving TA signals and the use of a traditional back-projection algorithm for image reconstruction.However,the impact of this effect can be minimized using a circular array or an improved image reconstruction algorithm.In the future research,we will focus on improving temporal resolution and designing a better system to balance the difference between the ultrasonic and TA signal frequencies.
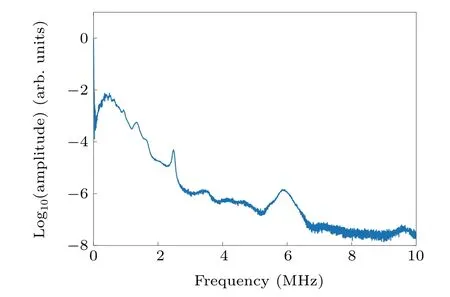
Fig.6.The frequency spectrum of TA signals given in Fig.4(b).
5.Conclusion
In summary,we have presented evidence that TAI can be used to in vivo image the Hct changes in blood vessels and muscles in the forearm during a vascular occlusion simulation.The results obtained have shown a strong correlation between the changes in TA signal/conductivity and hematocrit/blood flow,suggesting the potential of TAI as a new tool for functionally visualizing human blood.
猜你喜欢
杂志排行
Chinese Physics B的其它文章
- Origin of anomalous enhancement of the absorption coefficient in a PN junction∗
- Protection of isolated and active regions in AlGaN/GaN HEMTs using selective laser annealing∗
- First-principles study of plasmons in doped graphene nanostructures∗
- Probing thermal properties of vanadium dioxide thin films by time-domain thermoreflectance without metal film∗
- An improved model of damage depth of shock-melted metal in microspall under triangular wave loading∗
- Signal-to-noise ratio of Raman signal measured by multichannel detectors∗
