A Logistic-growth-equation-based Intensity Prediction Scheme for Western North Pacific Tropical Cyclones※
2021-09-17YanchenZHOUJiuweiZHAORuifenZHANPeiyanCHENZhiweiWUandLanWANG
Yanchen ZHOU ,Jiuwei ZHAO ,Ruifen ZHAN*,,,4 ,Peiyan CHEN ,Zhiwei WU,4 ,and Lan WANG
1Department of Atmospheric and Ocean Sciences,Institute of Atmospheric Sciences,Fudan University,Shanghai 200438,China
2Fujian Key Laboratory of Severe Weather,Fuzhou 350001,China
3Shanghai Typhoon Institute of China Meteorological Administration,Shanghai 200030,China
4Big Data Institute for Carbon Emission and Environmental Pollution,Fudan University,Shanghai 200438,China
ABSTRACT Accurate prediction of tropical cyclone (TC) intensity remains a challenge due to the complex physical processes involved in TC intensity changes.A seven-day TC intensity prediction scheme based on the logistic growth equation (LGE)for the western North Pacific (WNP) has been developed using the observed and reanalysis data.In the LGE,TC intensity change is determined by a growth term and a decay term.These two terms are comprised of four free parameters which include a time-dependent growth rate,a maximum potential intensity (MPI),and two constants.Using 33 years of training samples,optimal predictors are selected first,and then the two constants are determined based on the least square method,forcing the regressed growth rate from the optimal predictors to be as close to the observed as possible.The estimation of the growth rate is further refined based on a step-wise regression (SWR) method and a machine learning (ML) method for the period 1982−2014.Using the LGE-based scheme,a total of 80 TCs during 2015−17 are used to make independent forecasts.Results show that the root mean square errors of the LGE-based scheme are much smaller than those of the official intensity forecasts from the China Meteorological Administration (CMA),especially for TCs in the coastal regions of East Asia.Moreover,the scheme based on ML demonstrates better forecast skill than that based on SWR.The new prediction scheme offers strong potential for both improving the forecasts for rapid intensification and weakening of TCs as well as for extending the 5-day forecasts currently issued by the CMA to 7-day forecasts.
Key words:tropical cyclone,intensity prediction,western North Pacific,logistic growth equation
1.Introduction
Tropical Cyclones (TCs) are among the most important disastrous weather systems over the western North Pacific (WNP),which are often accompanied by violent winds,heavy rains,and even storm surges before and after landfall,causing considerable damage and economic losses.Therefore,improving TC forecasts is of great importance for disaster prevention.
With increasingly precise observational data,continuous development of numerical weather prediction models,advances in data assimilation,and a more in-depth understanding of the physical mechanisms which determine TC tracks,the forecast skill of TC tracks over the WNP has been continuously improved in the past several decades (see a review by Heming et al.,2019).In sharp contrast,TC intensity forecast errors over the WNP have not shown any significant reduction since the 2000s (Dong et al.,2019;Li et al.,2020).In addition,the China Meteorological Administration (CMA) currently makes TC intensity forecasts at a lead time of five days.Tropical cyclone intensity over the North Atlantic is also challenging to predict at long-range forecast times (Cangialosi,2020).Given the complexity of the issue and its great importance to society,improving the forecast skill of TC intensity and extending the lead time of forecasts have become important and urgent matters (Xu et al.,2010;Cangialosi,2020).
It is vital to understand the factors affecting TC intensity.Large-scale environmental conditions have been well documented as to their key roles in controlling TC intensity changes (Elsberry et al.,2013).Since TC genesis and development involve complex air-sea interactions,TC intensity change is closely related to the pre-storm sea surface temperature (SST) and sea surface heat flux (Knutson et al.,2010).The vertical wind shear (VWS) and maximum potential intensity (MPI) also significantly affect TC intensity changes (Emanuel et al.,2004;Zeng et al.,2007;Wang et al.,2015a,b).Apart from large-scale environmental conditions,TC internal dynamics (e.g.,TC structure and convective bursts) have also been recognized to significantly affect TC intensity changes (Wang and Wu,2004).However,for a TC at any given time,the key factors affecting its intensity change also have uncertainties due to the complex,nonlinear processes involved (Duan et al.,2005).Therefore,clarifying the relative importance of factors controlling TC intensity remains a challenge.
Despite the challenges,various methods have been developed and applied to TC intensity forecasts.Methods
used in current operational TC intensity forecasts can be roughly classified into five categories:(1) simple extrapolation based on the successive initial approximations (Dvorak,1975;Velden et al.,1998);(2) statistical methods using empirical relationships between the change in TC intensity and the various preceding factors (e.g.,DeMaria and Kaplan,1994;Knaff et al.,2005;Chen et al.,2011);(3) dynamical approaches based on global or regional numerical models(eg.,Kurihara et al.,1993;Bender et al.,2007;Ma and Tan,2009);(4) dynamical-statistical methods with a combination of the statistical and dynamical approaches (eg.,DeMaria and Kaplan,1997;Knaff et al.,2005);and (5) simplified dynamical system models based on simplified differential equations (eg.,DeMaria,2009).Among these,the simplified dynamical system model is especially promising due to its simplicity and reliable skill.For example,DeMaria(2009) developed a TC intensity prediction scheme based on a logistic growth equation (LGE) for the North Atlantic and eastern Pacific basins.Both hindcasts and forecasts showed that the LGE-based scheme demonstrates better forecast skill than the current statistical approaches,and thus has been regarded as one of the best individual models for TC intensity forecasts at the National Hurricane Center(NHC) as shown in Cangialosi (2020).However,at present,the LGE model (LGEM) was only developed for TC intensity forecasts over the North Atlantic and eastern Pacific basins.No effort has been devoted to the development of such a scheme for TC intensity prediction for the WNP.Recently,increasing efforts have been made to improve TC intensity predictions using machine learning (ML) methods (Baik and Hwang,1998;Huang et al.,2016;Cloud et al.,2019;Jin et al.,2019;Su et al.,2020).For example,Jin et al.(2019) established a TC intensity prediction scheme based on an eXtreme Gradient BOOSTing (XGBOOST)method.More recently,Su et al.(2020) developed a probabilistic forecast scheme for TC rapid intensification (RI) using ML,which shows better predictive skill than the NHC operational RI consensus.In general,ML methods can be effectively deployed for TC intensity prediction since they have a great advantage in deducing the nonlinear and uncertain processes which lead to TC intensity changes.However,most of the current ML-based approaches have been developed for short-lead-time TC intensity forecasts.
In this study,we will introduce a seven-day TC intensity prediction scheme for the WNP based on the combination of the LGEM and the Light Gradient Boosting Machine(LightGBM) model,which is an implementation of fast boosting on decision tree (Ke et al.,2017).We will demonstrate that the newly developed scheme has a good potential for optimizing the operational TC intensity forecasts.The remainder of this paper is organized as follows.The data and methodology are described in section 2.The procedures involved in constructing the LGE-based scheme,including selecting predictors,fixing the parameters,and training the models are presented in section 3.The forecast performance of the LGEM is evaluated in section 4.Section 5 provides a real-time application of the LGEM.Discussion and conclusions are given in section 6.
2.Data and methodology
2.1.Data
The TC best-track dataset over the WNP,containing the maximum sustained surface wind speed and location (longitude and latitude) information in 6-hour intervals,was obtained from the Shanghai Typhoon Institute (STI) of the China Meteorological Agency (CMA).In this study,TC intensity is defined as the maximum two-minute average 10-m wind speed (V).TCs with V ≥ 17 m swere selected as samples to develop the LGEM.We note that all data over land were excluded since the maximum potential intensity(MPI) included in the LGEM is limited to the ocean.TC samples during 1982−2014 were used to construct the LGEM,while those which occurred during 2015−17 were utilized as independent samples to evaluate the prediction skills of the LGEM.Figure 1 shows the numbers of the training and test samples,in which the training samples account for more than 90% of the total samples.To further evaluate the performance of the LGEM,the official real-time forecast data of TC intensity from the CMA during 2015−19 were derived from the TC operational database at the STI.

Fig.1.The numbers of training and testing samples for different forecast times at 6-h intervals.
Over the past decade,the WNP Intensity Prediction Scheme developed by the STI (WIPS;Chen et al.,2011)has been continuously operating and has generally shown good skill among the CMA’s operational intensity forecast models (Chen et al.,2019).In this study,we used the same inputs as the operational WIPS model,including potential predictors and MPI.Following the WIPS model,we used the 6-hourly reanalysis data with a horizontal resolution of 2.5° ×2.5° from the National Centers for Environmental Prediction and National Center for Atmospheric Research(NCEP/NCAR) (Kalnay et al.,1996) to calculate the various environmental predictors.Note that the location of TC center is also needed to calculate the predictors in this study.The weekly optimum interpolation (OI) SST V2 data at a horizontal resolution of 1° × 1° from the National Oceanic and Atmospheric Administration (NOAA) (Reynolds et al.,2002) were used to calculate the ocean predictors after linear interpolation into 6-hourly data.Furthermore,the NCEP Global Forecasting System (GFS) forecast fields (Yang et al.,2006) during 2017−19 were also used for additional applications.
2.2.Methodology
2.2.1.The LGE
Following DeMaria (2009),the generalized prediction equation for TC intensity (V) based on the LGE can be written as

κ
is the time-dependent growth rate,andβ
and n are two positive constants that determine the magnitude of diffusive processes caused by the ocean and atmosphere.The TC intensity tendency is mainly determined by the growth and the diffusion processes.The first term of the right-hand side of the equation is the intensity growth term,which is determined by the degree of (un) favorable environmental factors.The second term reflects the diffusive processes,which include the increase in friction that occurs along with the intensity growth and the damping process that occurs when the TC moves into colder SSTs or an otherwise unfavorable atmospheric environment.For simplicity,the 6-h forward difference will be used to approximate V every six hours from 6 to 168 h.2.2.2.LightGBM
In this study,we applied a step-wise regression (SWR)method and an ML method for the LGE-based TC intensity forecast.Here,the ML method used is LightGBM,which is a fast,distributed,high-performance gradient boosting framework based on decision tree algorithms (Ke et al.,2017).It originates from the Gradient boosting decision tree (GBDT)but possesses significant improvements in resolving its scalability and long computational time by adopting a leaf-wise,tree growth strategy and introducing novel techniques.Previous studies have demonstrated that the LightGBM offers good prediction performance,consumes short computational time,and is a promising ML method (Ju et al.,2019;Zhang et al.,2019).In addition,since the average lifetime of TCs is about one week,the number of samples rapidly decreased from 21330 to 3905 for the predictions every six hours from 6 hto 168 h (seven days;Fig.1).The Light-GBM is well-balanced in processing such great changes of samples.Therefore,we will apply it to the LGEM construction and compare its prediction performance with that of conventional regression.
2.2.3.RMSE
Here,the Root Mean Square Error (RMSE) was used to evaluate the intensity prediction skills of the LGEM.The calculation formula of the RMSE is written as

where the term frefers to the value of a forecast V for the forecast time i,and the term ois the value of V from observation.m is the number of the sample.
2.2.4.POD and FAR
The skill of TC rapid intensification and rapid weakening forecasts was evaluated utilizing the probability of detection (POD) and the false alarm rate (FAR) (Wilks,2006).The POD is the percentage of time that rapid intensification or rapid weakening events are correctly identified.The FAR is the ratio of the number of times that an event is forecast to occur but does not,divided by the total number of times that an event does not occur.
To quantify the relative importance of the potential predictors in affecting TC intensity changes,we employed the Lindeman,Merenda,and Gold method (LMG;Lindeman,1980) of the relaimpo package (Groemping,2006) within the R environment for statistical computing (R Core Team,2013).The LMG method takes the average of the sequential sums of squares over all orderings of regressors,which addresses both the direct effects and those effects adjusted for other regressors in the model.
3.Model development
3.1.Predictor selection
Factors affecting TC intensity vary from basin to basin.DeMaria (2009) constructed the North Atlantic and eastern North Pacific LGEMs based on the predictors from the simple Statistical Hurricane Intensity Prediction Scheme(SHIPS).As mentioned above,the potential predictors in this study were selected based on the WIPS.As shown in Table 1,these predictors include the climatology and persistence predictors and the atmospheric and oceanic predictors for each 6-h forecast interval out to 168 h (seven days).Similar to the WIPS,all of these were derived along the TC tracks.The MPI was estimated using the equation by Knaff et al.(2005).Moreover,we tested the other three common formulas of MPI over the WNP as inputs (DeMaria and Kaplan,1994;Baik and Paek,1998;Zeng et al.,2007).The results show that the MPI developed by Knaff et al.(2005)used in the LGE-based model generally shows better skill in forecasting TC intensity than others.Therefore,the MPI developed by Knaff et al.(2005) was selected in this study.Following Knaff et al.(2005),the maximum value of MPI is set to 95 m s(185 kt) to avoid unreasonable MPI.

Table 1.Description of the potential predictors.
Since the predictors are vital to a statistical model,we first reexamine them using correlation and relative importance analyses.Note that all of the predictors,as well as the predictands,were normalized before they were further analyzed.Figure 2 illustrates the scatter distributions of the potential predictors and the 24-h TC intensity tendency from 1982 to 2014.As expected,these predictors show high correlations with the 24-h TC intensity change that is significant at the 99% confidence level except for the average 200-hPa divergence (DIV20).Most notable is the strong correlation between the MPI and the 24-h TC intensity change,with a correlation coefficient of 0.48.Note that there are two reasons for the relationship being examined only for the 24-h TC intensity change.The first is because the 24-h centered time difference will be used to determine β and n and to calculate the“observed”κ
as indicated in the next section,which is consistent with DeMaria (2009).The other is because the 6-h forward difference will be used to predict TC intensity as indicated in section 2.2.1,which means that the predictors at the previous six hours of each forecast time are also important.Compared to 24-h TC intensity change,6-h TC intensity change shows similar correlations with the potential predictors (not shown).Further,we calculated the relative contributions of each factor that affects TC intensity change using the LMG method as introduced in section 2.As shown in Fig.3,among all of the factors,the previous 12-h intensity(DV12),MPI,the latitude of the greatest vorticity at 850 hPa (VOR85_LAT),and SST contribute the most to TC intensity changes,with contributions of 33.0%,8.3%,5.6%,and 5.5%,respectively,all of which are statistically significant above the 95% bootstrap confidence level.In contrast,the absolute vorticity and temperature difference between right and left semicircle relative to the TC track at 850-hPa and 500-hPa geopotential heights contribute the least to TC intensity.The following optimal predictors were selected to construct the LGEM according to the above analyses based on the correlation and relative importance:DV12,MPI,VWS,AU,TMP20,VOR85_LAT,VOR85_LON,RH8570,RH5030,and SST,each of which made contributions larger than 0.5%.

Fig.2.Scatter plots of environmental factors and 24-h TC intensity changes.The regressed line is marked in each subplot,and the corresponding correlation coefficient is shown in the lower right corner.

Fig.3.Distribution of relative importance (%) of potential predictors.
3.2.Construction of the LGEM over the WNP
With the optimal predictors and the LGE as introduced in section 2,the LGE-based TC intensity forecast scheme over the WNP is developed based on the TC best-track data and the reanalysis data in this study.A separate set of submodules is used to predict TC intensity every six hours,from 6 h to 168 h.
Figure 4 summarizes the workflow in constructing the LGEM.The workflow consists of three parts:data preprocessing,model development,and model prediction.In the data preprocessing,the optimal predictors and predictands every six hours from 0 to 168 h were calculated using the historical CMA TC best-track data,NCEP/NCAR reanalysis,and NOAA SST data during 1982−2017.The training dataset during 1982−2014 is used to build the LGEM by fitting the two constant parameters of β and n and estimating the growth rateκ
.The two constants are determined by the least square method which makes the regressed growth rate from the optimal predictors as close as possible to the "observed"growth rate.The growth rate is further estimated based on the SWR and LightGBM,respectively.Furthermore,the testing dataset during 2015−17 is used to indicate the performance of the LGEM by predictingκ
and then the TC intensity.Finally,the CMA real-time forecast dataset of TC intensity is compared to the LGEM to further evaluate its forecast potential.
Fig.4.A schematic diagram of the prediction system of LGEM,including data preprocessing,model development,and model prediction.
3.3.Estimation of the constants β and n
In order to determine the values of β and n,Eq.(1) can be written as

β
from 0 to 0.05 using 0.001 intervals and n from 0 to 5 using an increment of 0.1 according to the values over the Atlantic (DeMaria,2009) in which the final values ofβ
and n were 1/24 and 2.5.Using historical observed TC intensity and MPI data,we can calculate the "observed"κ
(denoted asκ
1) values with Eq.(3).Then,we can also obtain the estimatedκ
(denoted asκ
2) based on the regression equations using the above optimal predictors derived from reanalysis data.κ
1 andκ
2 were recalculated with different values ofβ
and n which were determined by minimizing the square errors betweenκ
1 andκ
2.Figure 5 shows the distribution of total square errors of the growth rateκ
between observation and regression as a function ofβ
and n based on the samples during 1982−2014.The total square error reaches a minimum of 18.035 when the values ofβ
and n are 0.023 hand 2.3,respectively,which are very close to their counterparts over the Atlantic (β
=0.025 hand n=2.6).This suggests that although the factors which affect TC intensity changes are different over the WNP compared to the Atlantic basins,the values ofβ
and n are similar to each other.3.4.Estimation of the growth rate κ
According to DeMaria (2009),the growth rateκ
is a function of large-scale variables and persistence predictors,which are time-dependent.After determining the constant parameters of β and n,we can obtain the exact values of“observed”κ
using Eq.(3).Then,the SWR and LightGBM were used to train and predictκ
using the optimal predictors and the“observed”κ
,respectively.As mentioned above,the training dataset during 1982−2014 was used to train the relationship between predictors andκ
.As a result,a separate set of regression models and a separate set of Light-GBM models were built to predictκ
every six hours from 6 to 168 h.Using these two sets of models and the testing dataset during 2015−17,we can predictκ
at each forecast time.Given thatκ
and other parameters in Eq.(1) are known,the LGEM with a forward-time-differencing scheme was used to predict the intensity (V) at each forecast time.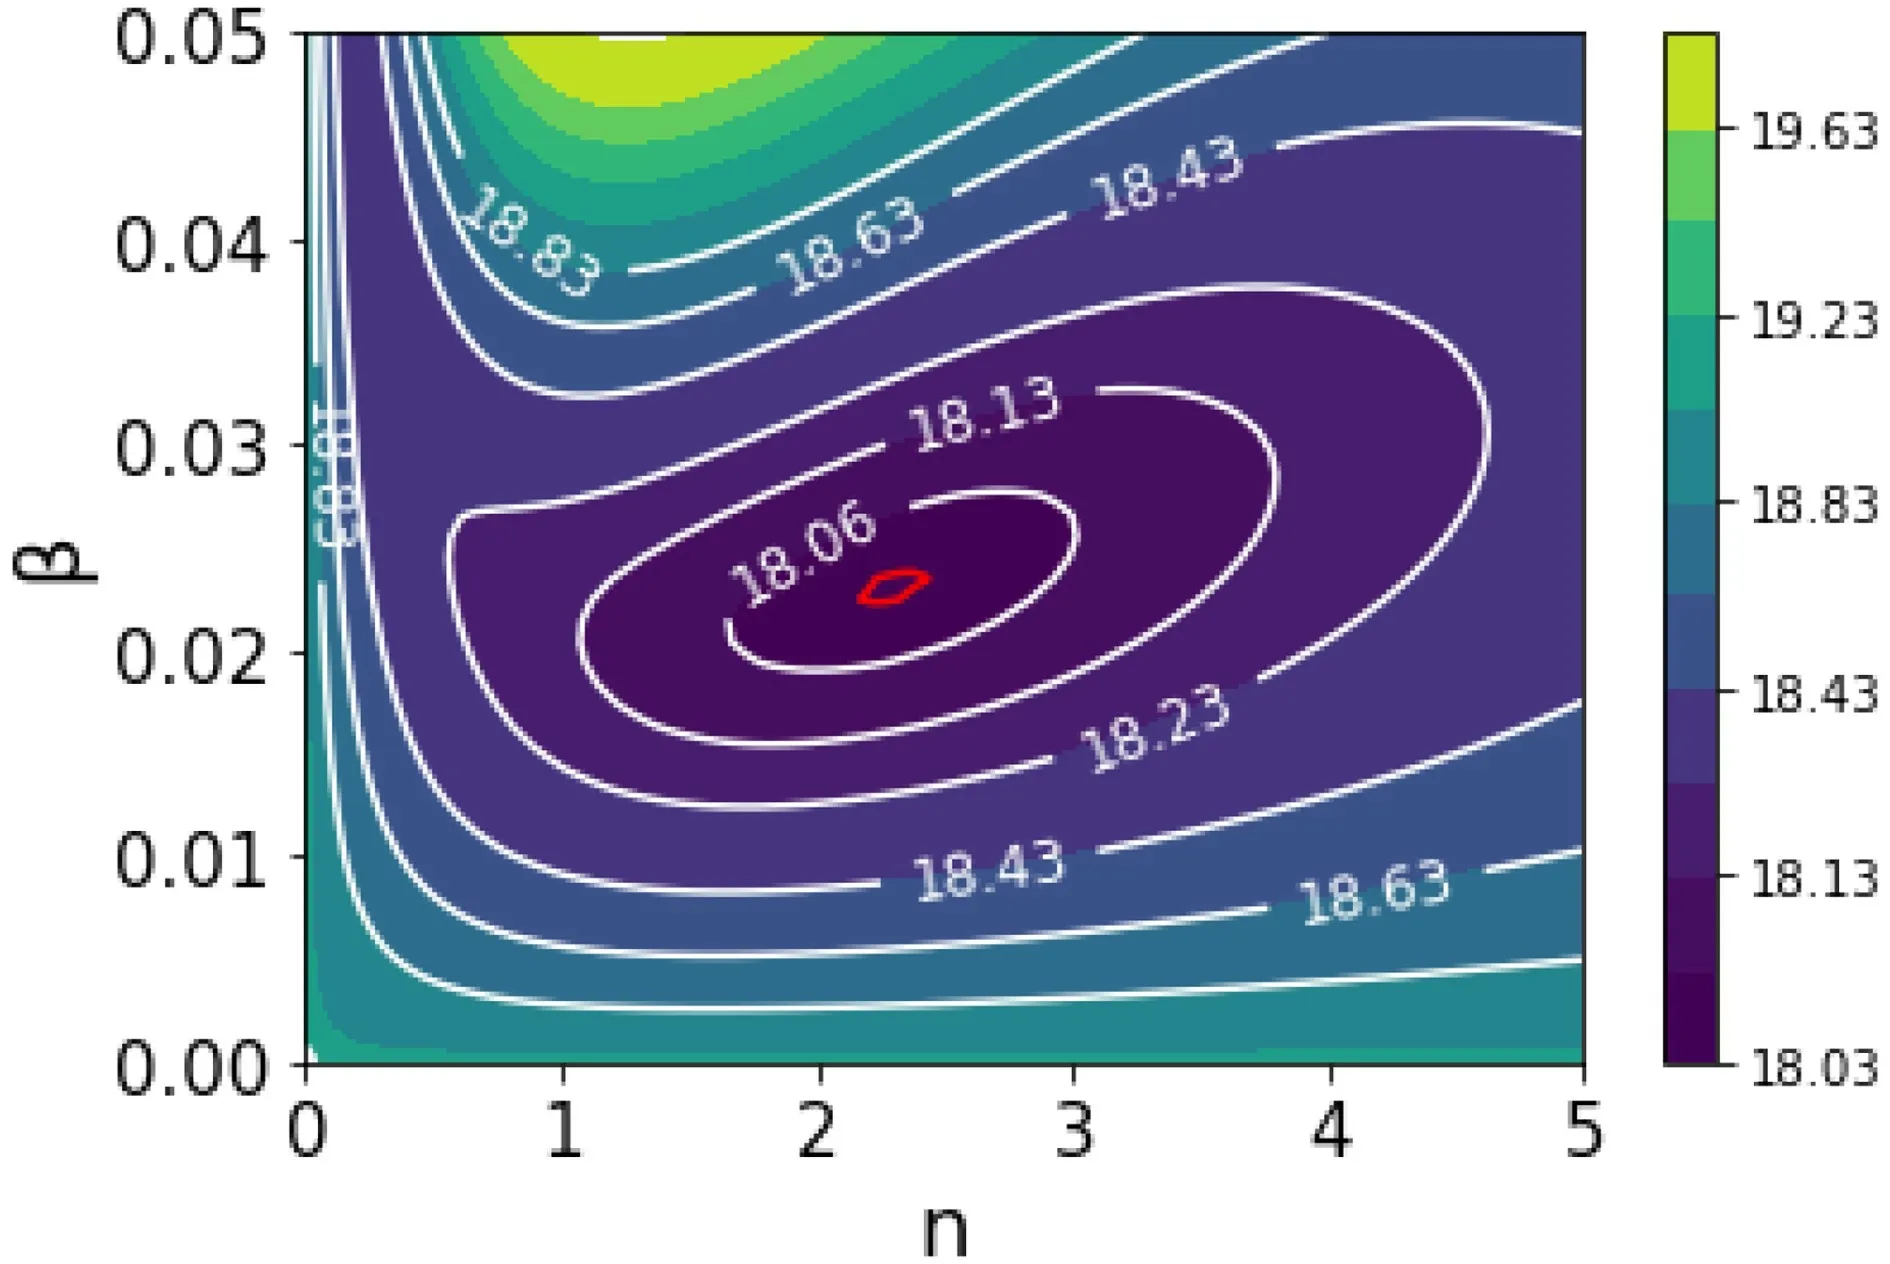
Fig.5.The distribution of total square errors of the growth rate κbetween observation and regression as a function of β and n based on the samples during 1982−2014.Here,β is discretized from 0 to 0.05 using with 0.001 intervals and n from 0 to 5 using with an the increment of 0.1.
4.Model performance verifications
In this section,the SWR-based and LightGBM-based LGEMs over the WNP will be compared with the official intensity forecasts from the CMA based on two long-lived cases in 2015 and based on comprehensive cases during 2015−17.The case study will be demonstrated in section 4.1,and then all sample verification will be summarized in section 4.2.
4.1.Case study demonstration
The test cases are Typhoon Maysak (201504) and Typhoon Champi (201525),both of which were maintained for more than 10 days over the WNP and experienced rapid intensification,but exhibited different tracks and intensity changes.Figures 6a–6d show tracks and intensities for these two TCs.Maysak formed east of Pohnpei on 27 March as a tropical storm,intensified to a category super typhoon on 31 March with the intensity of 65 m s,and weakened to a tropical storm before striking the Philippines.Champi formed northeast of the Marshall Islands on 13 October,intensified to a typhoon on October 16,and reached peak intensity with the intensity of 55 m son 18 October.Then,Champi started to weaken but experienced a short-lived re-intensification on 22 October.It became an extratropical cyclone on 25 October before fully dissipating on 28 October.
Figures 6c and 6d show the evolution of the observed values of the growth rateκ
for these two TCs.It can be seen thatκ
for Typhoon Maysak maintained a positive and high value during the early stages of TC genesis and development,and then reached a second maximum 6–12 hours before Maysak reached peak intensity.Afterwards,κ
started to gradually decay before becoming negative during the decaying period.The evolution ofκ
in Typhoon Champi is similar to that in Typhoon Maysak,butκ
in Typhoon Champi also experienced another peak before TC re-intensification.It should be noted that in the early stages,although the value ofκ
is large due to conducive environmental factors which support TC development at this stage,the net effect ofκ
is relatively small due to the small TC intensity.At the development and peak stages,the changes inκ
are consistent with those in TC intensity with leading indicators,which suggests that the effect ofκ
is vital.This indicates thatκ
in Eq.(1) indeed is reasonable in promoting TC development.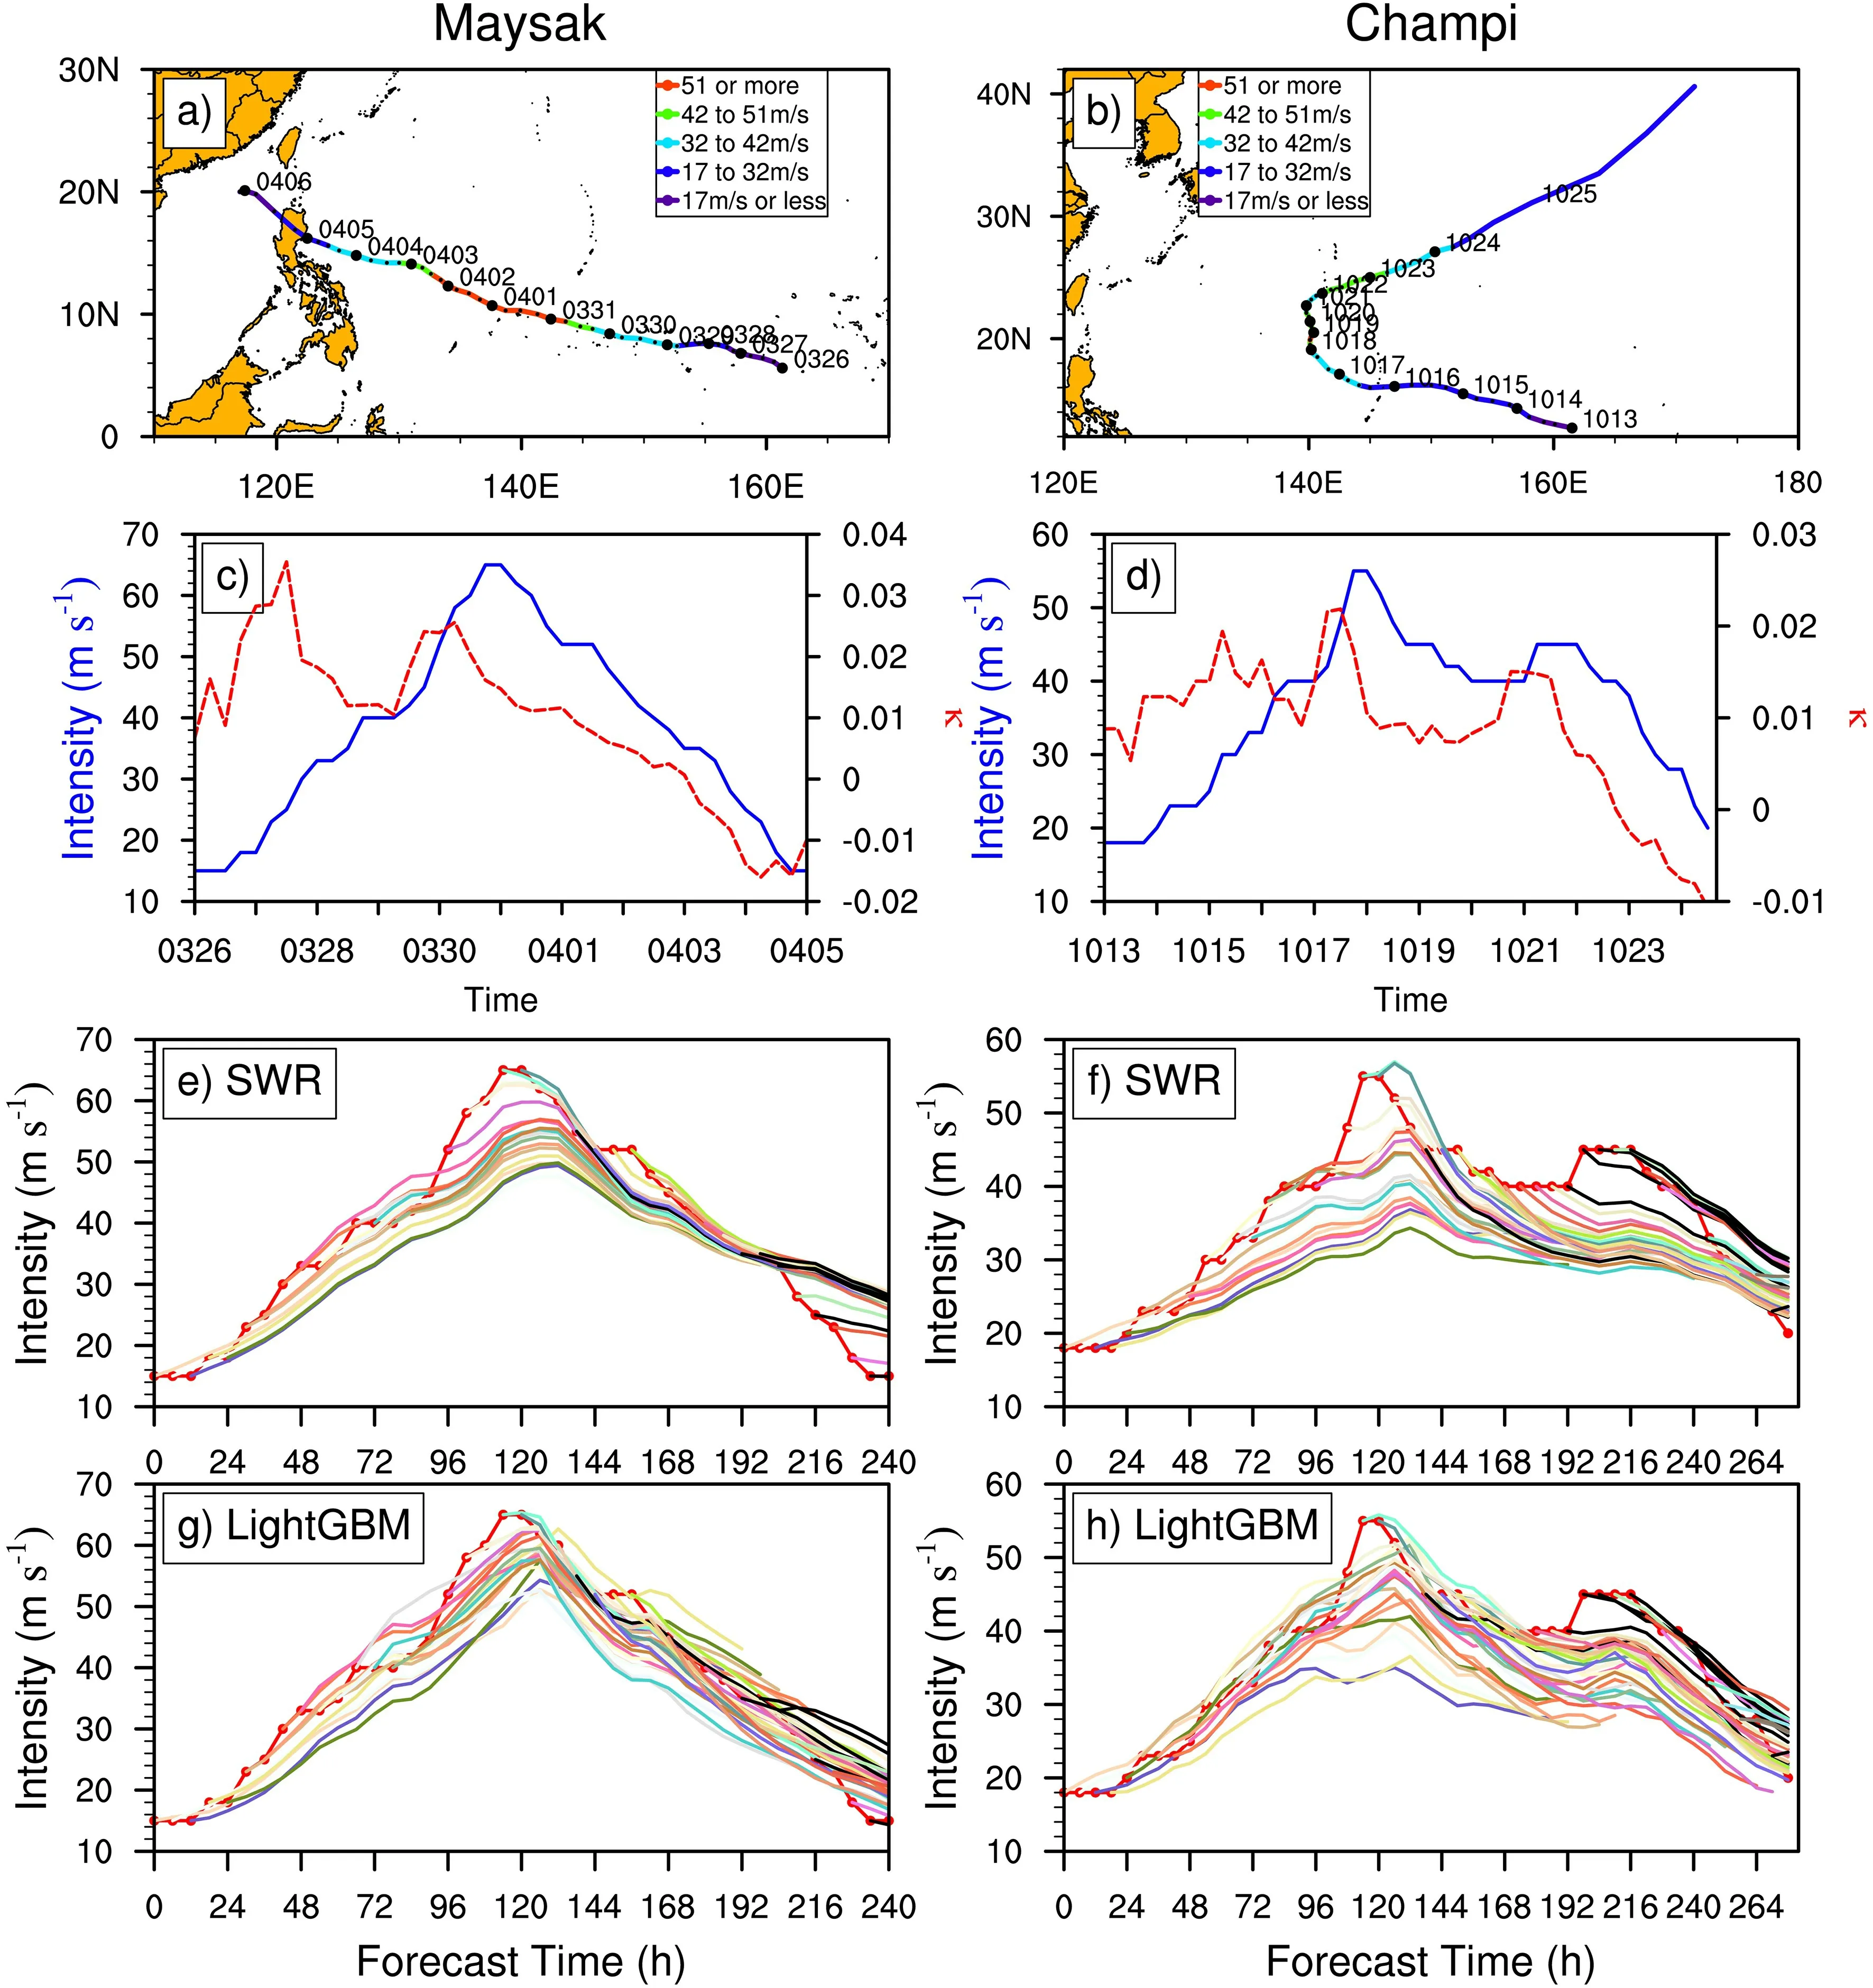
Fig.6.(a,b) Tracks for Maysak and Champi in 2015 and (c,d) the corresponding intensity (blue) and the calculated growth rate κ (red) at 6-h intervals based on the CMA best track data;The 7-day forecasts of the intensity (unmarked color lines) for (e,g) Maysak and (f,h) Champi in 2015 at different forecast times with 6-h intervals based on (e,f)SWR-based and (g,h) LightGBM-based LGEMs and the corresponding CMA best-track intensity (red dotted line).In (e–h),those unmarked color lines mean 7-day TC intensity predictions with 6-h intervals,and the first point of each line indicates the initial forecast time.
Figures 6e–6h show the maximum winds from the 7-day forecasts of the SWR-based and LightGBM-based LGEMs and the CMA best track for Typhoon Maysak and Typhoon Champi.Both LGEMs reproduce every aspect of the intensity evolution of corresponding TCs reasonably well.It is worthy to note that the LightGBM-based scheme demonstrates better skill in predicting the rapid intensification and re-intensification of the TCs with a smaller mean bias and a smaller spread than the SWR-based scheme.In contrast,the SWR-based scheme incurs large errors in predicting TC peak intensity.To further compare the forecast performance,we calculated the RMSEs of two LGEMs for two cases at lead times from 24 to 168 h every 24 h.As shown in Table 2,the RMSEs in the LightGBM-based scheme are smaller than those in the SWR-based scheme except for the 144-h and 168-h forecasts for Typhoon Champi.We also compared the forecasts of the LGEM with those from the CMA(not shown) and found that the LGEM forecasts generally show better forecasting skill at every time.The evidence suggests that the LGEM,especially the ML scheme,seems to be promising in predicting TC intensity.

Table 2.RMSEs of intensity forecasts for Maysak and Champi in 2015 at 24,48,72,96,120,144,168 h forecasts.Smaller RMSEs between the two methods are shown in boldface.
4.2.Comprehensive verifications
To confirm the results from the above case test,we fur-ther examine the forecast performance of the LGEM based on 2015−17 TC samples,which include 80 TCs.First,we calculated the RMSEs of the 7-day dV/dt forecasts in Eq.(1)from the SWR-based and LightGBM-based LGEMs at 6-h intervals for the independent cases during 2015−17.Since a forward-time-differencing scheme every 6 h from 6 to 168 h was used to predict V at each forecast time,dV/dt denotes the rate of TC intensity change between the forecast time and 6 h before the forecast time.Generally,the RMSEs of the dV/dt forecasts at 6–168 h are similar,ranging from 1.09 ×10m sto 1.38 × 10m sfor the LightGBM-based LGEM and from 1.07 × 10m sto 1.32 × 10m sfor the SWR-based LGEM.The small changes in RMSEs of the dV/dt forecasts among different forecast times suggest that the LGEM has a good potential for making longer-time TC intensity forecasts (DeMaria,2009;Cangialosi,2020),further noting that the longer-time forecast errors might be due to the cumulative errors of TC intensity forecasts.
Figure 7 displays the RMSEs of the 7-day intensity forecasts from the two LGEMs and the 5-day forecasts from the CMA at 24-h intervals for independent cases during 2015−17.In general,RMSE increases with the longer forecast times for all three kinds of forecasts.A prominent feature in Fig.7 is that the CMA forecast errors were larger than those from both the SWR-based and LightGBM-based LGEMs at all forecast times.The differences between the SWR-based LGEM and the CMA forecasts were statistically significant above the 95% confidence level at 48 h and 120 h.and those between LightGBM-based LGEM and the CMA forecasts were statistically significant above the 95%confidence level at 24–120 h.This indicates a good potential for the LGEM to produce reliable TC intensity forecasts.Another interesting feature is that the LightGBMbased LGEM showed smaller errors than the SWR-based LGEM for all of the forecast periods except the 168 h forecast,suggesting an advantage for the LightGBM method in improving TC intensity forecasts compared to the conventional SWR method.

Fig.7.Averaged RMSEs (m s−1) of the 7-day intensity forecasts from the SWR-based and LightGBM-based LGEMs and the 5-day forecasts from the CMA at 24-h intervals for independent cases during 2015−17.
It is interesting and important to evaluate the performance of the LGEM-based model in forecasting TC rapid intensification and rapid weakening.Here,we used the POD and the FAR to make an evaluation based on the testing dataset during 2015−17.To increase sample size,we defined rapid intensification and rapid weakening as the values of the 24-h intensity change DV24 ≥ 12 m sand DV24 ≤ −12 m s,respectively.There is a total of 182 and 162 events during 2015−17 that demonstrated rapid intensification and rapid weakening,respectively.Since the Light-GBM-based LGEM has better skill at 24-h forecasts than the SWR-based LGEM (Fig.7),we only examined the performance of the LightGBM-based model.For the 2015−17 WNP samples,the PODs of TC rapid intensification and rapid weakening forecasts were 35% and 41%,while the FARs of them were 29% and 13%,respectively.Their effective time is at 24-h lead time.The POD of rapid intensification forecasts for WNP TCs based on the LGEM is generally comparable to that for Atlantic hurricanes from the NHC official forecasts during 2015−17 (Fig.6 of Cangialosi et al.,2020).
We further evaluate the spatial distribution of differences in RMSEs between the CMA and the LightGBMbased LGEM forecasts as shown in Fig.8.The positive difference indicates better skill for the LightGBM-based LGEM forecasts compared to those of the CMA operational forecasts.The differences in RMSEs in Fig.8 show nearly spatially uniform positive values at all forecast times,which suggests that the LGEM can potentially improve upon current official forecasts from the CMA.The improvement of the LGEM compared to the CMA forecasts is particularly noteworthy in coastal regions since the intensity forecasts for TCs in the coastal regions are of great importance for disaster prevention.
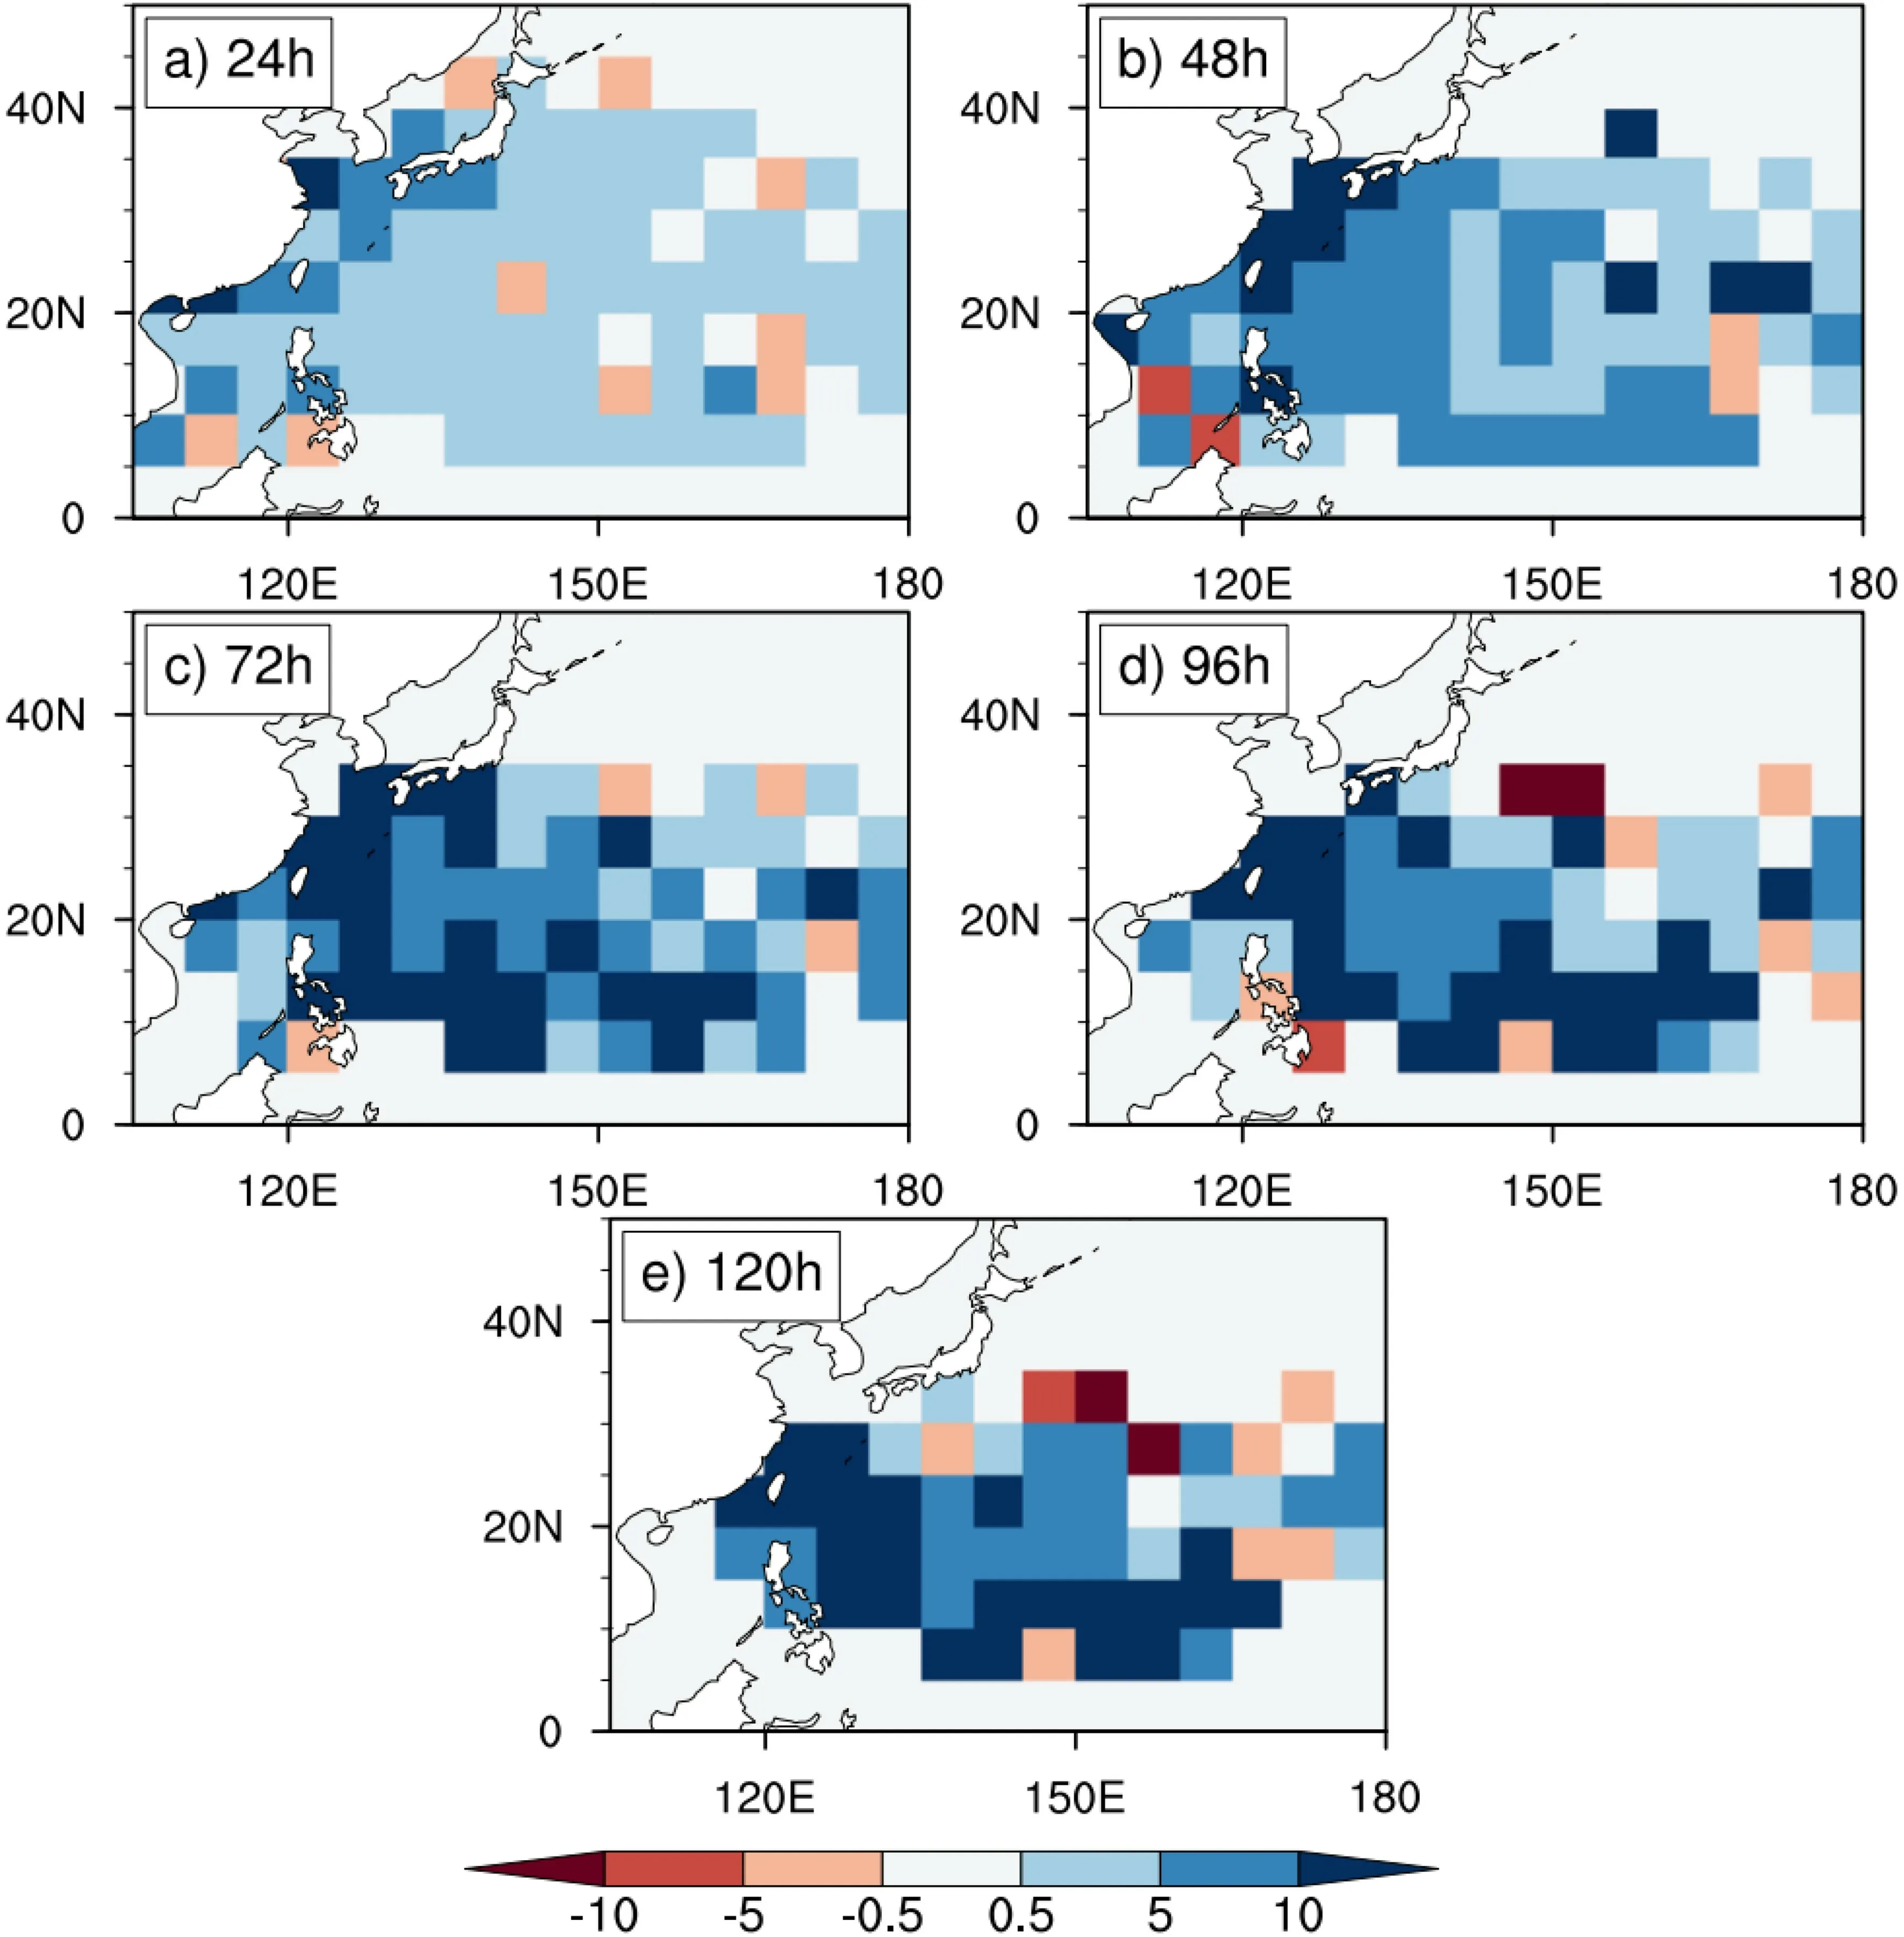
Fig.8.The spatial distribution (m s−1) of differences in RMSEs between the CMA and the LightGBM-based LGEM forecasts during 2015−17 at (a) 24,(b) 48,(c) 72,(d) 96,and (e) 120 h.
Figure 9 presents the spatial distribution of RMSEs for the LightGBM-based LGEM forecasts at 144 h and 168 h.Both show that RMSEs over most of the WNP are smaller than 11 except over the high latitudes southeast of Japan where the RMSE is slightly larger.Compared to the RMSE of the current CMA operational forecasts at 120 h (Fig.8),the LGEM is promising at longer forecast times.In this sense,the LGEM exhibits strong forecasting potential for extending the CMA forecast length from the current five days to seven days.
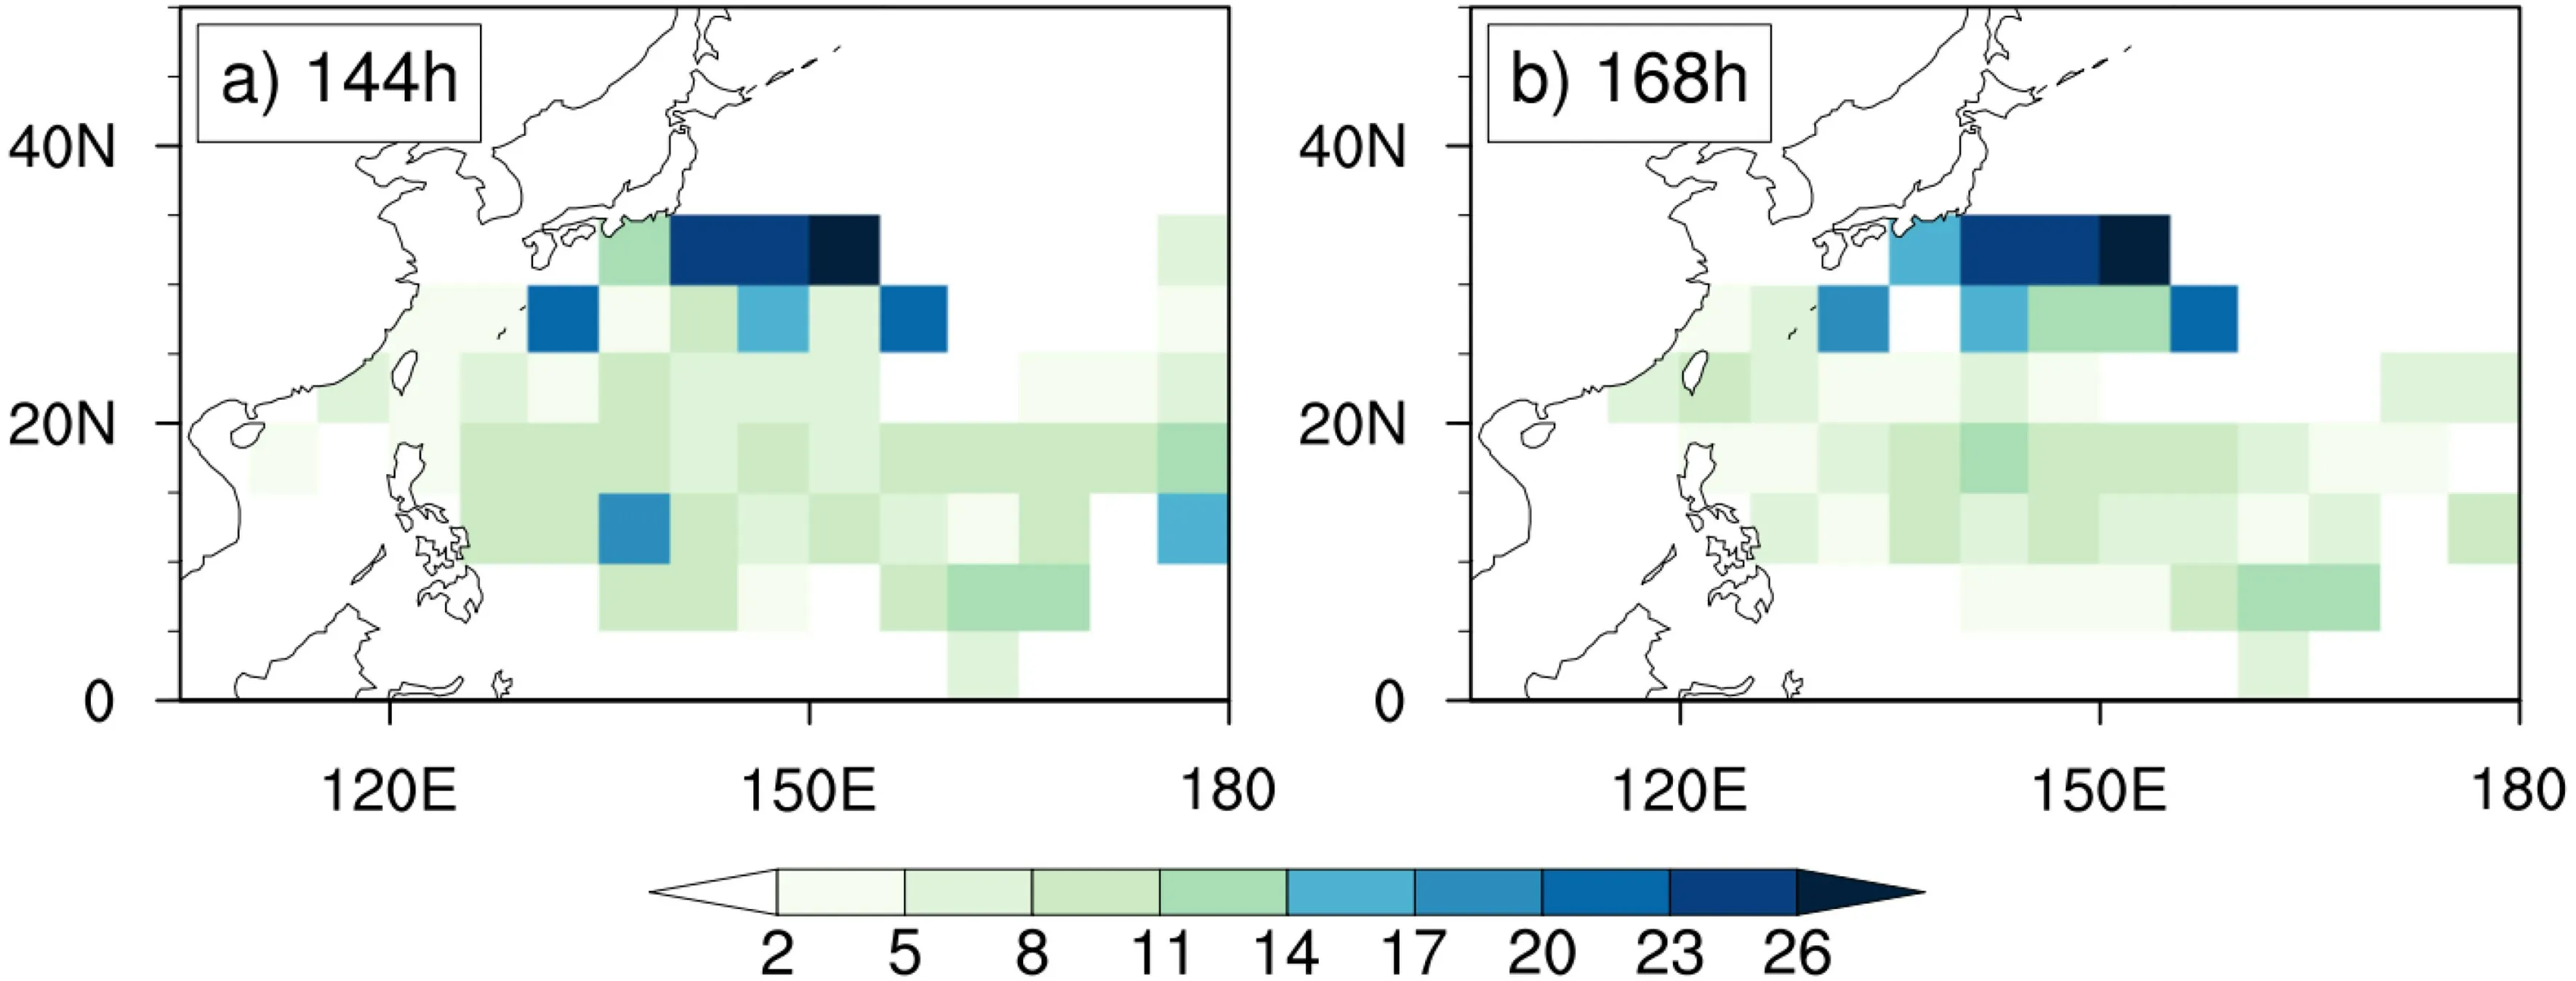
Fig.9.The spatial distribution (m s-1) of RMSEs for the LightGBM-based LGEM forecasts during 2015−17 at (a)144 and (b) 168 h.
5.Application
A case study for Typhoon Krosa (201910) which entails a combination of CMA operational track forecasts and predictors estimated from the GFS forecast fields will be presented as an example of how the LGEM predictions could provide real-time intensity predictions over much of the 5-day forecasting period.Typhoon Krosa formed at 0006 UTC 6 August 2019 and strengthened to an intensity of 28 m sjust one day later.Note that the CMA currently only issues 5-day forecasts for TC track and intensity,so this case provides a 5-day forecast,however,the LGEM can extend the forecast to seven days or longer.The forecasting procedure is similar to Fig.4,but the training dataset includes all samples during 2017−19 based on the CMA track forecasts and GFS predictor forecasts,except for Typhoon Krosa (2019),and the testing dataset only includes the data from Krosa.Except for β and n,all of the other parameters were reconstructed based on the GFS forecast data.
Figure 10 shows the 5-day intensity forecasts for Typhoon Krosa in 2019 from 0006 UTC 7 August 2019 based on SWR-based LGEM and the CMA.The LGEM forecast is generally consistent with the observation,but there is a large bias at the initial and ending stages.The difference between the LGEM forecasts and the observation is less than that between the CMA official forecast and the observation,noting further that the CMA forecasts show a lower skill during the decaying period.Therefore,the LGEM has the potential to contribute to improving TC intensity forecasts over the WNP.
6.Discussion and Conclusions
In this study,we extended the LGE-based TC intensity prediction scheme for the North Atlantic and Eastern Pacific developed by DeMaria (2009) to the WNP and constructed the 7-day LGE-based intensity prediction scheme for TCs unaffected by landfall over the WNP using the observed and reanalysis data.With 33 years of training samples,optimal predictors,including climatology and persistence predictors and atmospheric and oceanic predictors,were first selected based on the analyses of correlation and relative importance.Then,the two constants in the LGE were determined by the least square method,which forces the regressed growth rate from the optimal predictors to be as close to the observations as possible.The growth rateκ
was further estimated based on the SWR and the lightGBM methods,respectively.Independent forecasts for 80 TCs during 2015−17 show that the LGE-based scheme demonstrates better skill in predicting the TC intensity over the WNP than the CMA operational official forecasts,especially for TCs near the coastal regions of East Asia.Moreover,the lightGBMbased scheme demonstrates better forecast skill than the SWR-based scheme.It suggests that the forecasting ofκ
using the LGE-based schemeκ
,especially the combination of the ML and LGE-based scheme,is promising in predicting TC intensity over the WNP.The LGE-based scheme also exhibits strong potential for accurately forecasting rapid intensification and weakening as well as providing for an extension of the CMAs 5-day forecasts to 7-day forecasts.Finally,an application of the newly developed LGEbased scheme to real-time forecasts was demonstrated with one TC case.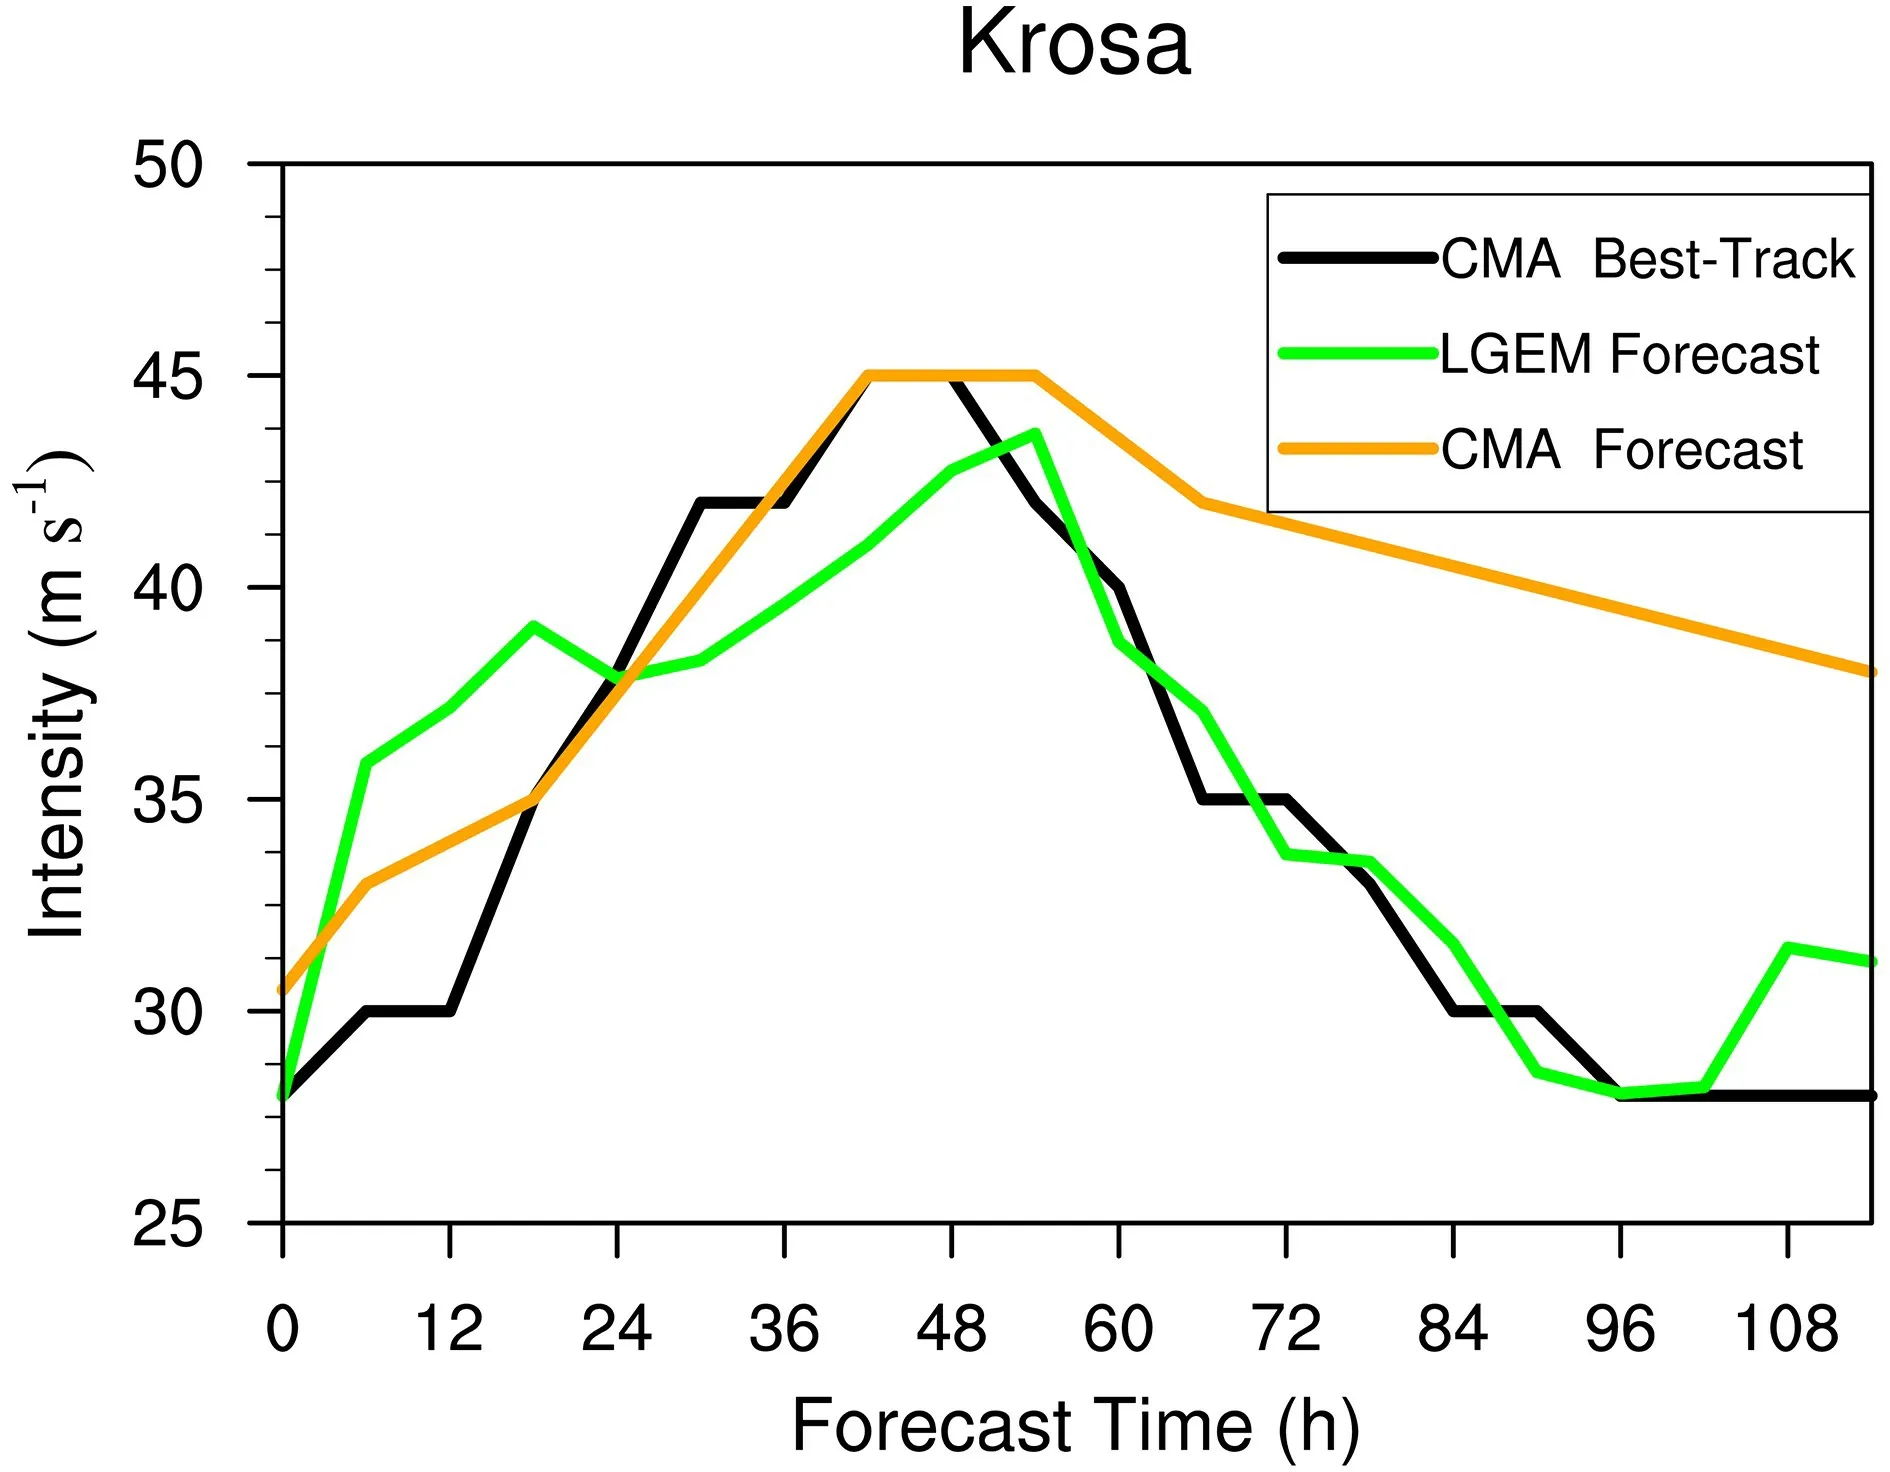
Fig.10.The 5-day intensity forecasts for Typhoon Krosa in 2019 from 0006 UTC 7 August 2019 (as 0 h in abscissa) based on the LGEM (green) and the CMA (orange),and the corresponding CMA best-track intensity (black).
It should be mentioned that the forecasts using the LGE-based scheme discussed in section 4 were based on the observed TC tracks and the "true" predictors,which are not available in real-time forecasts.The purpose for a comparison between the LGE-based scheme and the operational forecasts of CMA is not to showcase the better forecasting skill of our model compared to that of the CMA forecasts,but rather to bolster confidence for further application of the newly developed LGE-based scheme to real-time forecasts in future work.Although a case study with a combination of CMA operational track forecasts and predictors estimated from the GFS forecast fields was tested and has shown potential,verifications with more TC cases or with multi-year forecasts should be made to demonstrate the actual performance of the LGE-based scheme in predicting TC intensity over the WNP in future work.Note also that the LGE-based scheme is only available for TCs unaffected by landfall,and an inland decay model should be added to predict TC intensity over land.Since both the SWR-based scheme and the light-GBM-based scheme show good forecasting skill,we intend to apply ensemble forecasts to improve TC intensity forecasts in follow-up efforts.
.This study is supported by the National Key R&D Program of China (Grant Nos.2017YFC1501604 and 2019YFC1509101) and the National Natural Science Foundation of China (Grant Nos.41875114,41875057,and 91937302).The CMA best track TC dataset was downloaded from http://tcdata.typhoon.org.cn/.The official real-time forecast data of the CMA and the GFS forecast fields were derived from the TC operational database at the STI.The NCEP–NCAR reanalysis data were downloaded from https://www.esrl.noaa.gov/psd/data/gridded/data.ncep.reanalysis.html.The weekly OISST V2 data were downloaded from http://www.esrl.noaa.gov/psd/data/gridded/ data.noaa.oisst.v2.html.杂志排行
Advances in Atmospheric Sciences的其它文章
- Electronic Supplementary Material to:Dominant Modes of Interannual Variability in Atmospheric Water Vapor Content over East Asia during Winter and Their Associated Mechanisms*
- A Potential Risk Index Dataset for Landfalling Tropical Cyclones over the Chinese Mainland (PRITC dataset V1.0)
- Detecting Regional Deep Ocean Warming below 2000 Meter Based on Altimetry,GRACE,Argo,and CTD Data
- The Simulation of Five Tropical Cyclones by Sample Optimization of Ensemble Forecasting Based on the Observed Track and Intensity
- The Role of Ocean Dynamics in the Cross-equatorial Energy Transport under a Thermal Forcing in the Southern Ocean
- Record Arctic Ozone Loss in Spring 2020 is Likely Caused by North Pacific Warm Sea Surface Temperature Anomalies
