Electronic Supplementary Material to:Dominant Modes of Interannual Variability in Atmospheric Water Vapor Content over East Asia during Winter and Their Associated Mechanisms*
2021-09-17WenyueHEBoSUNandHuijunWANG
Wenyue HE ,Bo SUN ,and Huijun WANG
1Nansen-Zhu International Research Centre,Institute of Atmospheric Physics,Chinese Academy of Sciences,Beijing 100029,China
2University of Chinese Academy of Sciences,Beijing 100049,China
3Collaborative Innovation Center on Forecast and Evaluation of Meteorological Disasters/Key Laboratory of Meteorological Disaster,Ministry of Education,Nanjing University of Information Science and Technology,Nanjing 210044,China
4Southern Marine Science and Engineering Guangdong Laboratory (Zhuhai),Zhuhai 519080,China
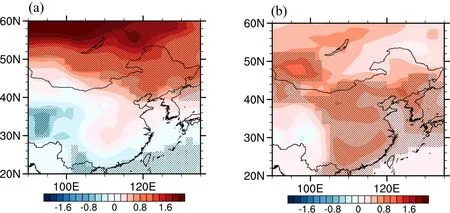
Fig.S1.Anomalies of surface air temperature (units:°C) regressed on the standardized time series of (a) EOF1 and(b) EOF2 of WVC during winter for 1979–2017.Stippling in (a) and (b) denote where the anomalies are significant at the 95% confidence levels based on a Student's t-test.
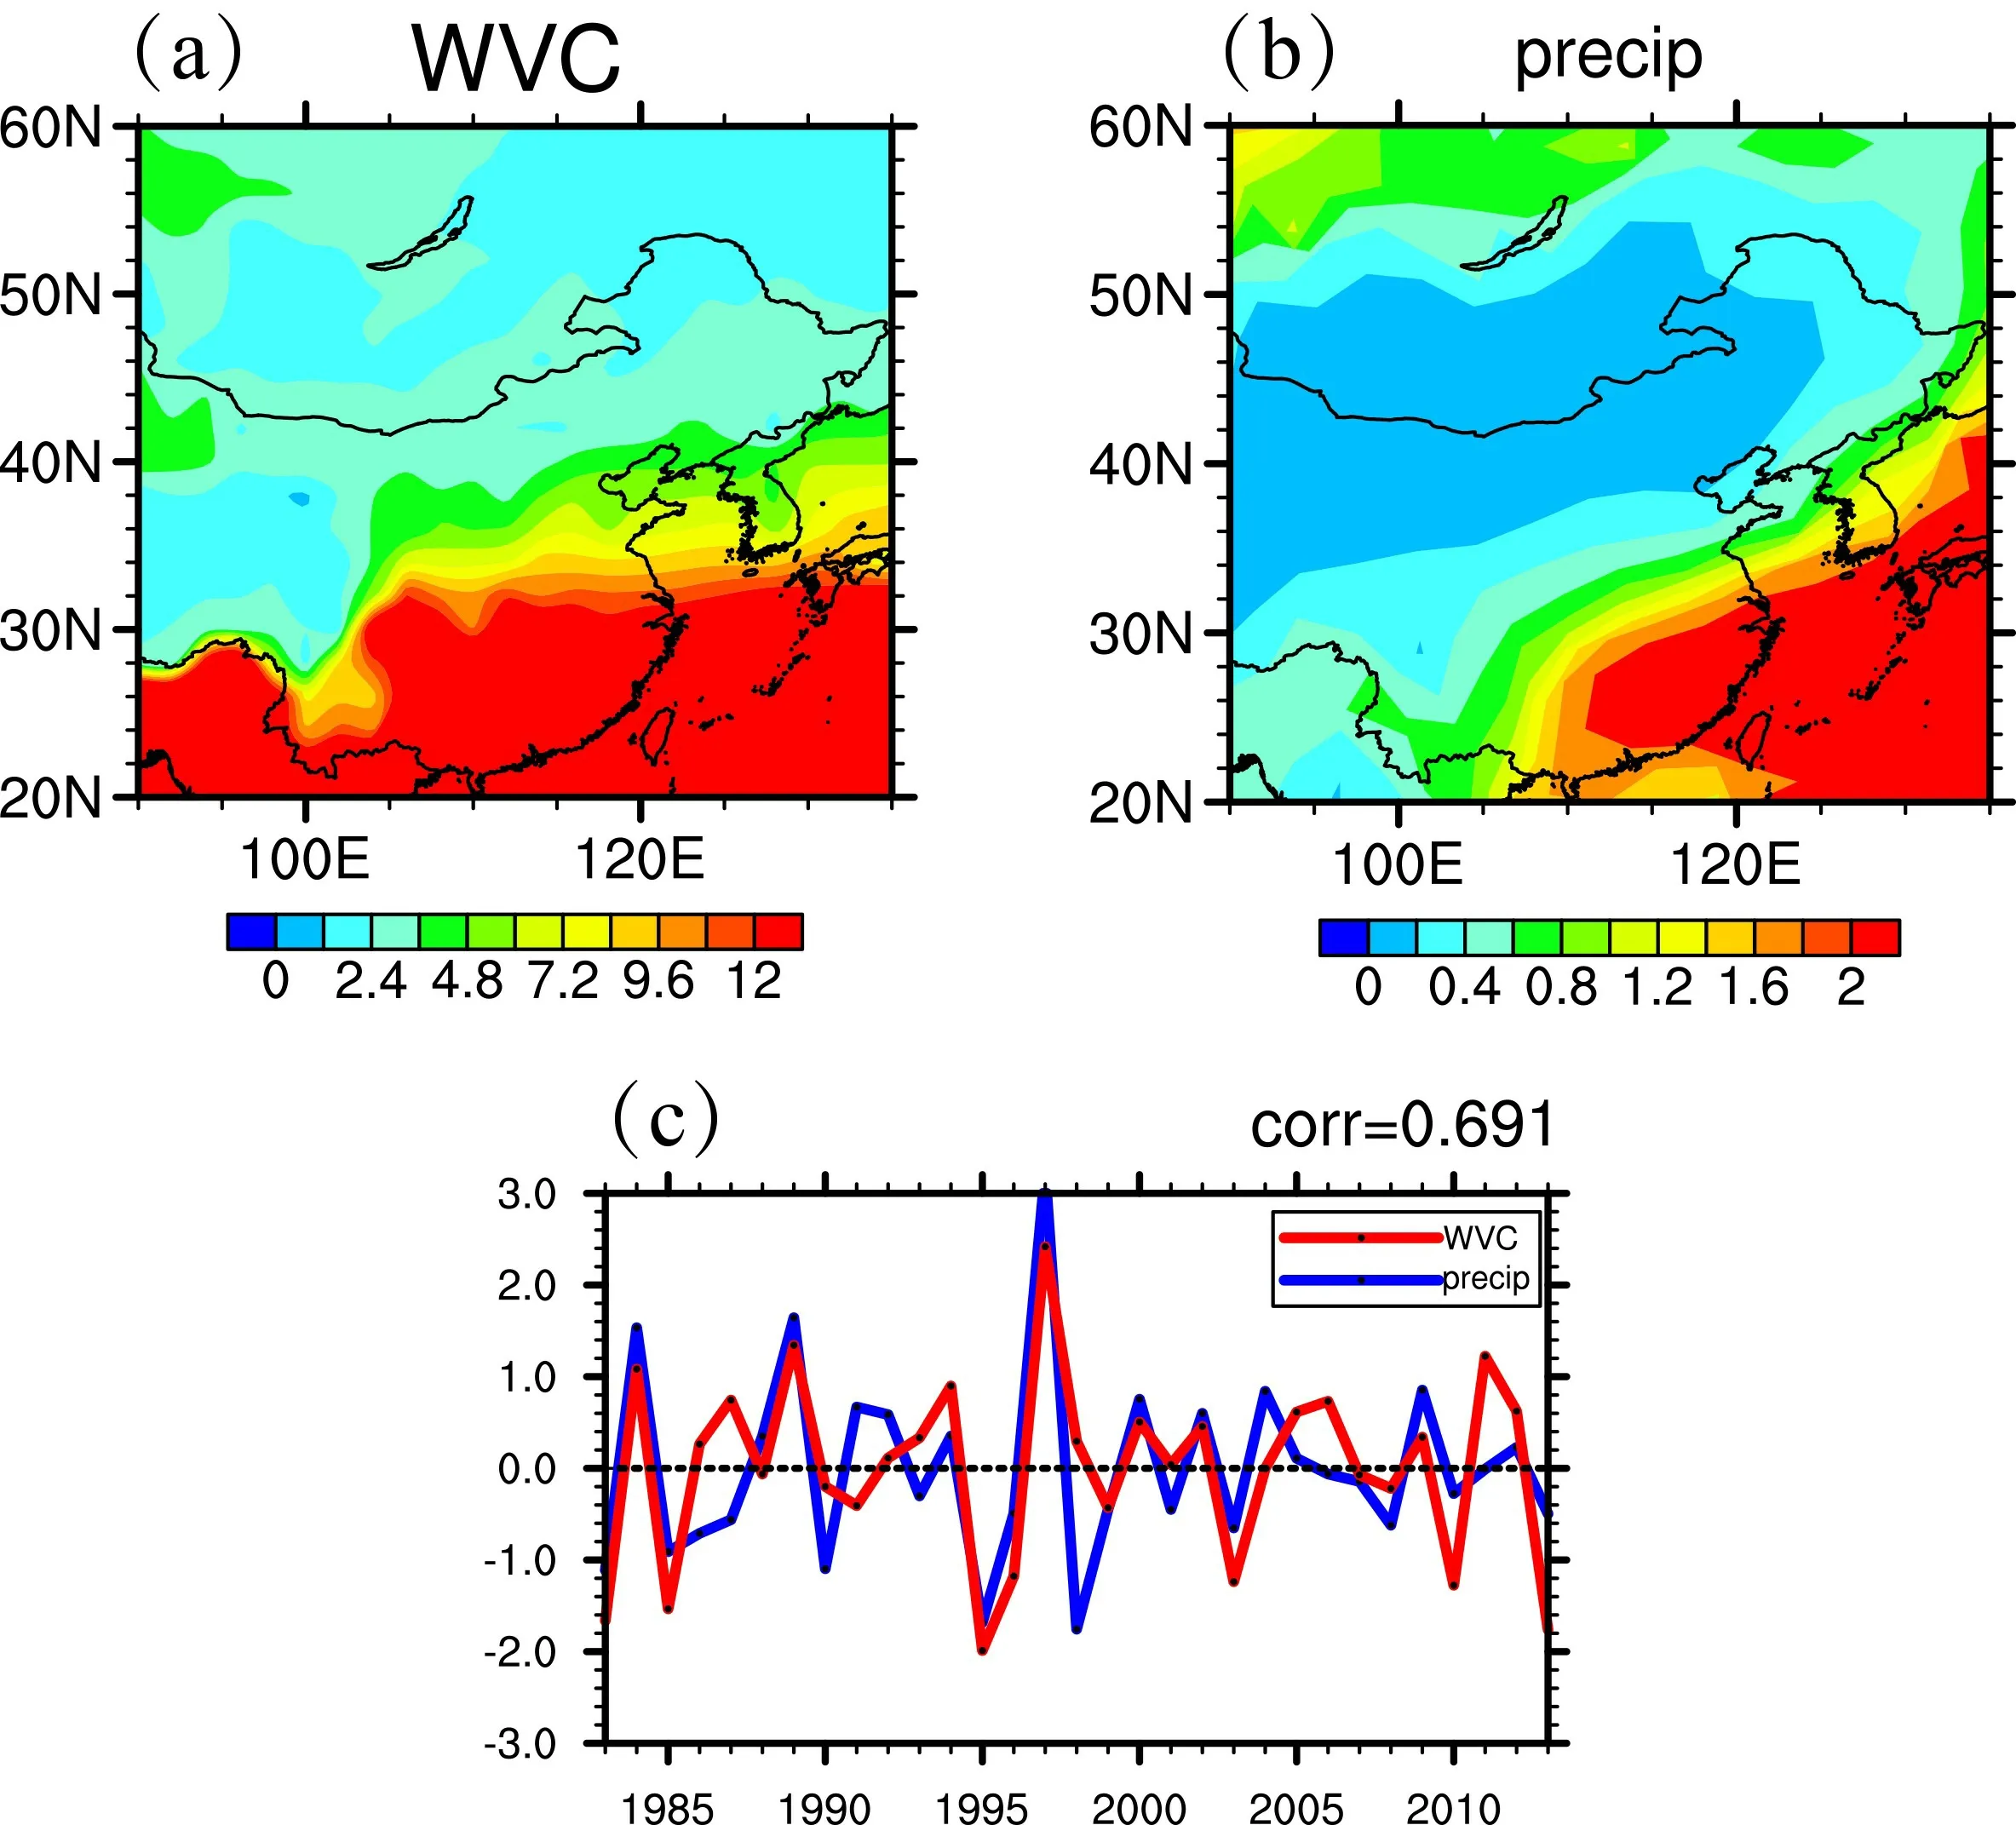
Fig.S2.Climatology of the monthly mean (a) atmospheric WVC (shading;units:kg m–1) and GPCP precipitation(shading;units:mm) during winter over East Asia (20°–60°N,90°–135°E) for 1979–2017.(c) Standardized time series of areal mean WVC (red) and precipitation (blue) during winter over East Asia for 1979–2017,with the correlation coefficient labeled in the top-right corner of the panel.
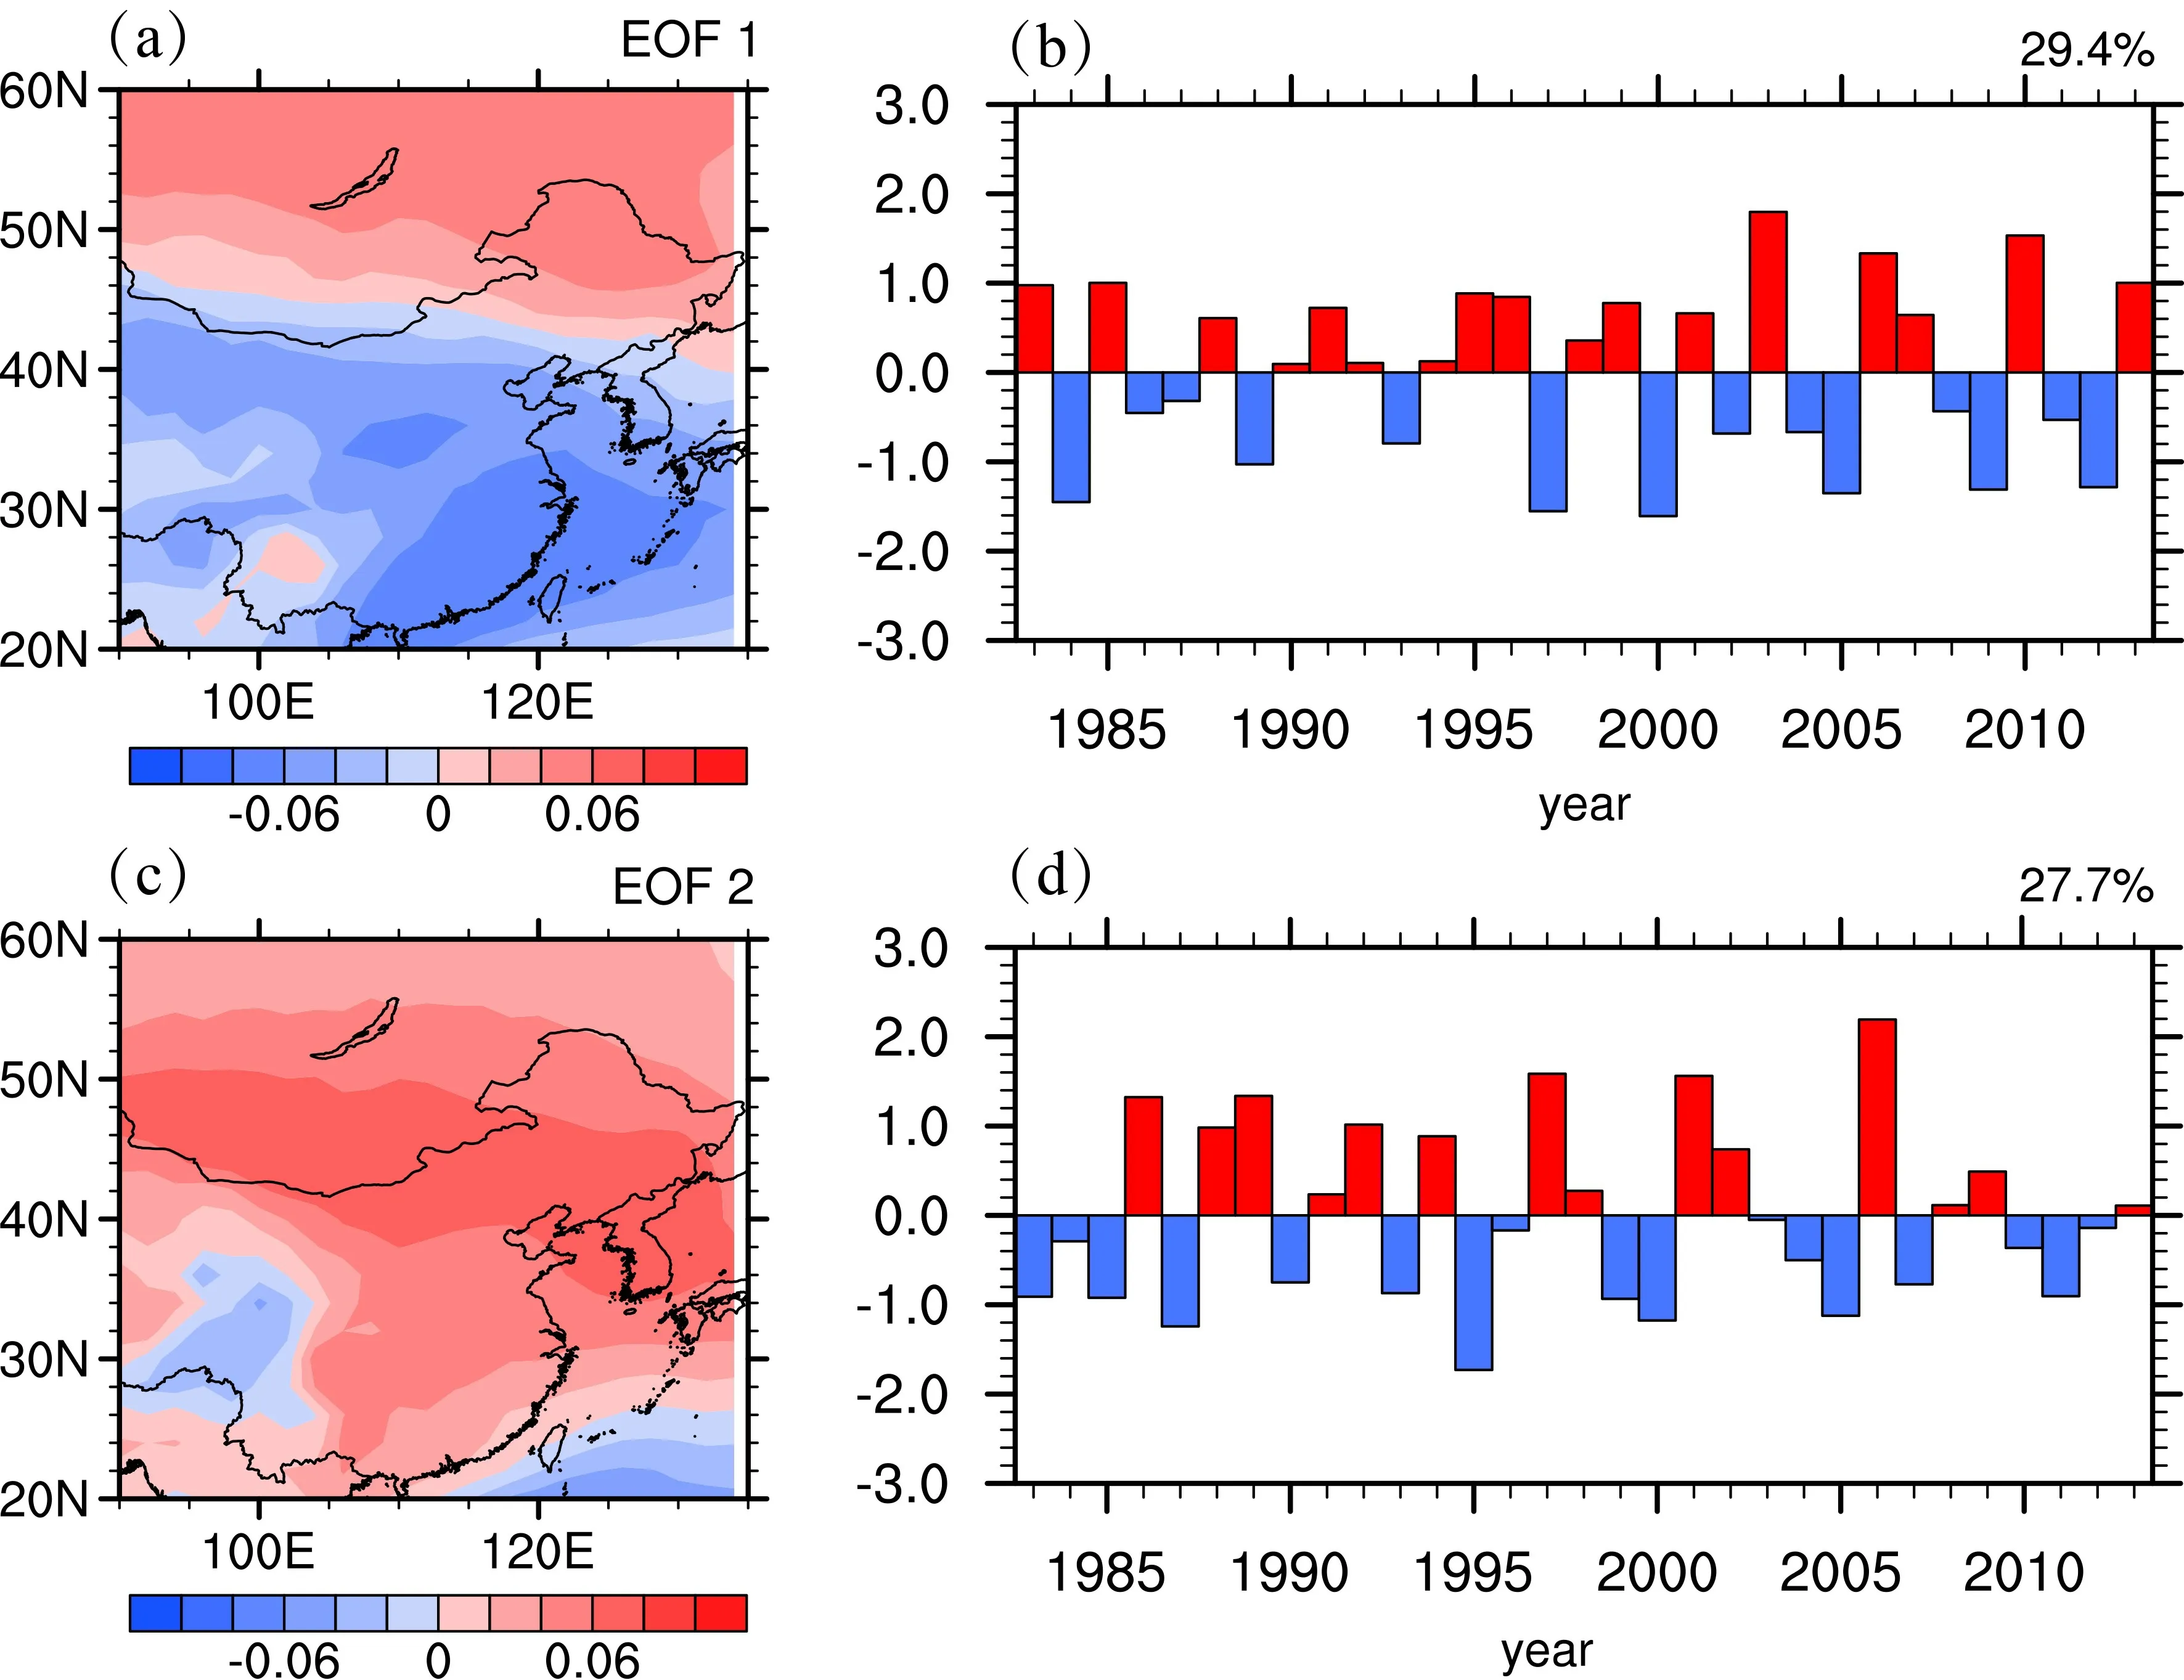
Fig.S3.(a) EOF1 and (c) EOF2 of interannual variability in WVC during winter over East Asia for 1979–2017.(b) and (d) are the standardized time series corresponding to EOF1 and EOF2,respectively.The top-right corners in(b) and (d) are the corresponding percentage of explained variance to the total variance.
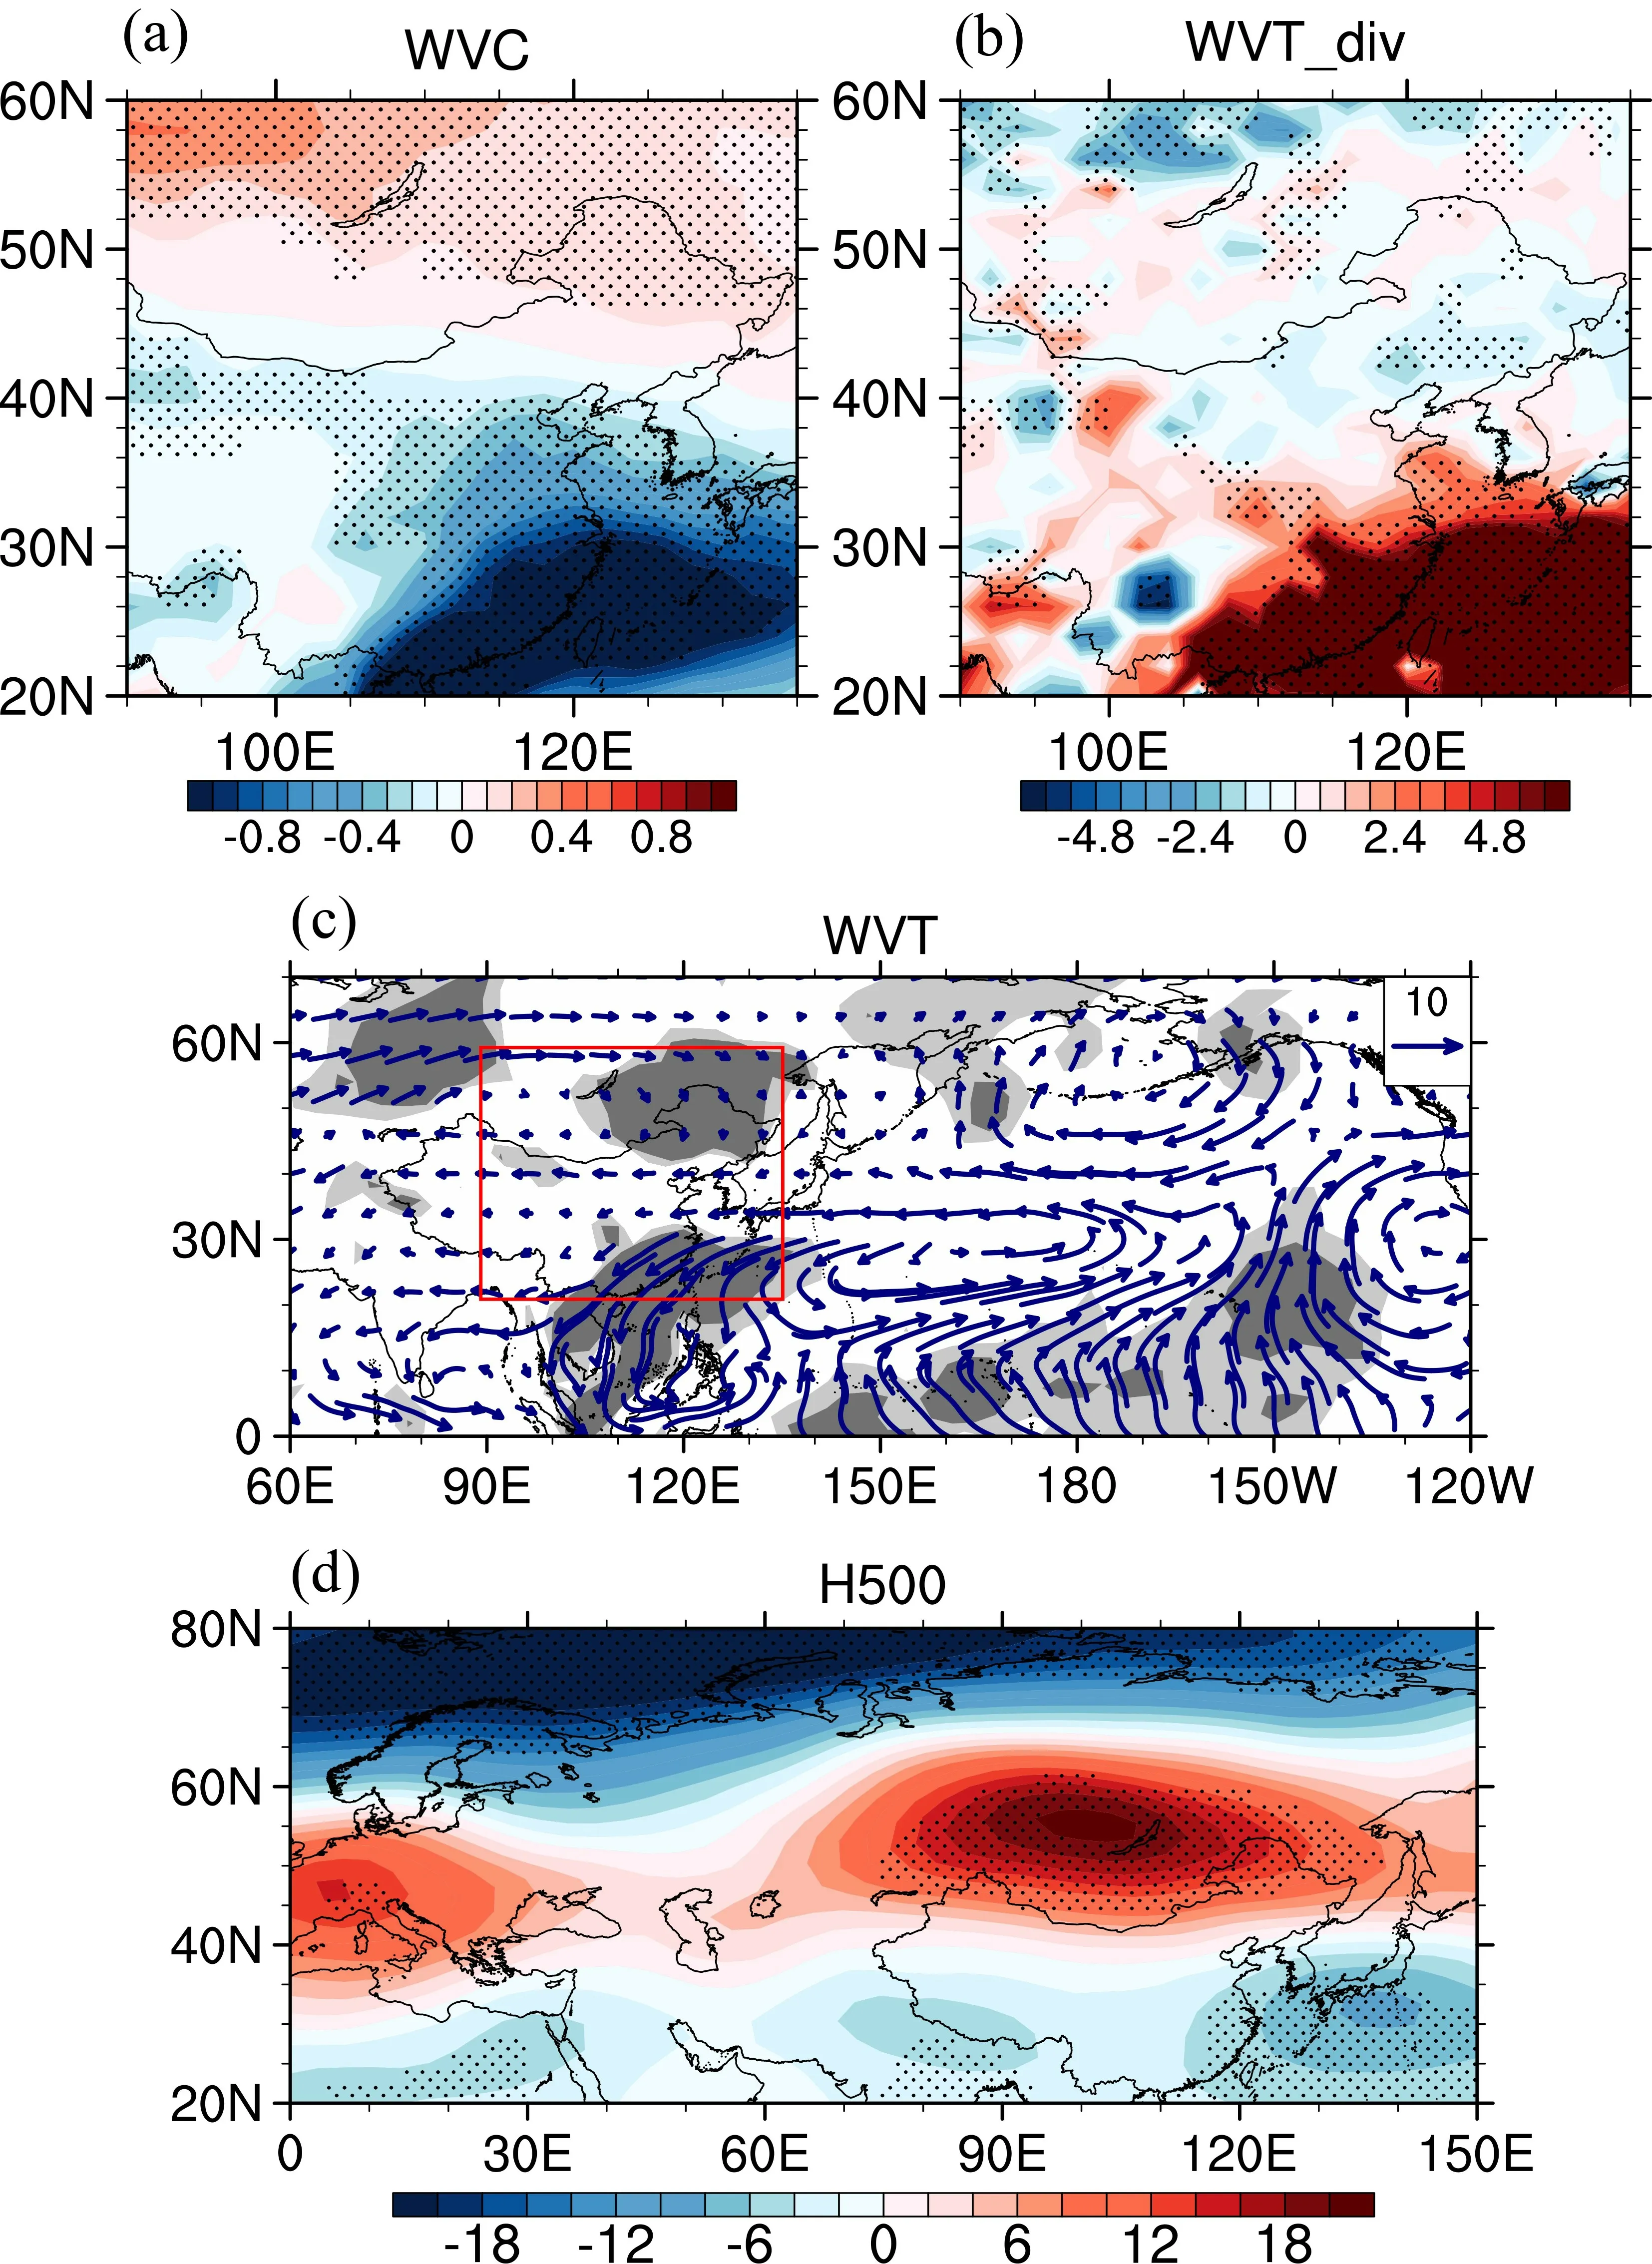
Fig.S4.Anomalies of (a) vertically integrated WVC (units:kg m–1),(b) vertically integrated water vapor flux divergence (units:kg m–2 s–1),(c) vertically integrated WVT (units:kg m–1 s–1) and (d) Z500 (color shading,units:gpm) regressed on the standardized time series of EOF1 of WVC during winter for 1979–2017 and the associated wave activity flux (units:m2 s−2,vector).Stippling in (a),(b),and (d) and color shading in (c) denote where the anomalies are significant at the 95% confidence levels based on a Student's t-test.The red rectangle in (c) represents the domain of EA region.
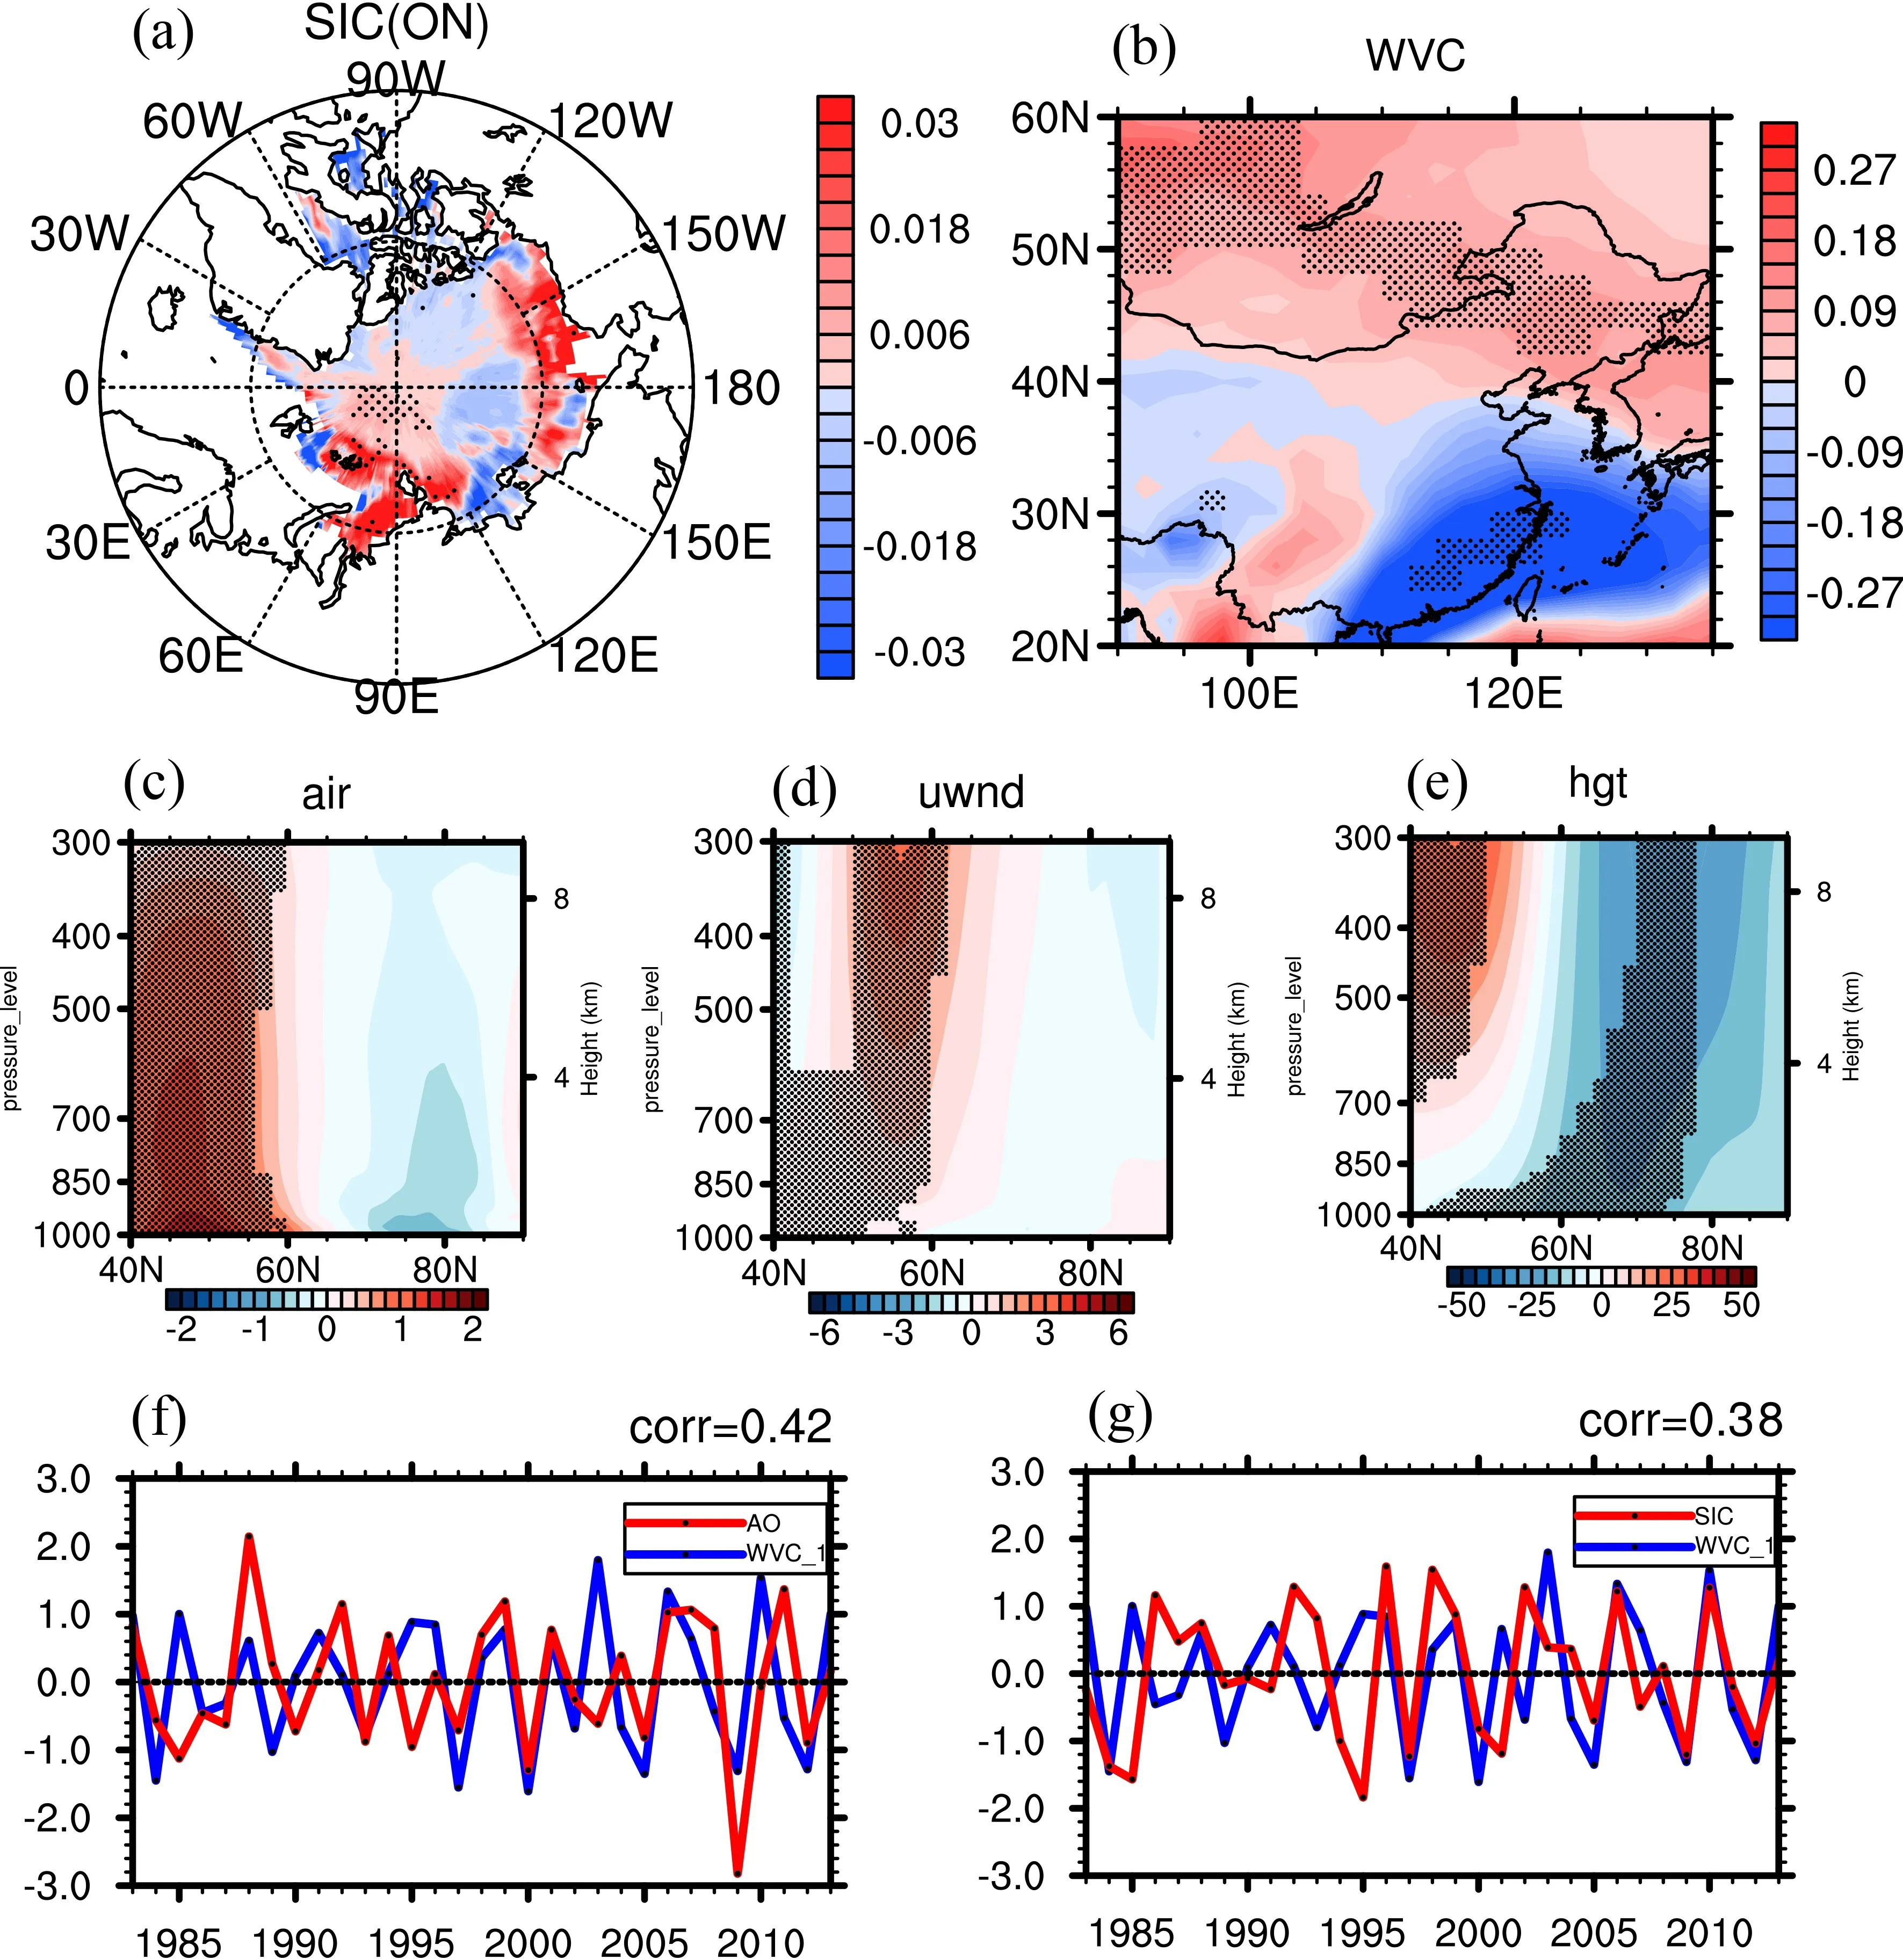
Fig.S5.(a) Anomalies of monthly mean SIC in ON regressed on the standardized time series of EOF1 of WVC during winter for 1979–2017.Anomalies of (b) vertically integrated WVC regressed on the time series of mean SICKSBS in ON for 1979–2017.Anomalies of the zonal mean (c) air temperature (units:°C),(d) zonal wind (units:m s–1),and (e) Z500 (units:gpm) averaged over (20°–90°E) during winter.Stippling in (a)–(e) denotes where the anomalies are significant at the 95% confidence level based on a Student’s t-test.Also shown are the standardized time series of (f) EOF1 of WVC (blue) and AO index (red) and (g) EOF1 of WVC (blue) and mean SIC-KSBS in ON (red),with the correlation coefficient labeled in the top-right corner of the panel.
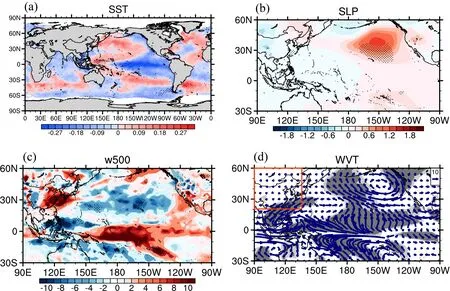
Fig.S6.Anomalies of (a) SST (units:°C),(b) sea level pressure (SLP,units:hPa) and (c) the 500-hPa vertical velocity (units:10–3 Pa s–1) regressed on the standardized time series of EOF2 of WVC during winter for 1979–2017.(d) Anomalies of the vertically integrated WVT (units:kg m–1 s–1) regressed on the sign-reversed Niño-3index during winter for 1979–2017.Stippling in (a)–(c) and shading in (d) denote where the anomalies are significant at the 95% confidence levels based on a Student’s t-test.The red rectangle in (d) represents the domain of EA region.
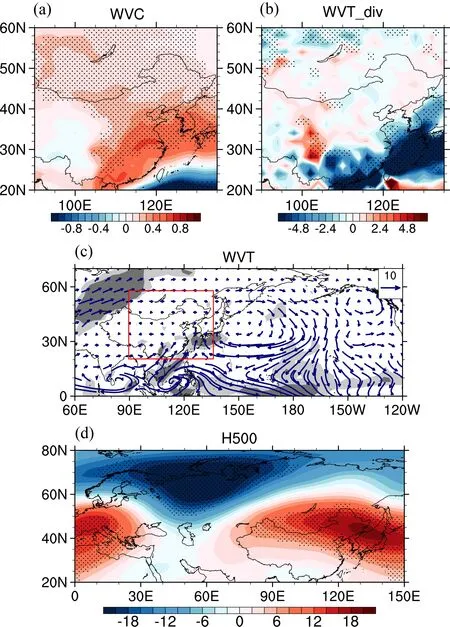
Fig.S7.Anomalies of the (a) vertically integrated WVC (units:kg m–1),(b) vertically integrated water vapor flux divergence (units:kg m–2 s–1),(c) vertically integrated WVT (units:kg m–1 s–1),and (d) Z500 (units:gpm) regressed on the standardized time series of EOF2 of WVC during winter for 1979–2017.Stippling in (a),(b),and (d) and shading in (c) denote where the anomalies are significant at the 95% confidence levels based on a Student's t-test.The red rectangle in (c) represents the domain of EA region.
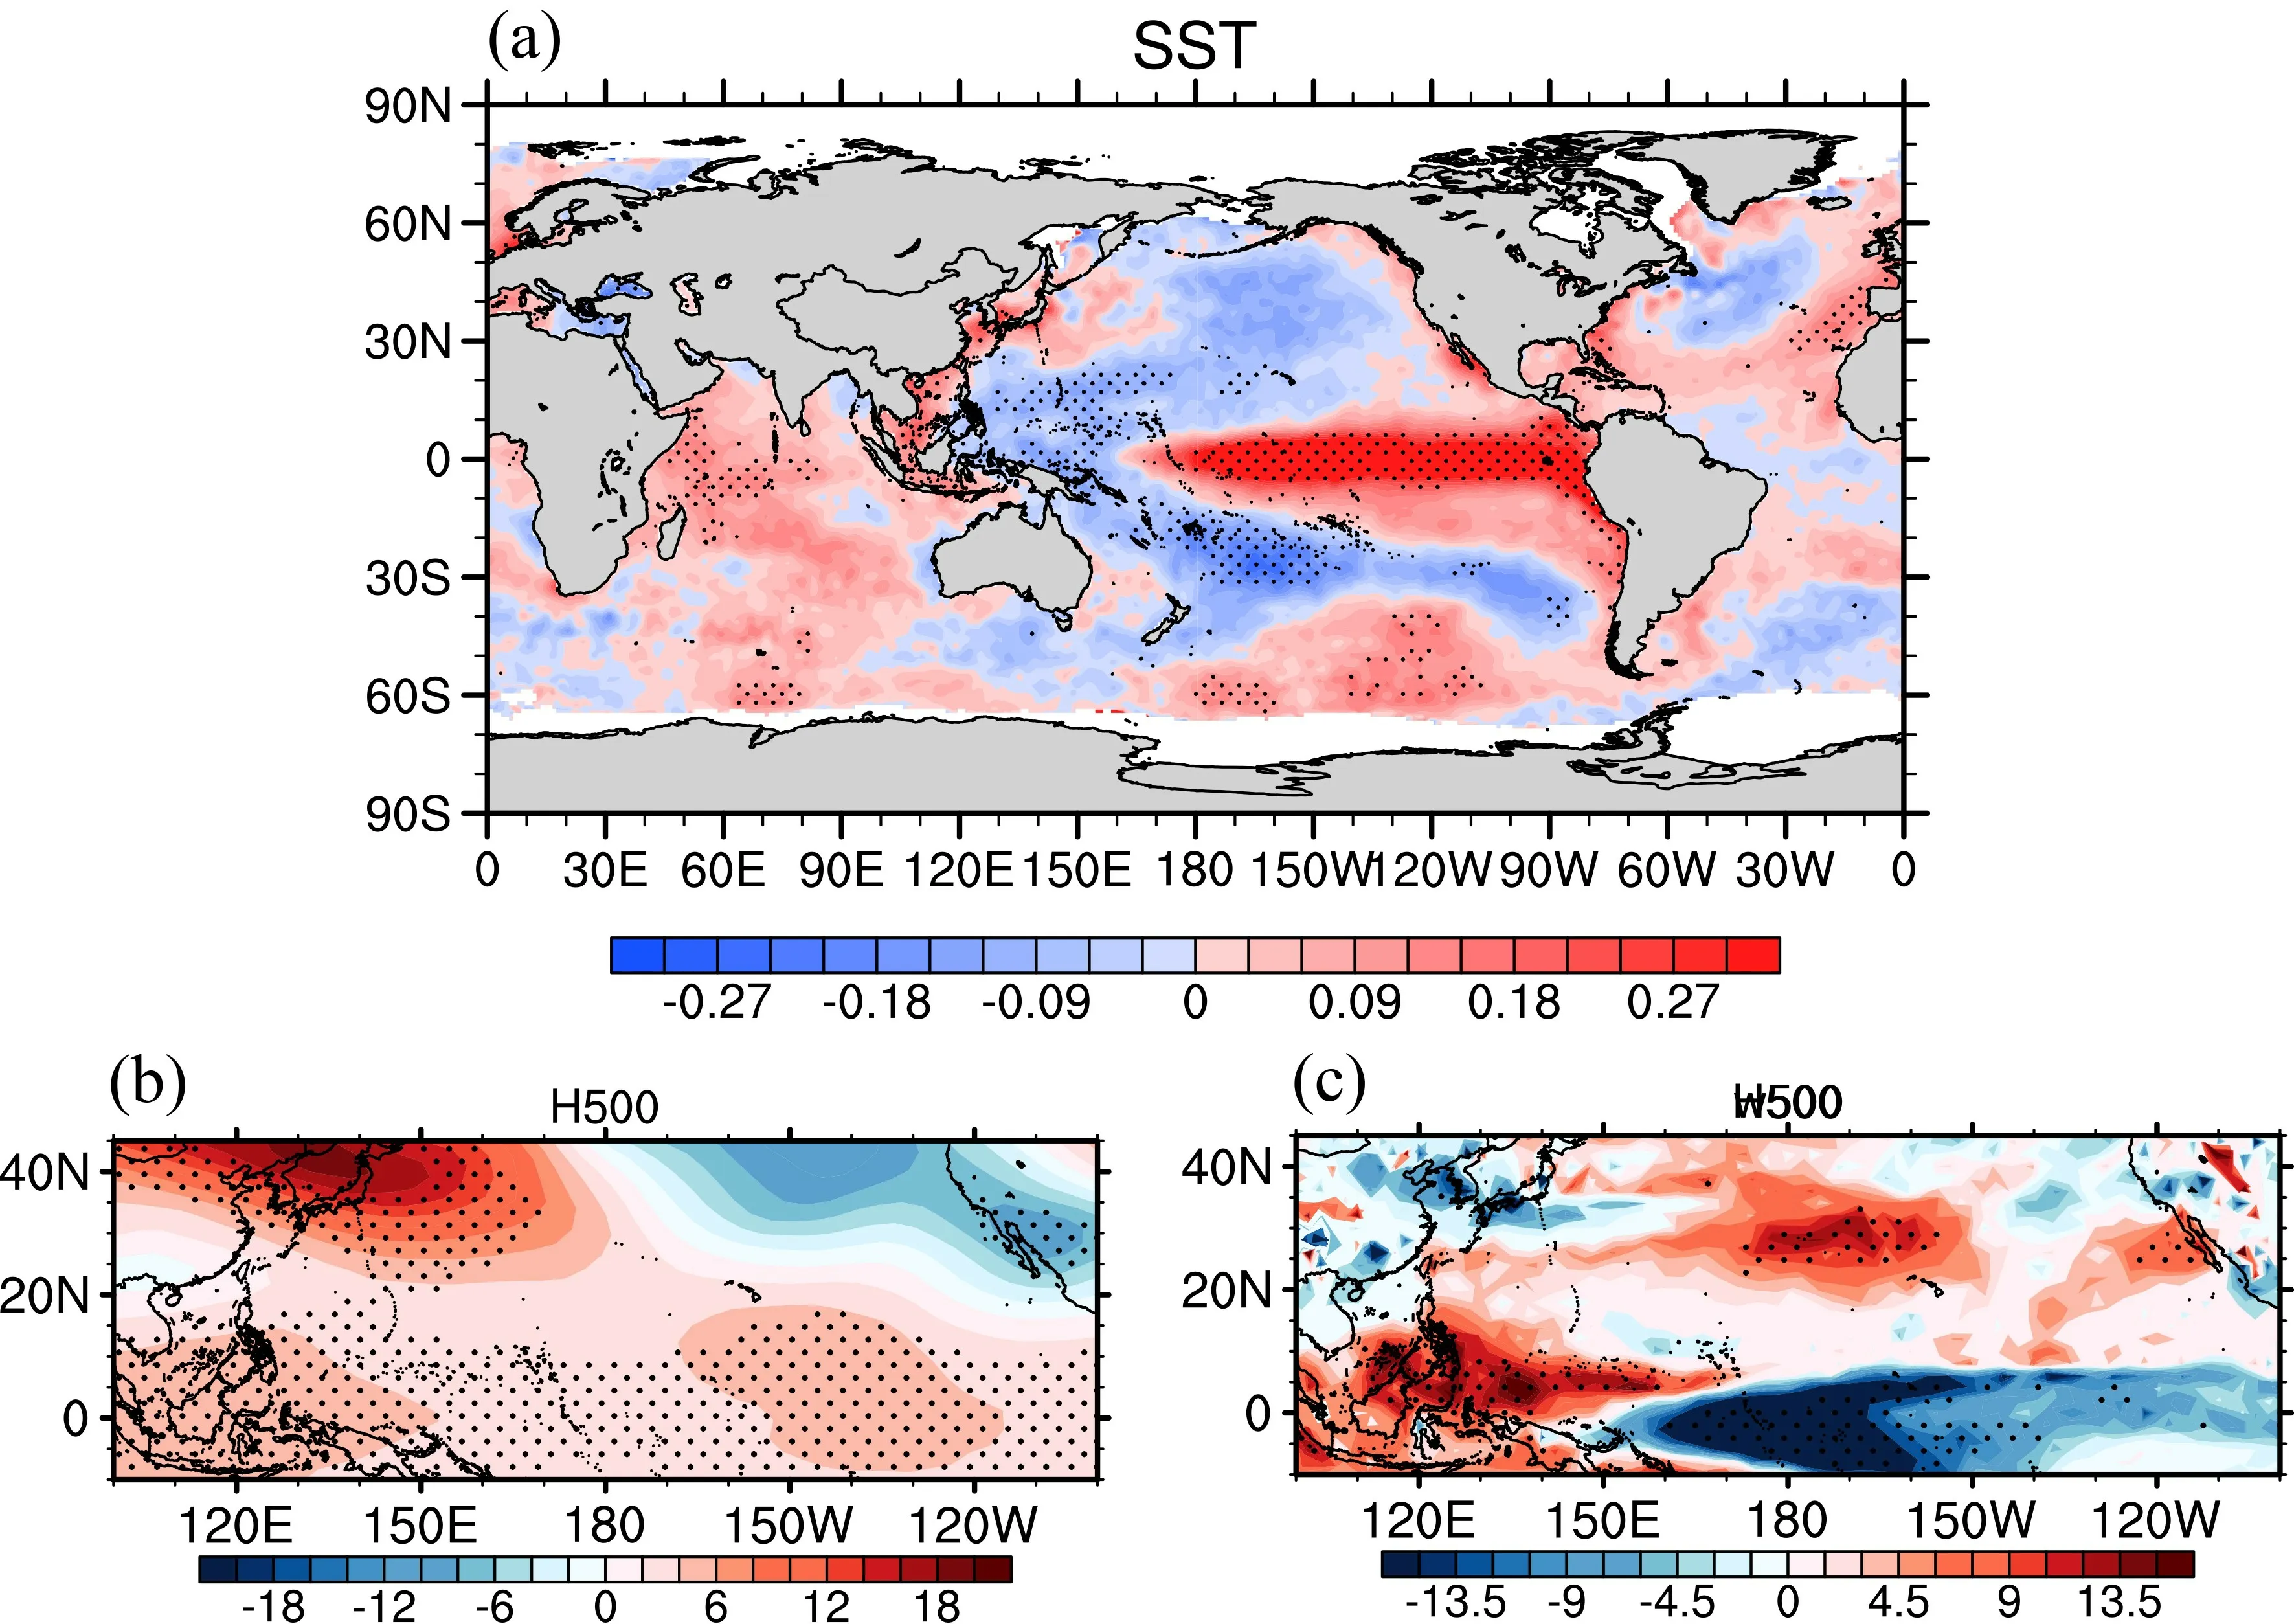
Fig.S8.Anomalies of (a) SST (units:°C),(b) Z500 (units:gpm),and (c) 500-hPa vertical velocity (units:10–3 Pa s–1) regressed on the standardized time series of EOF2 of WVC during winter for 1979–2017.Stippling in (a)–(c)denotes where the anomalies are significant at the 95% confidence levels based on a Student's t-test.
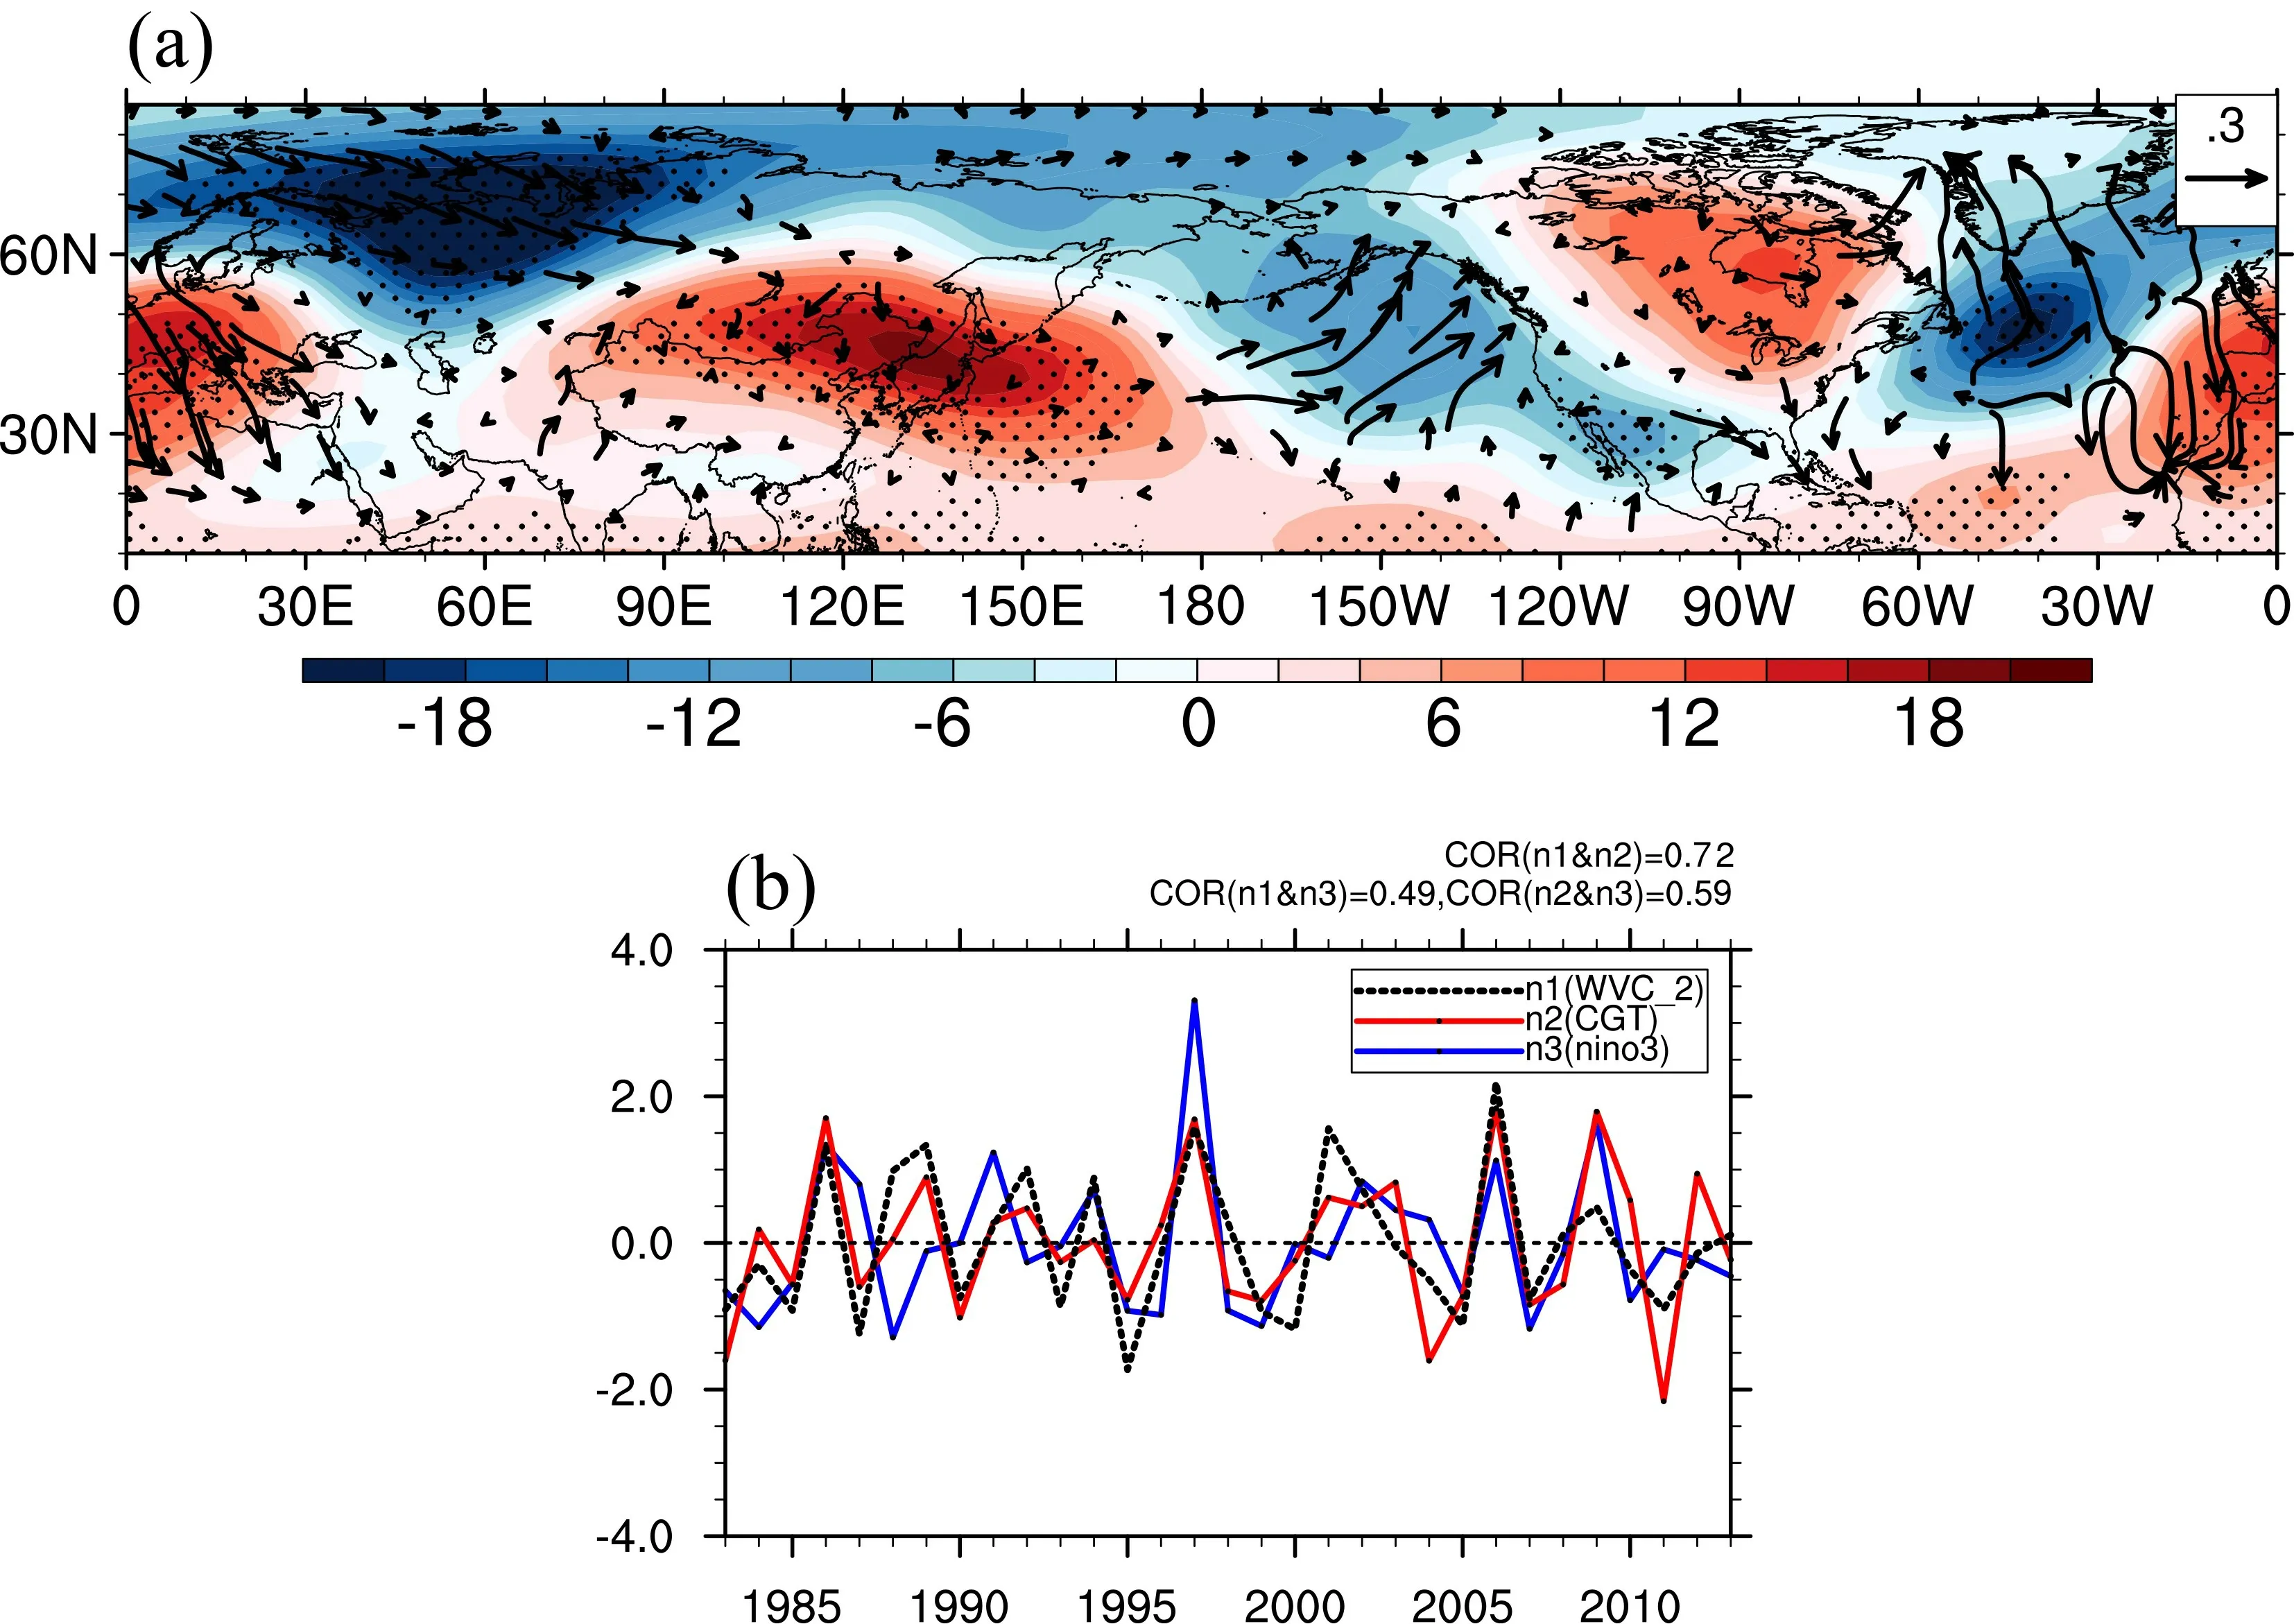
Fig.S9.Anomalies of (a) Z500 (units:gpm,shade) regressed on the standardized time series of EOF2 of WVC during winter for 1979–2017 and the associated wave activity flux (units:m2 s−2,vector).Stippling in(a) denotes where the anomalies are significant at the 95% confidence level based on a Student's t-test.(b)Standardized time series of EOF2 of WVC (black),CGT index (red),and Niño-3 index (blue),with the correlation coefficient labeled in the top-right corner of the panel.
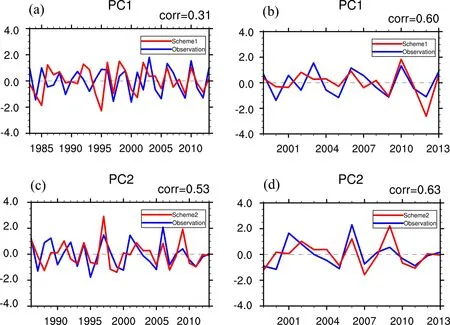
Fig.S10.Standardized time series of predicted (red) and observed (blue) PC1 of WVC in (a) the cross-validation test for the period 1983–2013 and (b) the independent hindcasts for the period 1999–2013,with the correlation coefficient labeled in the top-right corner of the panel.Standardized time series of predicted (red) and observed(blue) PC2 of WVC in (c) the cross-validation test for the period 1986–2013 and (d) the independent hindcasts for the period 1999–2013,with the correlation coefficient labeled in the top-right corner of the panel.
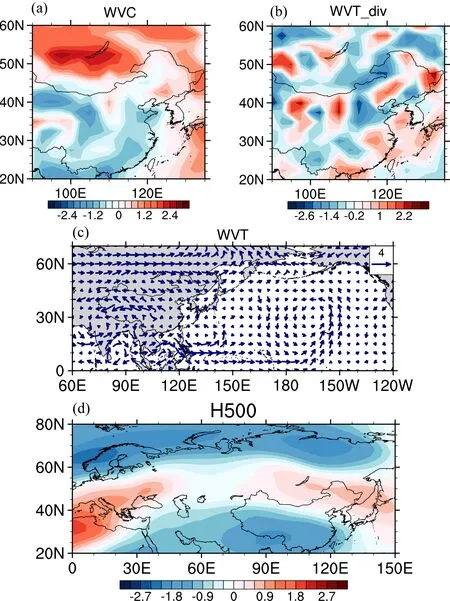
Fig.S11.Monthly mean anomalies of (a) vertically integrated WVC (units:kg m–1),(b) vertically integrated water vapor flux divergence (units:kg m–2 s–1),(c) vertically integrated WVT (units:kg m–1 s–1) and (d) Z500 (color shading,units:gpm) during the winter of 2006 with respect to climatology for 1979–2017.
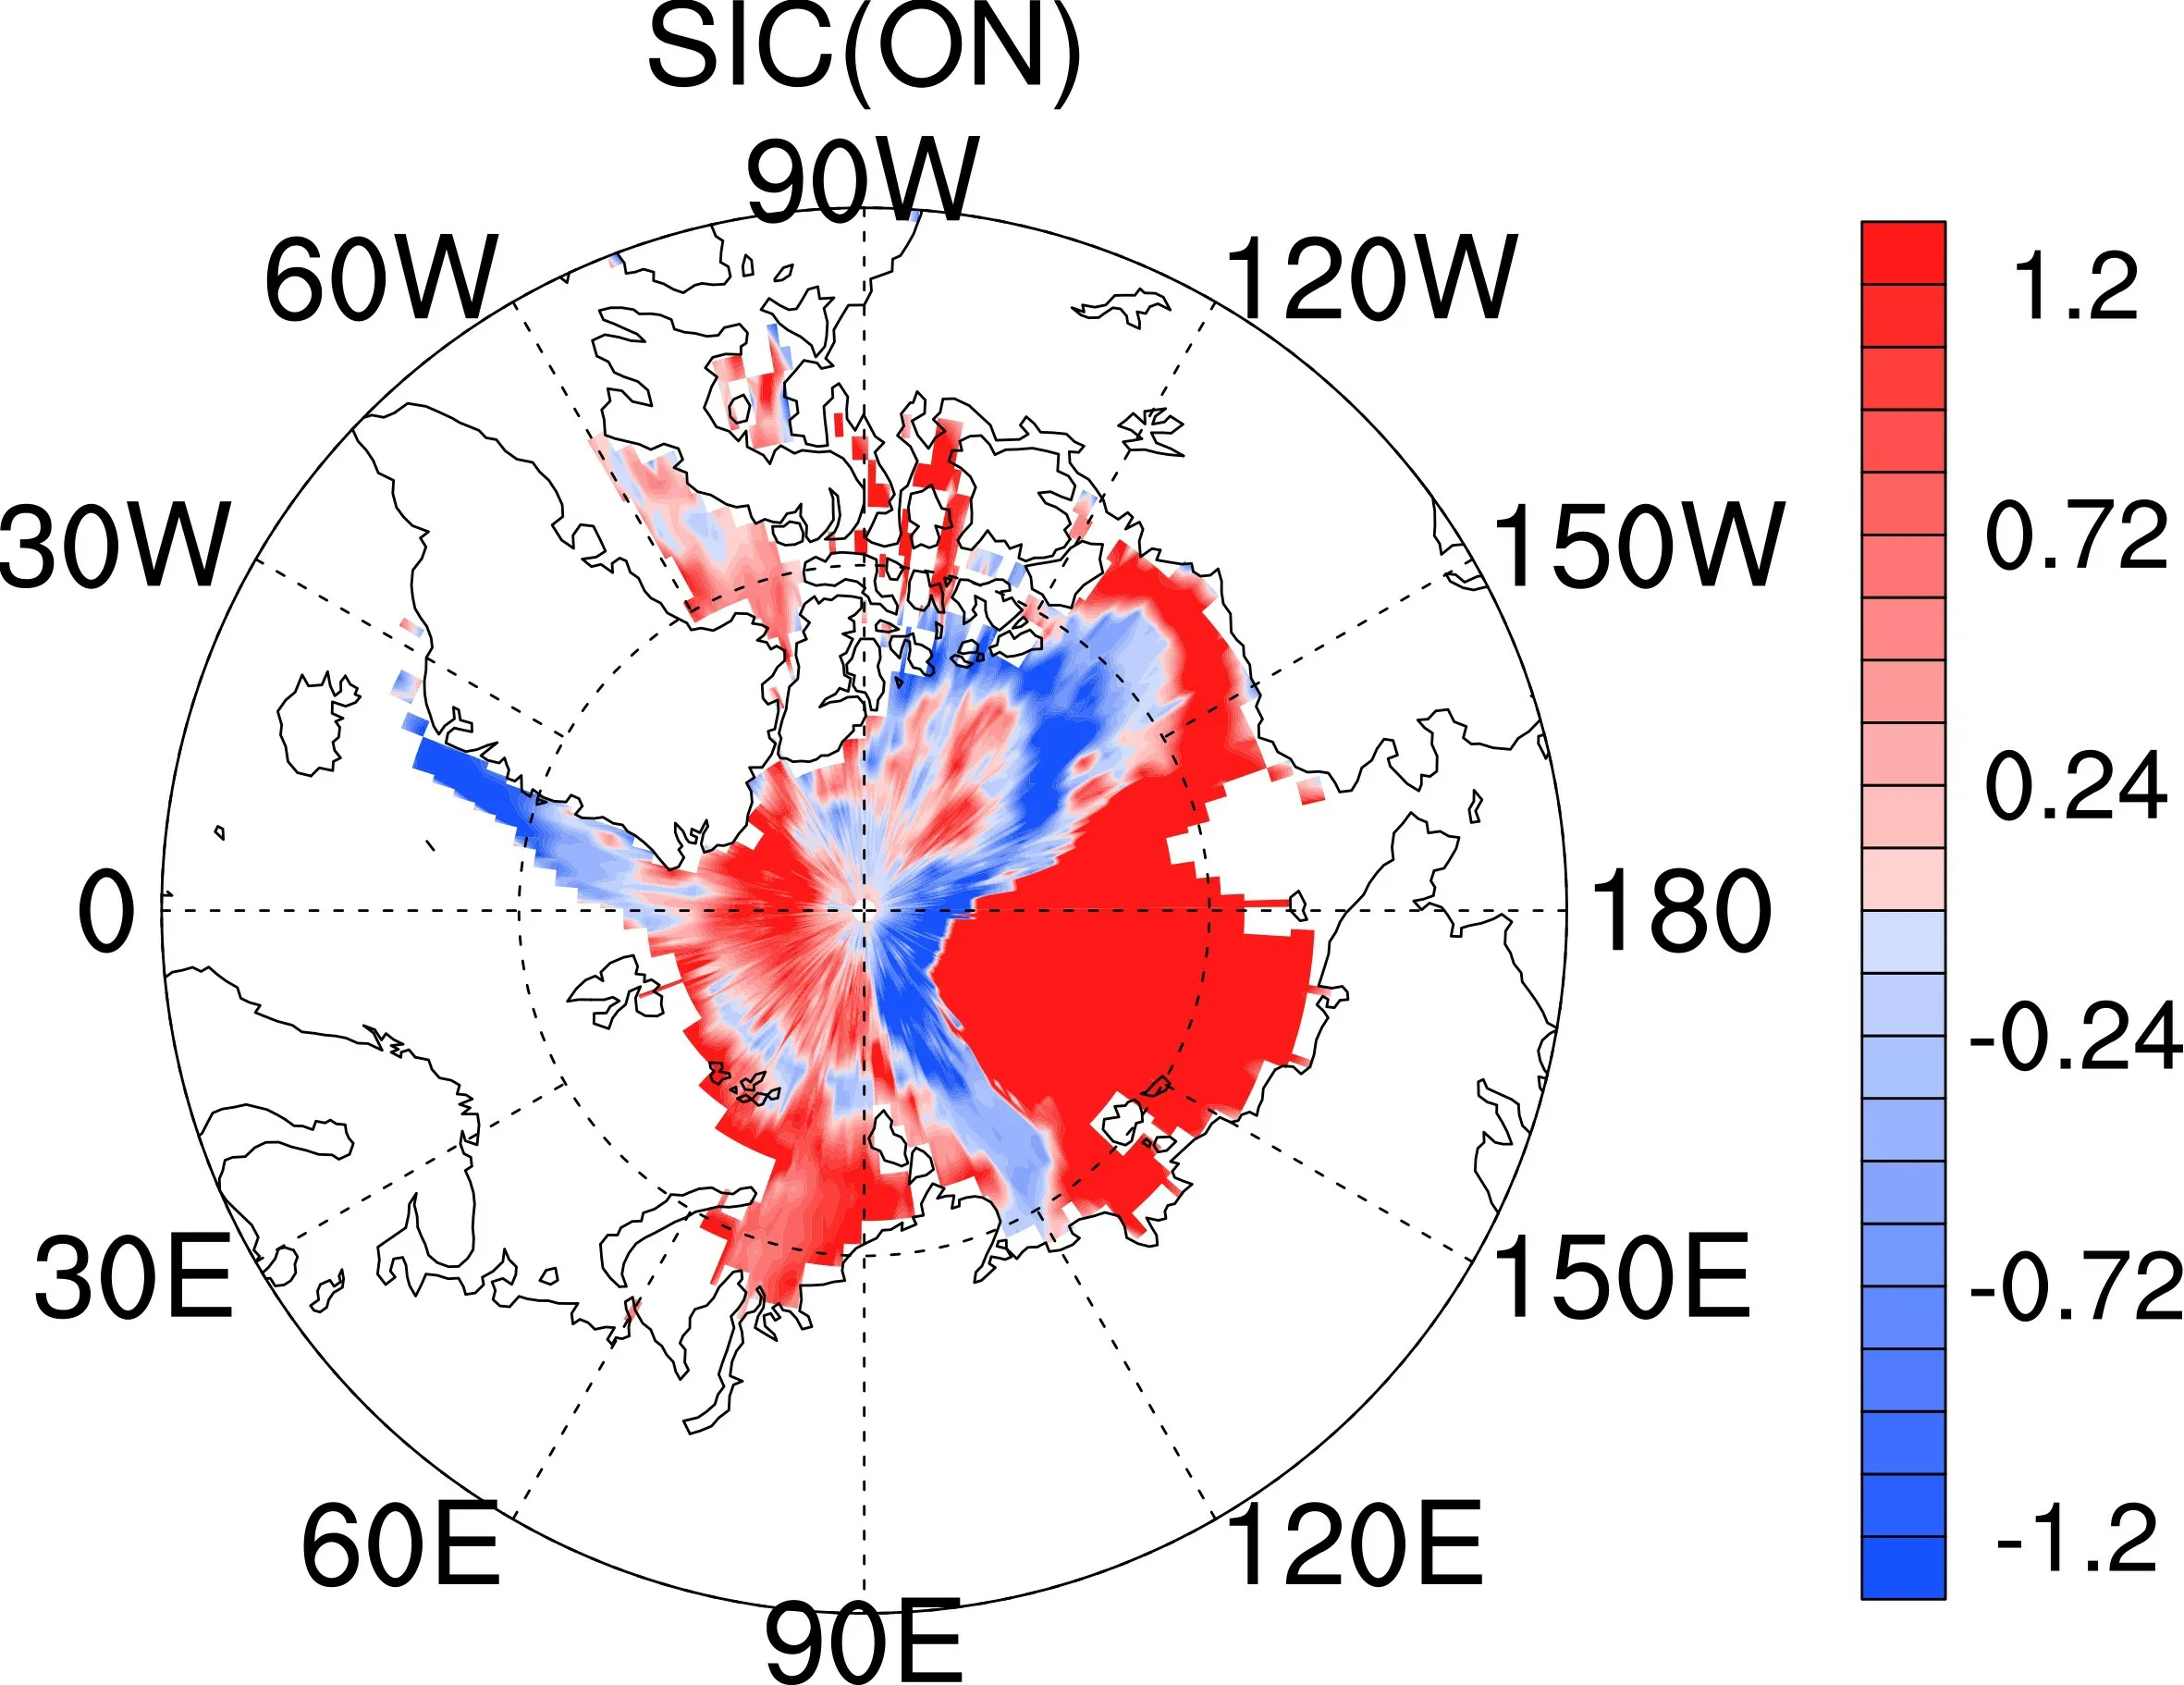
Fig.S12.Monthly mean anomalies of SIC in ON during the winter of 2006 with respect to climatology for 1979–2017.

Fig.S13.Monthly mean anomalies of (a) vertically integrated WVC (units:kg m–1),(b) vertically integrated water vapor flux divergence (units:kg m–2 s–1),(c) vertically integrated WVT (units:kg m–1 s–1),and (d) Z500 (color shading,units:gpm) during the winter of 2007 with respect to climatology for 1979–2017.
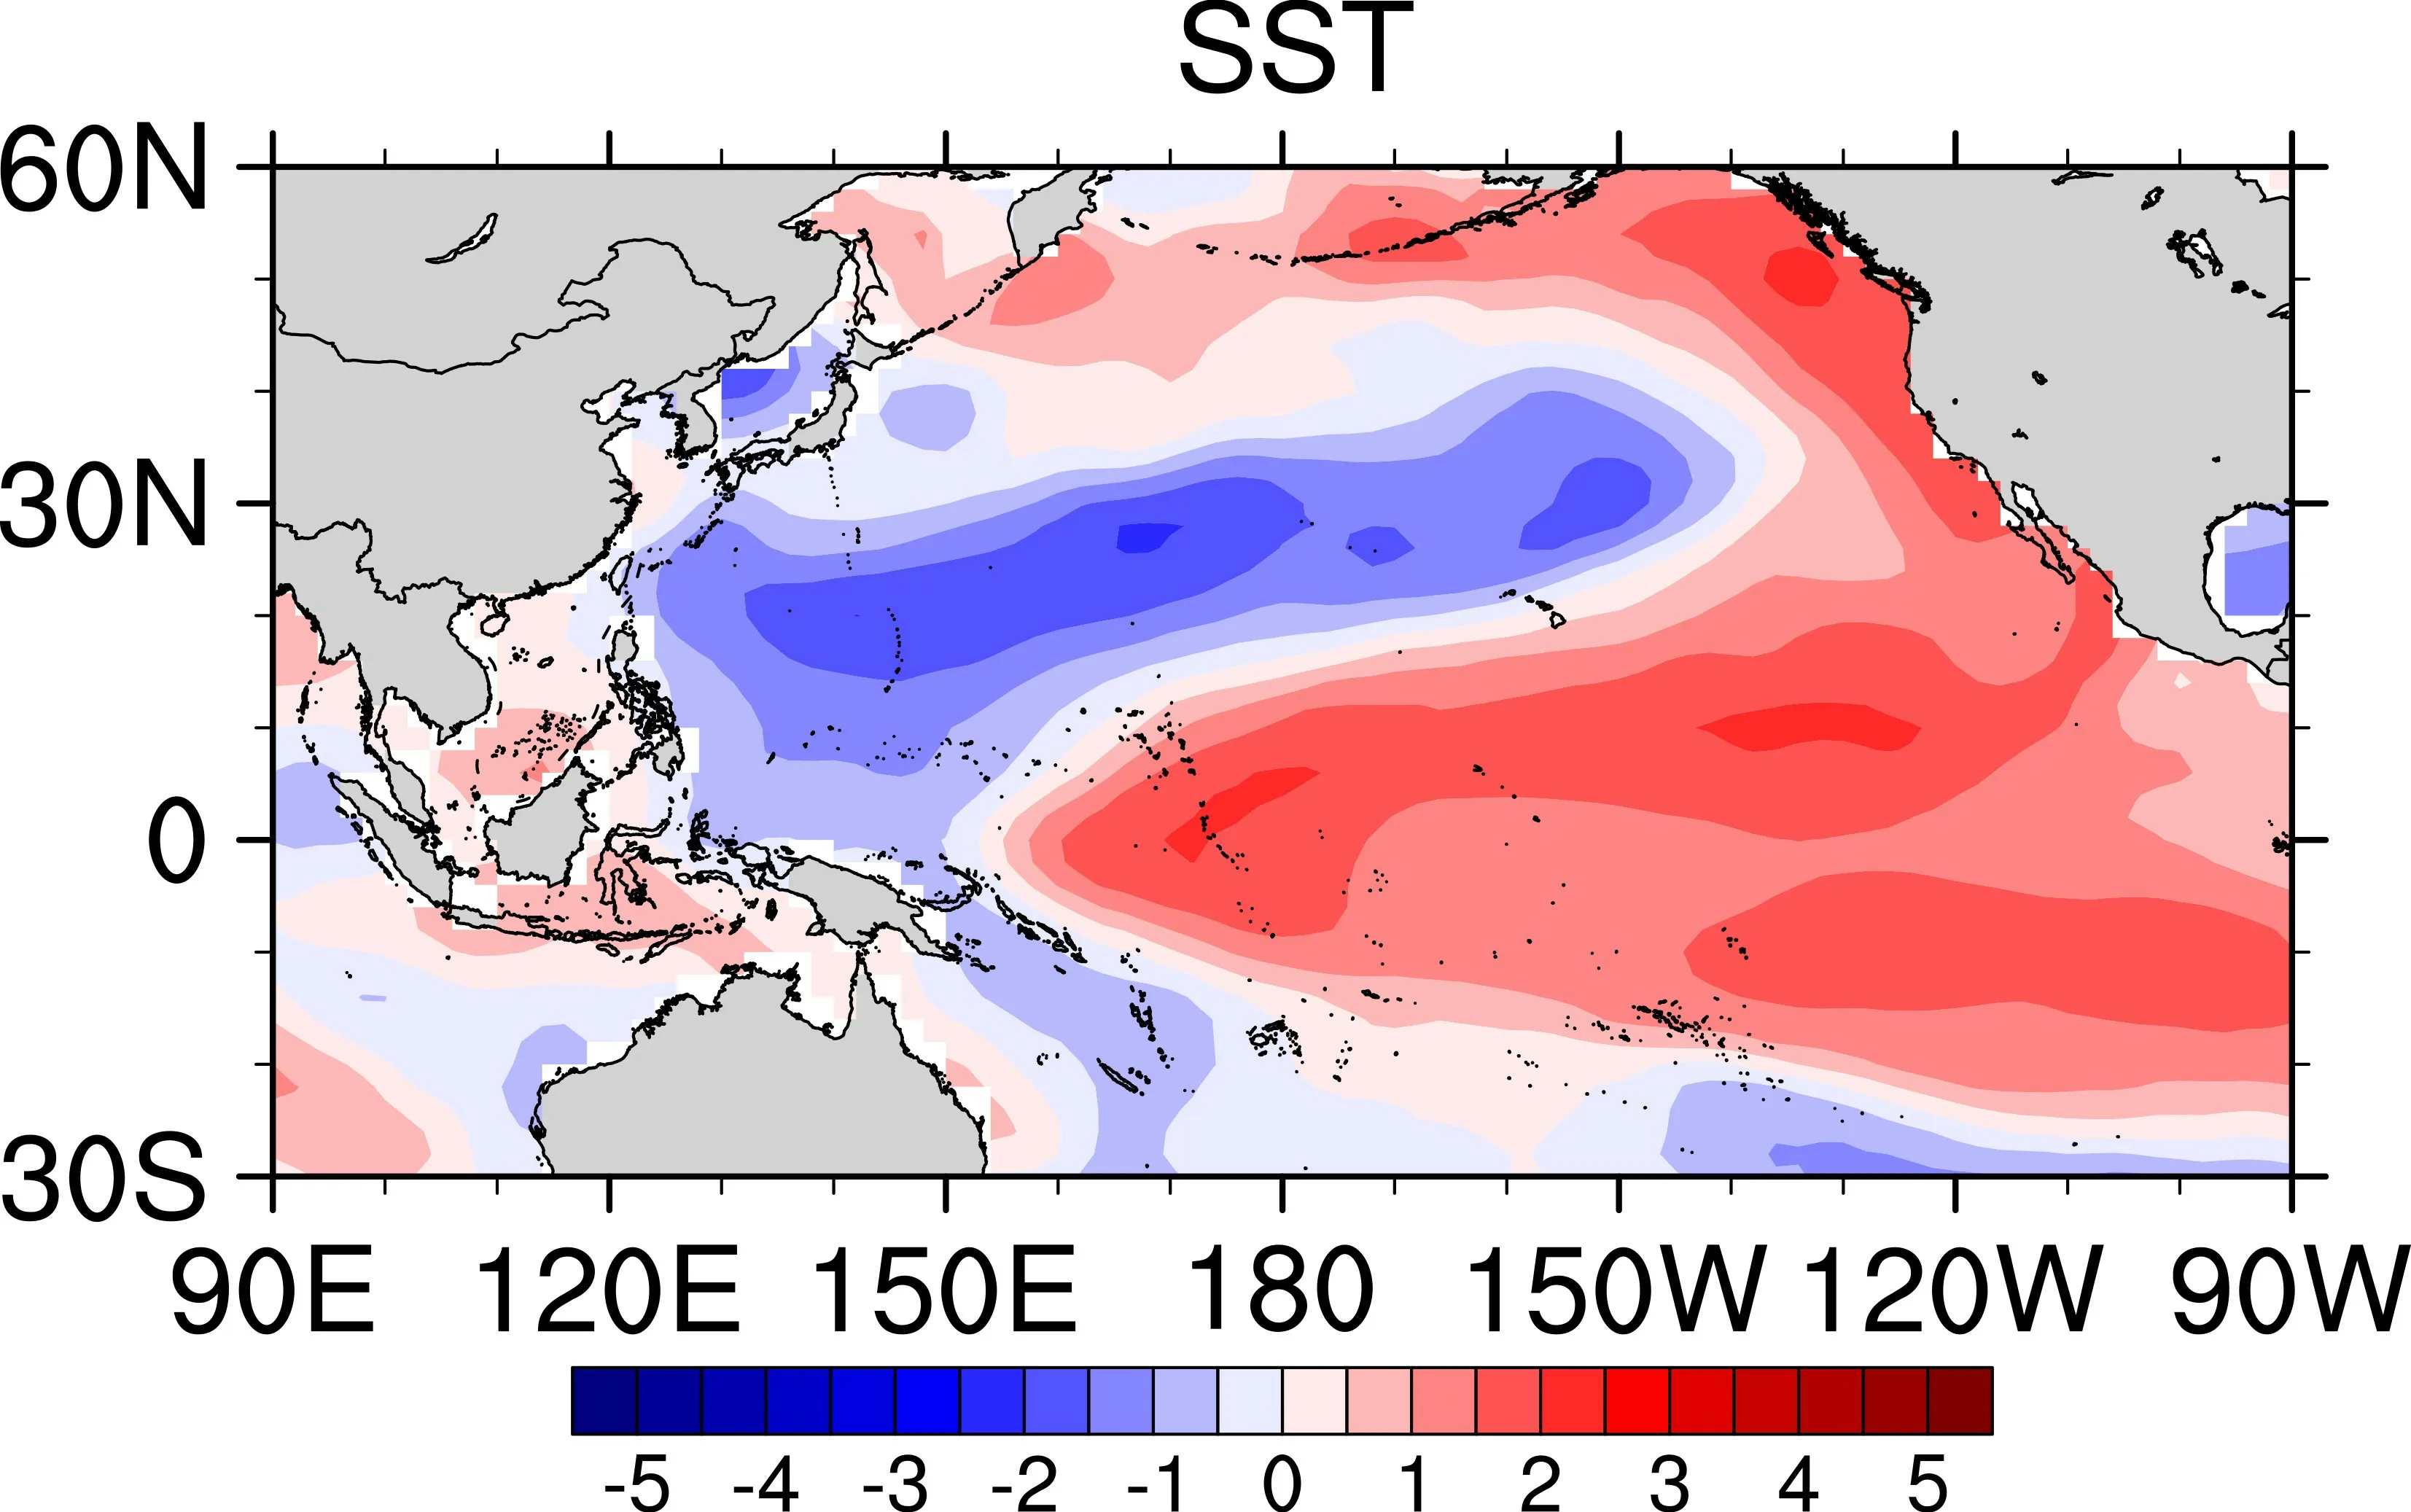
Fig.S14.Monthly mean anomalies of SST (units:℃) during the winter of 2007 with respect to climatology for 1979–2017.
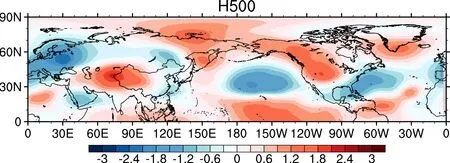
Fig.S15.Monthly mean anomalies of Z500 (shading;units:gpm) during the winter of 2007 with respect to climatology for 1979–2017.
杂志排行
Advances in Atmospheric Sciences的其它文章
- China’s EarthLab—Forefront of Earth System Simulation Research
- On the Importance of High-Resolution in Large-Scale Ocean Models
- Projected Increase in Probability of East Asian Heavy Rainy Summer in the 21st Century by CMIP5 Models
- Controls on the Northward Movement of the ITCZ over the South China Sea in Autumn:A Heavy Rain Case Study
- Changes of Extreme Precipitation and its Associated Mechanisms in Northwest China
- All-sky Data Assimilation of MWTS-2 and MWHS-2 in the Met Office Global NWP System.
