Visualization analysis of lecithin in drugs based on electrochemiluminescent single gold microbeads
2021-09-14GenLiuPeiLongWngHuiGo
Gen Liu , Pei-Long Wng , Hui Go ,**
a College of Chemistry and Material Science, Huaibei Normal University, Huaibei, 235000, Anhui, China
b Henan Key Laboratory of Biomolecular Recognition and Sensing, Shangqiu Normal University, Shangqiu, 476000, Henan, China
c State Key Laboratory of Analytical Chemistry for Life Science, Nanjing University, Nanjing, 210023, China
Keywords:Lecithin Single particle Visualization analysis Electrochemiluminescence
ABSTRACT Fast and high-throughput determination of drugs is a key trend in clinical medicine.Single particles have increasingly been adopted in a variety of photoanalytical and electroanalytical applications, and microscopic analysis has been a hot topic in recent years,especially for electrochemiluminescence(ECL).This paper describes a simple ECL method based on single gold microbeads to image lecithin. Lecithin reacts to produce hydrogen peroxide under the successive enzymatic reaction of phospholipase D and choline oxidase. ECL was generated by the electrochemical reaction between a luminol analog and hydrogen peroxide, and ECL signals were imaged by a camera. Despite the heterogeneity of single gold microbeads, their luminescence obeyed statistical regularity. The average luminescence of 30 gold microbeads is correlated with the lecithin concentration, and thus, a visualization method for analyzing lecithin was established. Calibration curves were constructed for ECL intensity and lecithin concentration, achieving detection limits of 0.05 mM lecithin. This ECL imaging platform based on single gold microbeads exhibits outstanding advantages,such as high throughput,versatility and low cost,and holds great potential in disease diagnostics, environmental monitoring and food safety.
1. Introduction
Lecithin, also called phosphatidylcholine, the most abundant phospholipid component of lipoproteins, is physiologically important as a precursor of signaling molecules.As the primary element of cytomembranes, lecithin has irreplaceable physiological importance in lipoprotein metabolism [1,2]. The dysregulation of lipid homeostasis could affect the normal physiological function of cells[3].Foods rich in lipid lecithin,which predominantly include eggs,red meat,milk,liver,poultry and fish,are believed to be the major dietary sources of choline,betaine and trimethylamine N-oxide[4].The excessive absorption or lack of lecithin may result in disease.Consequently, the fast qualitative and quantitative determination of lecithin is of paramount importance.
Electrochemiluminescence (ECL), also called electrogenerated chemiluminescence,was first reported by Dufford et al.[5]and has been developed into a very effective detection protocol for analytical applications. Some species in excited states that emit light on electrodes undergo high energy charge transfer reactions and give collectable optical signals [6]. Excited species are generated by electrochemical stimulus rather than by light excitation and generally display an improved signal-to-noise ratio,leading to light scattering and the minimization of background light during ECL[7].Owing to its high sensitivity, low background and space-time control [8,9], ECL has been extensively used in the investigation of cells,nucleic acids,drugs,nanomaterials and ECL chips[10-14].
An ECL instrument based on a photomultiplier (PMT) detector can achieve the fast detection of weak light.It can collect light from the whole electrode surface, but details of the local area or small luminous objects on the electrode are lost. Furthermore, the PMTbased analytical method cannot be used for the observation of single luminous particles. To compensate for this,ECL microscopic imaging techniques have been developed and have been a hot issue because of their superiority of high-throughput analysis with high spatial resolution and a low detection limit [15-17]. ECL imaging applications such as bipolar ultramicroelectrode imaging [18],fingerprint imaging[19],single-cell imaging[20],wireless sensing visual detection [21], the collision of single nanoemitters [22] and the investigation of the ECL mechanism [23] reveal that ECL imaging is a powerful and versatile tool for understanding fundamental questions. Engstrom et al. [24] used a simple camera to observe ECL generated by the reaction of luminol, Ru(bpy)32+and rubrene to realize spatial resolution on the electrode. Sentic et al.[25] deciphered the mechanistic route of ECL in the Ru(bpy)32+-TPrA system through two orthogonal microscopes, whereby they mapped stereoscopic luminous polystyrene (PS) beads. To satisfy the real-time testing outside the laboratory, a portable and selfpowered system has been developed to simplify and miniaturize the design of ECL sensors [26]. For example, the smartphones can be a candidate on account of its attractive advantages: (1) smartphones are typically equipped with high resolution screens for image display, and have powerful processors for storage and analysis of imaging data; (2) smartphones could control the cell phone camera and the ECL sensor through a mobile app; (3)smartphones are cheaper and widely used in comparison with the traditional ECL sensors such as the PMT [27-29].
Studies performed at the single particle level are of great interest because they reveal particle-to-particle heterogeneity and provide a way to understand the underlying mechanisms that may be hidden in ensemble measurements[30-32].Optical techniques are routinely used for the simultaneous imaging of individual particles, and their strengths include high throughput and high temporal resolution.Nonetheless,the extrinsic illumination source not only can easily cause background interference but is also likely to produce hot electrons [13]. ECL is the combination of electrochemical and spectroscopic methods. Importantly, because of the lack of an external light source, ECL microscopy is viewed as the ideal way to observe single particles with high sensitivity. More importantly, ECL reflects the photoelectric properties of the material and is thus an effective method for characterizing materials.Ma et al. [22] applied ECL microscopy to dynamically image the collision electrochemistry of single Ru(bpy)32+-doped silica nanoparticles. By recording successive collisions, they developed a“relay probe” sensing platform for long-term research. Chen et al.[33] reported an in situ imaging study of the heterogeneity of the electrocatalytic activity during catalysis on different facets at the subparticle level. ZnO crystals with various exposed facet proportions are synthesized,and their ECL visualization confirms that the ZnO(002)facet has a superior catalytic performance compared to the ZnO (100) facet. Dutta et al. [34] labeled nonconductive PS beads with the Ru(bpy)32+complex via a sandwich immunoassay or a peptide bond and used them as the sensing platform for heterogeneous ECL studies. From the ECL images, they found that the vanishing ECL response correlates directly with the low TPA oxidation current and reveals valuable information on the photophysical stability of the labels and the parameters controlling ECL.
Currently, various methods for detecting lecithin have been designed, such as high-performance liquid chromatography [35],enzymatic approaches [36], mass spectrometry [37], and electrochemical methods [38]. Most of these approaches require expensive equipment and complex operation with general performance,which restricts their applications. Compared with the above methods, ECL is a promising method due to its advantages of a simple sample preparation process, high sensitivity, and low cost.
Phospholipase D (PLD) can hydrolyze lecithin into phosphatidic acid (PtdOH) and choline, as shown in Fig. 1, and choline can be further oxidized to betaine and H2O2by choline oxidase (COD)[39-41].L012(8-amino-5-chloro-7-phenylpyrido[3,4-d]pyridazine-1,4(2H,3H)-dione,a luminol analog)can generate ECL in the absence of H2O2.Accordingly,lecithin has potential in ECL applications.
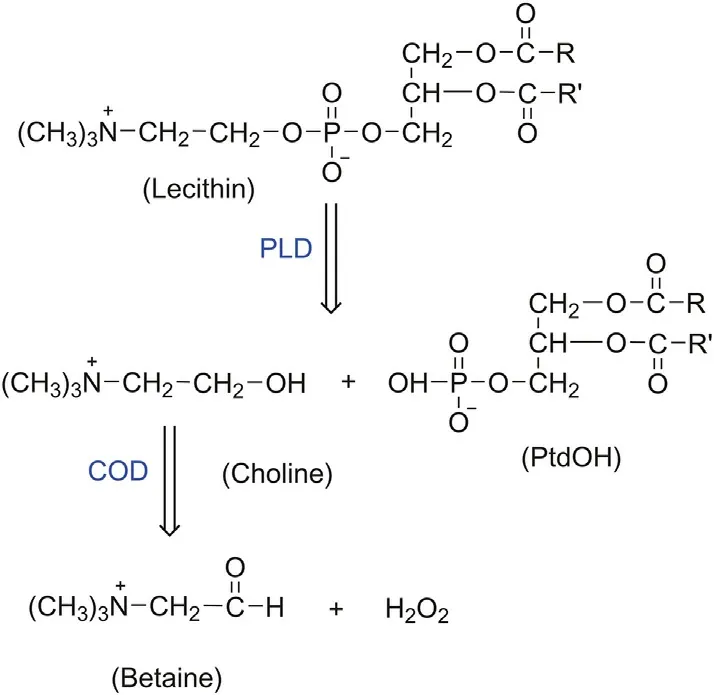
Fig.1. The sequence of enzymatic reactions for lecithin. PLD: phospholipase D; COD:choline oxidase; PtdOH: phosphatidic acid.
In this study, we synthesized gold microbeads at the micron scale and achieved the ECL imaging of single particles. Gold microbeads were modified by PLD and COD,so lecithin around the gold microbeads could react to generate H2O2quickly. The ECL intensity of the gold microbeads is correlated with the lecithin concentration. Finally, we developed a simple, convenient, and visualized ECL assay for the detection of lecithin.To the best of our knowledge, this is the first demonstration of an ECL microscopic analysis of lecithin at the single particle level.
2. Experimental
2.1. Chemicals and solutions
All reagents were used without further purification, and deionized distilled water was used throughout the experiments.A stock solution of Na3Au(SO3)2was purchased from Changzhou Institute of Chemical Research (Changzhou, China). L012 was bought from Wako Chemical USA Inc. (Richmond, VA, USA). PLD and COD were purchased from Sigma-Aldrich Co., Ltd. (Shanghai,China), lecithin was obtained from Tokyo Chemical Industry Co.,Ltd., and hydrogen peroxide was purchased from Shanghai Ling Feng Chemical Reagent Co., Ltd. (Shanghai, China). A 0.01 M stock solution of luminol was kept at 4°C in a dark bottle when not in use.Hydrogen peroxide solutions were prepared by making appropriate dilutions from a 30% hydrogen peroxide solution. Lecithin was dissolved in trichloromethane, and the solvent was evaporated in nitrogen. PLD and COD were dissolved in 10 mM phosphate buffered solution (PBS, pH 7.4) and diluted to 10 U/mL and 4 U/mL,respectively.
2.2. Instruments
Our ECL imaging system, composed of two major apparatuses,was set up as demonstrated in Fig. 2B. Specifically, a CHI 760E electrochemical workstation(CH Instruments Co.,Shanghai,China)was used as the signal actuating device to generate and record electrochemical responses.A medical microscope assembled with a Canon 5D3 camera (exposure time: 30 s) was applied to observe luminescence and create images. The ECL imaging experiments must be operated in a shielding room.ECL spectra were measured by an ECL-9B ultraweak chemiluminescence/bioluminescent detector (the instrument was supplied by State Key Laboratory of Analytical Chemistry for Life Science, Nanjing University, China).
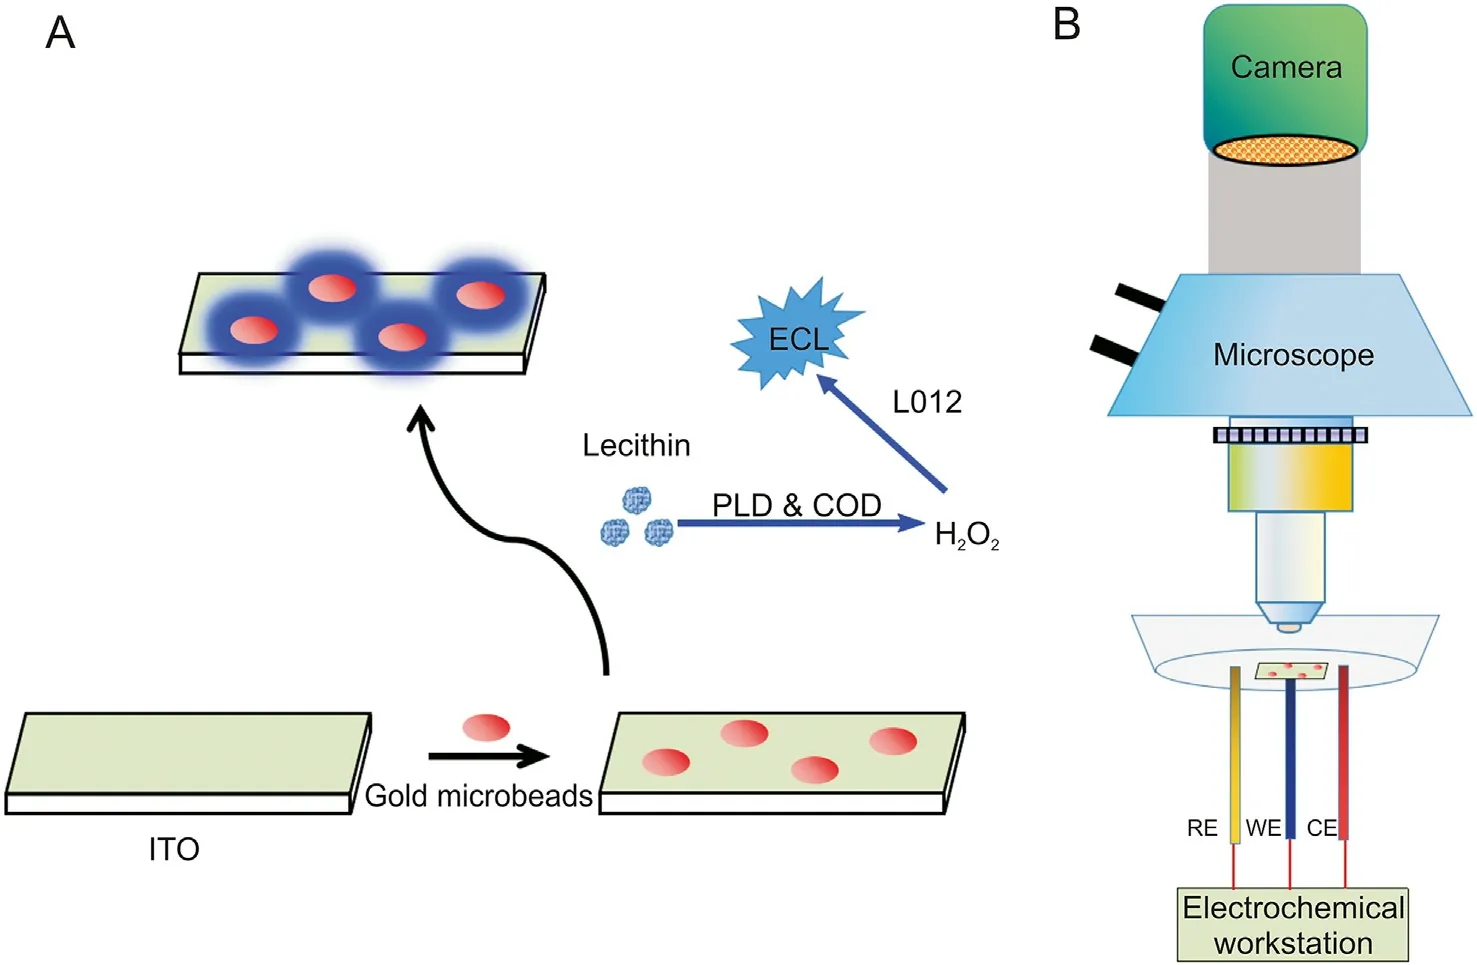
Fig.2. ECL microscopic analysis for lecithin.(A)The strategy for visualizing lecithin and(B)the imaging setup.ECL:electrochemiluminescence;ITO:indium tin oxide;RE:reference electrode; WE: working electrode; CE: counter electrode.
Scanning electron microscopy(SEM)tests were performed on a Hitachi S-4800 scanning electron microscope (Hitachi Co., Tokyo,Japan).Transmission electronmicroscopy(TEM)images were taken using a JEOL-2100 instrument (JEOL, Tokyo, Japan). UV-Vis absorption was performed on a UV-3600 UV/Vis-NIR spectrophotometer (Shimadzu Co., Tokyo, Japan). X-ray diffraction (XRD)measurements were performed on a Shimadzu XRD-6000 X-ray powder diffractometer (Shimadzu Co., Tokyo, Japan).
2.3. Preparation of enzyme-functionalized gold microbeads
Na3Au(SO3)2is an important gold source in the field of noncyanide electroless gold plating [42], but it is apt to generate SO2and simple gold in strong acid solutions. Herein,1.0 M H2SO4was added to a 5.0 g/L Na3Au(SO3)2solution, and 10 min later, gold particles formed and precipitated on the bottom of the test tube.Then, the particles were washed repeatedly with ultrapure water.Subsequently, gold particles were incubated with PLD and COD aqueous solutions (5 U/mL and 2 U/mL, respectively) at 37°C for 24 h. Gold particles were self-assembled by the two enzymes through physical absorption and Au-S bonds originating from gold and the sulfhydryl groups in the enzyme [43,44]. After that, the final sediment was thoroughly washed with ultrapure water to remove the nonabsorbed enzyme and used for subsequent assays.
2.4. Preparation of the ECL imaging platform
Indium tin oxide (ITO) glass was washed with dilute ammonia(1:20,V/V),ethanol,and ultrapure water for 10 min in an ultrasonic bath [45]. After ultrasonic dispersion, the solution containing functionalized gold microbeads was transferred to the ITO surface.A conventional three-electrode system was used for all electrochemical experiments and consisted of ITO glass or a modified electrode as the working electrode, Ag/AgCl (saturated KCl) as the reference electrode, and platinum wire as the auxiliary electrode.The ECL imaging experiments were investigated in a solution of 10 mM PBS (pH 7.4) and 1.0 mM L012. Lecithin was broken down into H2O2by PLD and COD on the gold microbeads and further reacted with L012 to generate ECL (Fig. 2A).
2.5. ECL imaging process
The ECL setup was fixed in a shielding box. Gold microbeads were observed under a 40× objective lens and located in bright field. Before ECL imaging experiment, we turned off the light and gently closed the shielding box.Subsequently,we operated the ECL imaging equipment,and the corresponding images were saved by a compute. In this progress, the position of gold microbeads on electrode and the relative location between gold microbeads were unchanged.
3. Results and discussion
3.1. Characteristics of the gold microbeads
The morphologies of the gold microbeads were characterized by using SEM and TEM. The microspheres were almost perfectly spherical in shape(Figs.3A and C)but had rough surfaces(Fig.3B).In addition, the size was inhomogeneous in the range of 100 nm-2 μm.The average size was approximately 1.2 μm.Fig.3D depicts the X-ray diffraction(XRD)patterns of the gold microbeads.The diffraction peaks at 2θ =38.0°, 44.2°, 64.3°, and 77.5°were assigned to the (111), (200), (220), and (311) lattice planes of gold[46], respectively.
3.2. ECL microscopy imaging of lecithin on gold microbeads
The feasibility of using the ECL technique to image lecithin on gold microbeads was confirmed by investigating the ECL responses obtained with and without PLD and COD on the surface of gold microbeads. ITO with gold microbeads was immersed in PBS(10 mM, pH 7.4) containing 1.0 mM L012 and 4 mM lecithin. ECL imaging experiments were conducted under the conditions of a high potential of 1.2 V, low potential of -0.8 V and pulse width of 0.5 s.At the same time,the camera collected the ECL images with an exposure time of 30 s.The bright field images and ECL images were analyzed with ImageJ software.The areas of the gold microbeads in the ECL images were obtained by using the “Image/Adjust/Threshold” tools. Enlarged ECL images of interesting targets were first obtained.After that,the“freehand selection”tool was used to carefully outline individual gold microbeads that have ECL signals,and the“Analyze/Measure”tool was used to obtain the gray value.Here, the “gray value” represents the ECL intensity. To obtain the statistical data, every gold microbead was selected, and its “gray value” was measured.
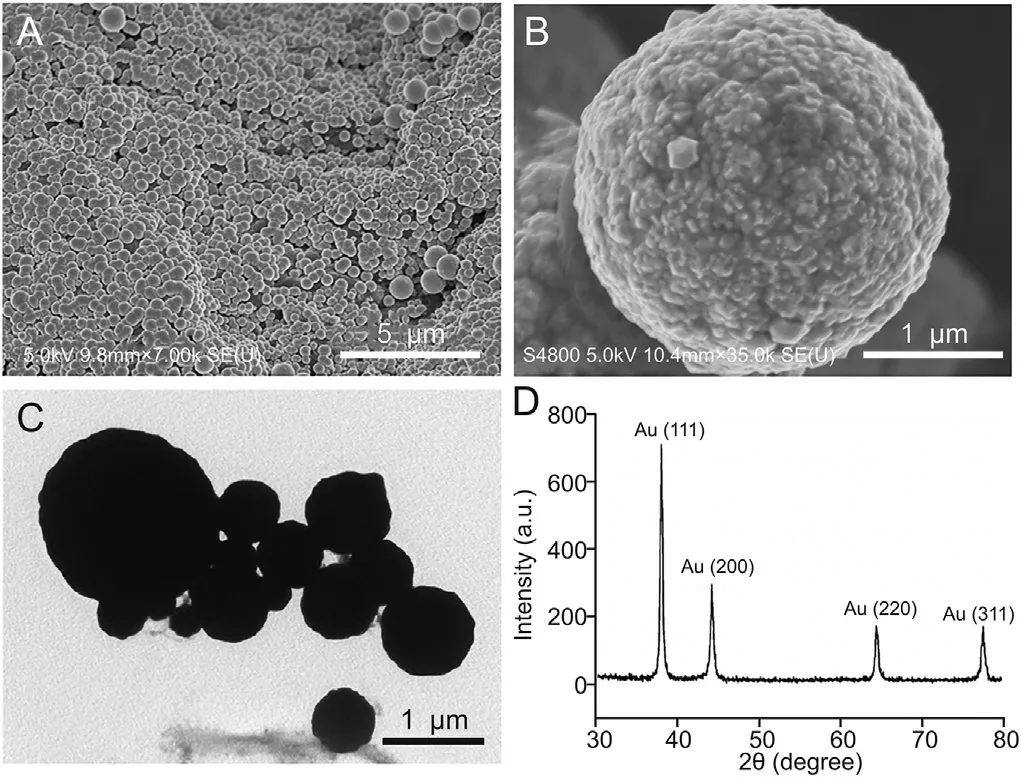
Fig. 3. Characterizations of gold microbeads. (A) SEM image of gold microbeads; (B)SEM image of single gold microbead; (C) TEM image and (D) XRD pattern of gold microbeads. SEM: scanning electron microscopy; TEM: transmission electron microscopy; XRD: X-ray diffraction.
In Case 1,as no enzyme was modified on the gold microbeads,as shown in Fig. 4A1, weak light was observed. In Case 2 and Case 3,the gold microbeads were functionalized by PLD and COD,respectively, and the ECL spots related to single gold microbeads were also very weak(Figs.4B1 and C1).Sparse ECL spots appeared in the ECL images, which is attributed to the electrocatalytic property and redox reactivity of gold particles in the luminol ECL system in the presence of dissolved oxygen [47], and the possible mechanism is demonstrated in Fig. S1. In Case 4, the ECL image presented many obvious ECL spots (Fig. 4D1), suggesting that lecithin underwent hydrolysis under the action of PLD and COD.Abundant H2O2, the coreactant of luminol, was produced on the surface of gold microbeads and quickly participated in the ECL reaction. Therefore, the functionalized gold microbeads showed brighter ECL spots than the gold microbeads without PLD and COD modification.Importantly,the luminescence response was uneven for individual gold microbeads, reflecting the heterogeneity of single particle luminescence.The responses of some particles with small sizes (usually difficult to focus on) might be lost in the background light because of the interference from the extrinsic illumination source in the bright field. For example, particle 1 in Fig.4E2 was blurred in the bright field but showed an obvious ECL profile in the dark field (Fig. 4E1). In addition, the area of the ECL spot was slightly larger than the area of a single gold microbead,and particle 2 in Figs. 4E1 and E2 shows that the ECL intensity gradually decayed from the center to the edge of gold microbead.In fact,if gold microbeads are regarded as mutually independent gold microelectrodes, H2O2produced on the gold surface can quickly diffuse to the bulk solution and become diluted, causing the concentration at the edge to be reduced and the brightness to decay near a gold microbead. Since the reactions are confined to the surface and vicinity of the electrode,ECL has outstanding spatially controlled resolution. In this work, the localized details observed on ITO support the superiority of the ECL imaging of a single particle, which PMT sensors cannot provide.
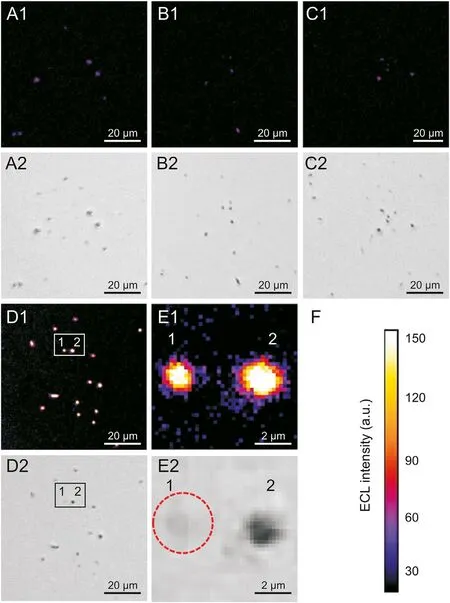
Fig. 4. Microscopy images of gold microbeads in 1.0 mM L012 and 4.0 mM lecithin solution. ECL images of gold microbeads (A1) without modification, individually modified with (B1) PLD, (C1) COD and (D1) simultaneously modified with PLD and COD,respectively.(E1)The enlarged view of two gold microbeads.(A2,B2,C2,D2 and E2)The corresponding bright field images.(F)The calibration bar of ECL intensity.High potential: 1.2 V; low potential: -0.8 V; pulse width: 0.5 s; exposure time: 30 s.
Despite the individual differences exhibited by the gold microbeads in the ECL process, the ECL intensity of the gold microbeads is statistically significant. As shown in Figs. 5A and B,almost all the gold microbeads present ECL spots, but their ECL intensities are unstable (Fig. 5C). Two hundred gold microbeads were investigated, and their luminescence fluctuated around a value of 116.3 a.u.(Fig.5D).We analyzed the regularity between the number of gold microbeads and their average ECL intensity. As shown in Fig. 5E, the average ECL intensities of 10 and 20 gold microbeads were slightly higher than those of more gold microbeads. As the number of gold microbeads increased, the average ECL intensity tended to remain stable.30,50,100 and 200 gold microbeads displayed similar data;therefore,the average ECL intensity of at least 30 gold microbeads was selected as the readout signal in the following experiments.
3.3. Optimized conditions for the detection of lecithin
The optimization of the dosage of ECL reagents and electrical parameters of chronoamperometry(CA)are specifically clarified in Figs.S2-S4.To examine the relationship between ECL intensity and L012 concentration, various concentrations of L012 were determined with the ECL imaging technique. Fig. S2 illustrates that the ECL signal of L012 increased when the concentration was below 1.0 mM.The luminescence remains stable above 1.0 mM,and a high concentration could not further promote luminescence. Bare ITO failed to display a sensitive response to L012, despite increased concentration. Therefore,1.0 mM L012 was applied for ECL visualization.After adding 4 mM lecithin,as shown in Fig.S3,the anodic ECL peak of L012 (at 0.6 V)is enhanced obviously.
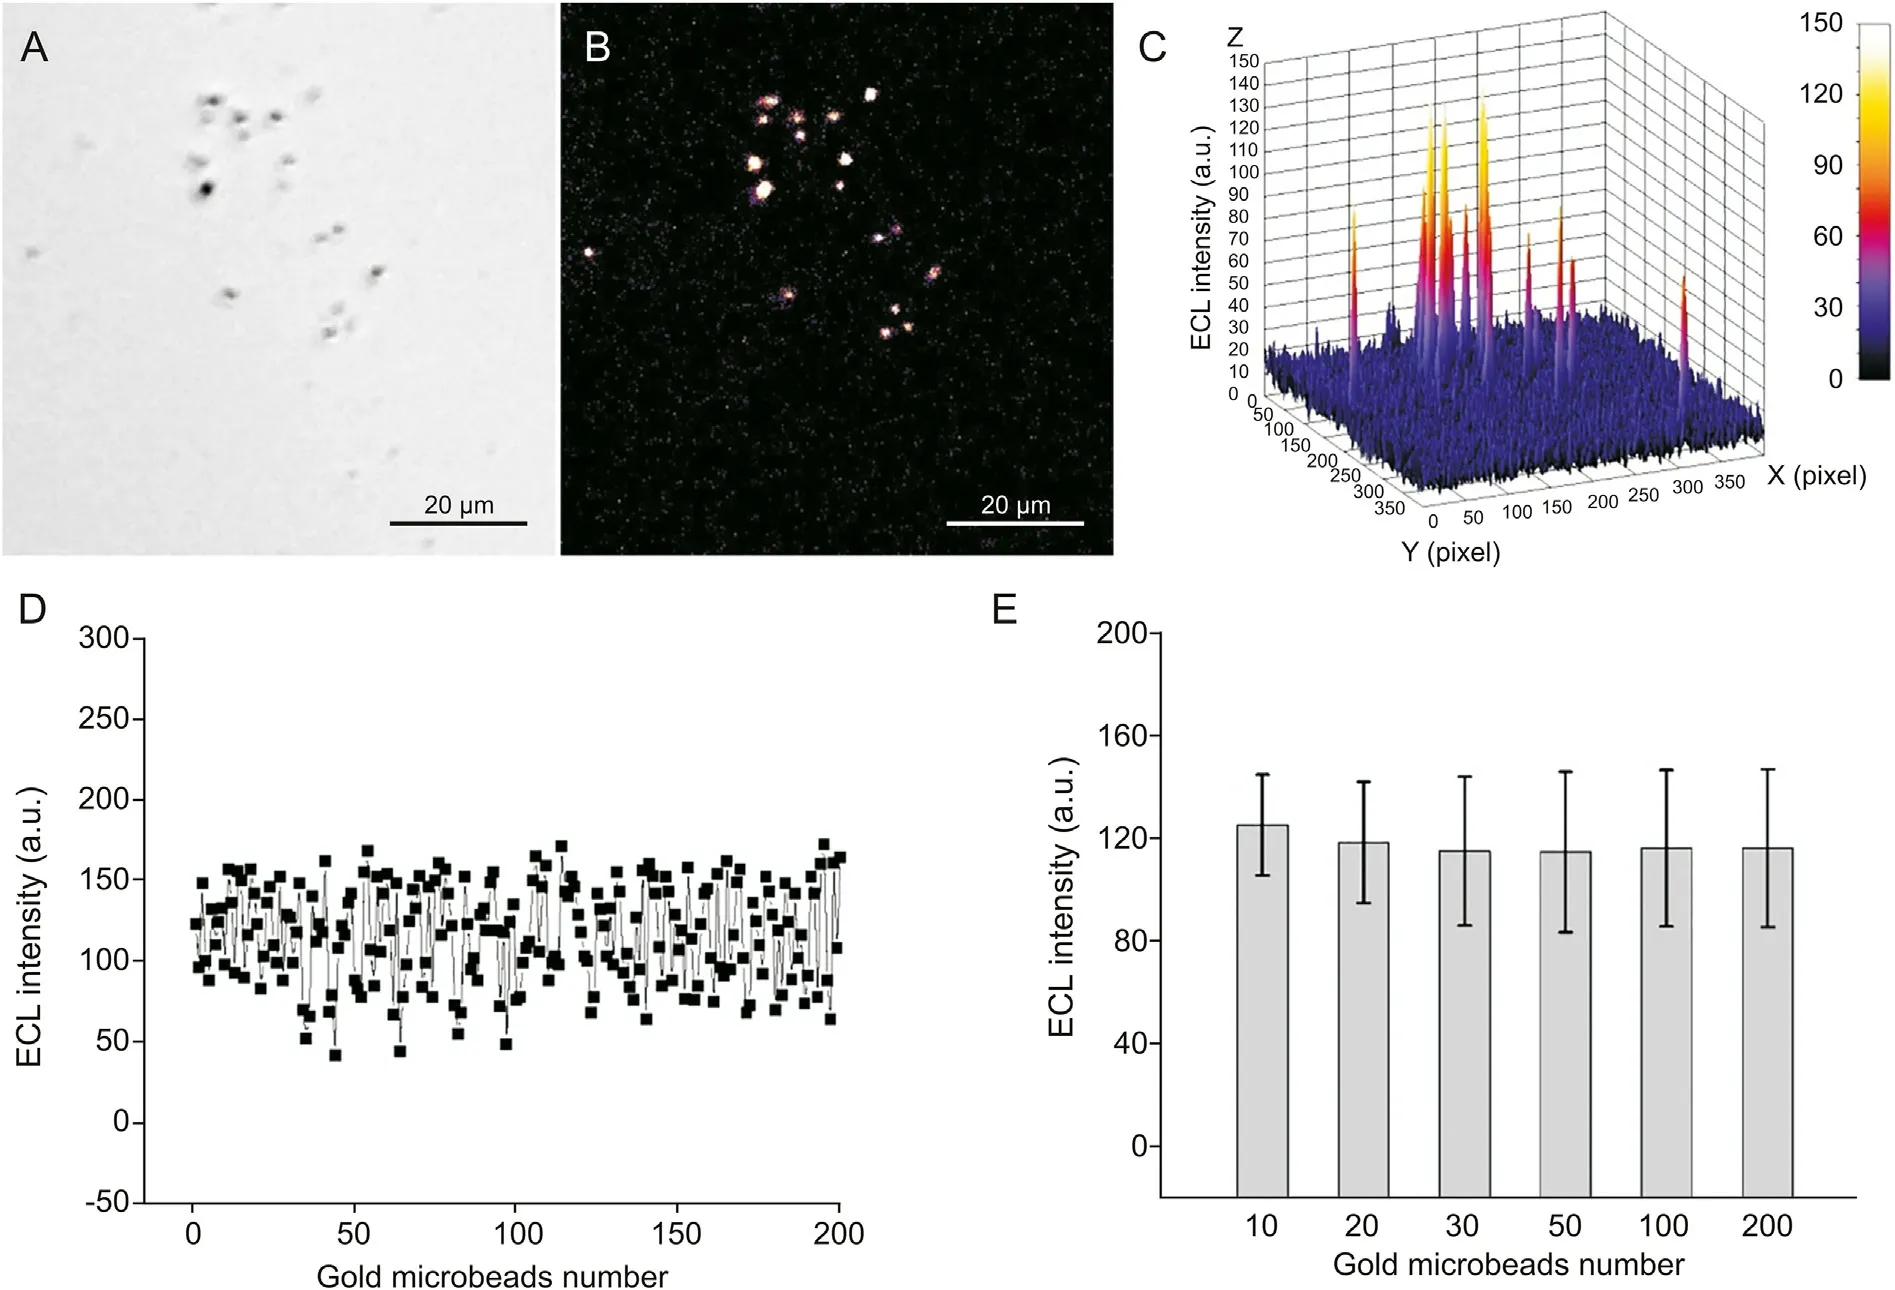
Fig.5. Test data description from ECL visualization signals.(A)Bright field image of PLD and COD modified gold microbeads;(B)ECL image and(C)its 3D surface pseudocolor image in 1.0 mM L012 and 4.0 mM lecithin solution; (D) scatter diagram of ECL intensity from 200 gold microbeads and (E) their statistical data. High potential: 1.2 V; low potential:-0.8 V; pulse width: 0.5 s; exposure time: 30 s.
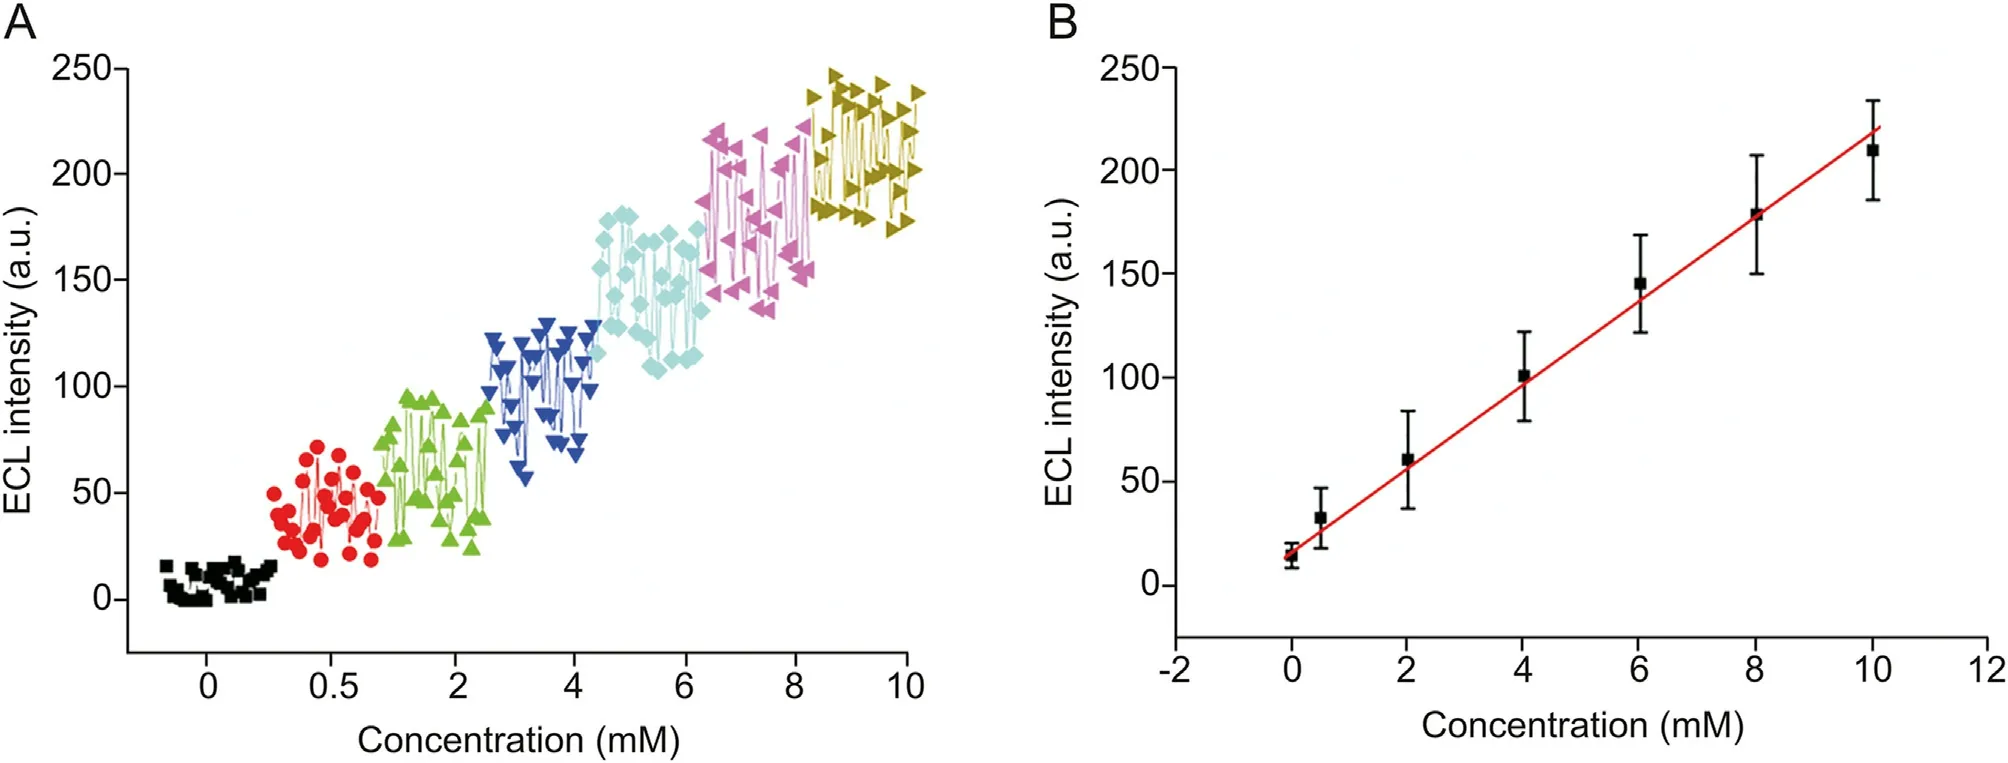
Fig.6. Quantitative determination of lecithin in 1.0 mM L012 solution.(A)ECL responses of individual gold microbeads obtained in lecithin concentrations of 0,0.5,2.0,4.0,6.0,8.0,and 10.0 mM; (B) plot of ECL intensity and lecithin concentrations.
We used CA in the ECL imaging measurement since pulse waves produce more photons than triangular waves at the same time in a fast electrode reaction[48].To obtain the best performance of ECL imaging, the parameters (high potential, low potential, and pulse width)of CA were experimentally optimized according to a similar method [19,49]. As demonstrated in Figs. S4A and B, the high potential and the low potential were optimized at 1.2 V and -0.8 V,respectively. The relative light intensity changed little within a pulse width of 0.05-5 s,as shown in Fig.S4C.Since the short pulse width and long pulse width did not drastically increase the detection signal, 0.5 s was selected as the experimental pulsewidth. Under the above conditions, the CA response was obtained as shown in Fig. S4D.

Table 1 Comparison of different methods for lecithin detection.
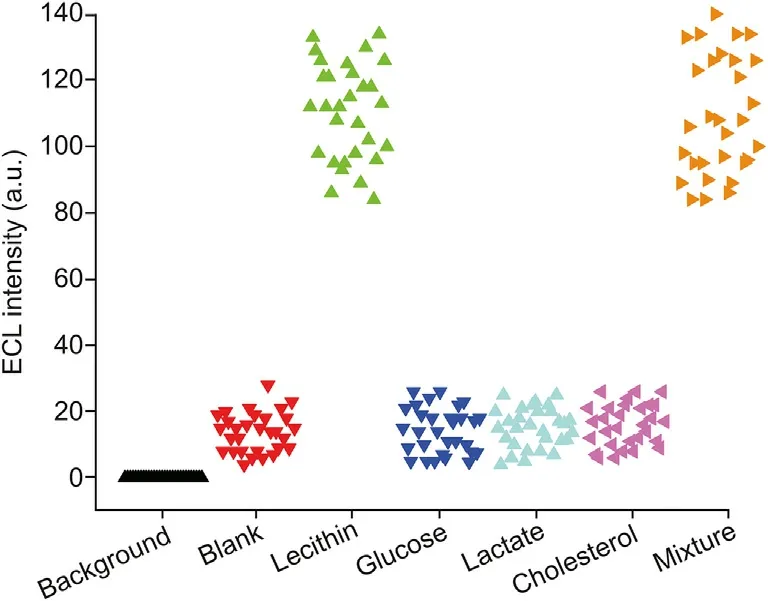
Fig. 7. ECL collected with PLD and COD modified gold microbeads in response to background, blank, lecithin (4 mM), glucose (4 mM), lactate (4 mM), cholesterol(4 mM), and their mixture in 1.0 mM L012 solution.
3.4. Quantitative determination of lecithin via ECL imaging
The solution containing various concentrations of lecithin was loaded into the electrochemical cell. Under the optimum conditions, localized ECL spots were observed at gold microbeads.Although the ECL intensity(30 gold microbeads)of individual gold microbeads fluctuated within a range with a relative standard deviation(RSD)of approximately 25%at the same concentration,the overall trend increased obviously,as shown in Fig.6A.The average ECL intensity (obtained with 5 parallel experiments and a total of 150 gold microbeads) increased proportionally with increasing lecithin concentration, and a linear response to concentration was observed between 0.5 mM and 10 mM (Fig. 6B). The regression equation can be described as I =20.23 c +16.04(I:ECL intensity;c:the concentration of lecithin),and r =0.9916,with a detection limit of 0.05 mM.
Compared with some previously reported methods[31-34],the proposed ECL imaging strategy showed a wider detection range as well as a lower detection limit for lecithin detection (Table 1).
3.5. Selectivity of gold microbead ECL imaging for lecithin detection
The selectivity of the ECL imaging platform for lecithin was also evaluated against other interfering substrates, including glucose,lactate and cholesterol, which can enzymatically generate H2O2under the action of glucose oxidase,lactate oxidase and cholesterol oxidase, respectively [50,51]. From the results shown in Fig. 7, we can see that the background is zero, and the ECL intensities observed for glucose, lactate and cholesterol at a concentration of 4 mM are much lower than those observed for lecithin,and there is no obvious increase in luminescence of glucose, lactate and cholesterol compared to that of the blank solution. However, the mixture containing lecithin,glucose,lactate and cholesterol shows an ECL response that is similar to that of lecithin. Hence, our ECL strategy based on single gold microbeads has a high selectivity for the recognition of lecithin.
3.6. Application of the ECL imaging platform in drug samples
The standard addition method was utilized to estimate the recoveries of lecithin exogenously added in a lecithin soft capsule solution(BY-HEALTH Co.,Ltd.,Zhuhai,China).As shown in Table 2,the recovery (between 99.3% and 104%) was acceptable, showing that this method is promising for determining lecithin in real drug samples.
4. Conclusion
In summary, ECL is generated by the electrochemical reaction between L012 and the hydrogen peroxide that is produced by the enzyme-catalyzed oxidation of lecithin. Spatial resolution and high-throughput analysis are the distinguishing features of the ECL imaging technique. Thus, a single gold microbead with localized ECL has been developed as a novel tool for the visualization sensing of lecithin. Compared with naked gold microbeads, the PLD and COD modified gold microbeads exhibit better ECL responses in L012 and lecithin solutions.The average ECL intensity of gold microbeads is correlated with the lecithin concentration, which supports the ECL microscopic quantitative analysis. The ECL imaging method provides a linear concentration range (0.5-10 mM) and a limit of detection (0.05 mM) similar to or better than those of some previously reported analytical methods for lecithin determination.However, its drawbacks, including high standard deviation(RSD =25%) and low sensitivity, limit its application. Therefore,future work will focus on synthesizing micrometer-scale conductive particles with even sizes to improve the stability of ECL imaging measurements. Some compounds under the action of their corresponding enzymes,such as xanthine under xanthine oxidase,cholesterol under cholesterol oxidase, glutamate under glutamic oxidase, uric acid under uric acid oxidase, glucose under glucose oxidase, lactate under lactate oxidase and lysine under lysine oxidase, can also generate H2O2and are expected to realize ECL visualization analysis by similar methods. This high-throughput ECL imaging system will broaden our horizons for the analysis of microscopic objects, and more information will be presented.

Table 2 Determination of lecithin in real drug samples.
Declaration of competing interest
The authors declare that there are no conflicts of interest.
Acknowledgments
This research is supported by Anhui Provincial Natural Science Foundation (Grant Nos. 2008085QB68 and 1808085QB29), Key Project of Provincial Natural Science Research Foundation of Anhui Universities (Grant Nos.KJ2018A0675 and KJ2018A0389), Foundation of State Key Laboratory of Analytical Chemistry for Life Science(Grant No.SKLACLS2003),and Foundation of Henan Key Laboratory of Biomolecular Recognition and Sensing (Grant No.HKLBRSK1905).
Appendix A. Supplementary data
Supplementary data to this article can be found online at https://doi.org/10.1016/j.jpha.2021.02.002.
杂志排行
Journal of Pharmaceutical Analysis的其它文章
- A simplified LC-MS/MS method for the quantification of the cardiovascular disease biomarker trimethylamine-N-oxide and its precursors
- UHPLC-MS/MS analysis of cAMP and cGMP in rat plasma as potential biomarkers of Yin-Yang disharmony in traditional Chinese medicine
- Liquid chromatography-mass spectrometry method for the quantification of an anti-sclerostin monoclonal antibody in cynomolgus monkey serum
- Plasma-metabolite-based machine learning is a promising diagnostic approach for esophageal squamous cell carcinoma investigation
- Reducing SARS-CoV-2 pathological protein activity with small molecules
- Development of the general chapters of the Chinese Pharmacopoeia 2020 edition: A review
