Comparative permeability of three saikosaponins and corresponding saikogenins in Caco-2 model by a validated UHPLC-MS/MS method
2021-09-14SiqiRenJingjingLiuYunwenXueMeiZhangQiweiLiuJieXuZunjianZhangRuiSong
Siqi Ren , Jingjing Liu , Yunwen Xue , Mei Zhang , Qiwei Liu , Jie Xu ,Zunjian Zhang , Rui Song ,*
a Key Laboratory of Drug Quality Control and Pharmacovigilance, China Pharmaceutical University, Nanjing, 210009, China
b State Key Laboratory of Natural Medicine, China Pharmaceutical University, Nanjing, 210009, China
Keywords:Bupleuri Radix Saikosaponin Saikogenin UHPLC-MS/MS Caco-2 cells Permeability
ABSTRACT Saikosaponins(SSs)are the main active components extracted from Bupleuri Radix(BR)which has been used as an important herbal drug in Asian countries for thousands of years.It has been reported that the intestinal bacteria plays an important role in the in vivo disposal of oral SSs.Although the deglycosylated derivatives(saikogenins,SGs)of SSs metabolized by the intestinal bacteria are speculated to be the main components absorbed into the blood after oral administration of SSs, no studies have been reported on the characteristics of SGs for their intestinal absorption, and those for SSs are also limited. Therefore, a rapid UHPLC-MS/MS method was developed to investigate and compare the apparent permeability of three common SSs (SSa, SSd, SSb2) and their corresponding SGs (SGF, SGG, SGD) through a bidirectional transport experiment on Caco-2 cell monolayer model.The method was validated according to the latest FDA guidelines and applied to quantify the six analytes in transport medium samples extracted via liquid-liquid extraction (LLE). The apparent permeability coefficient (Papp) determined in this study indicated that the permeability of SGs improved to the moderate class compared to the corresponding parent compounds, predicting a higher in vivo absorption. Moreover, the efflux ratio (ER) value demonstrated an active uptake of SSd and the three SGs, while a passive diffusion of SSa and SSb2.
1. Introduction
Bupleuri Radix(BR),the dried root of Bupleurum chinense DC.or B. scorzonerifolium Willd. has been widely used in Asian nations since ancient times due to its significant and stable clinical efficacies[1],and is documented in forms of both raw BR and vinegarbaked BR (VBBR) in the Chinese Pharmacopoeia (2015). Among over 280 compounds isolated and identified from Bupleurum [2],saikosaponins (SSs) a, d and b2belonging to triterpenoid saponins in oleanane type are considered as the common active components for their abundant contents in raw BR or VBBR [3,4] as well as various proven pharmacological activities [5], such as immunoregulatory, anti-inflammatory, anti-virus, and anti-cancer effects.On the contrary, the toxicity of them has also been reported to induce partial side effects of BR extract or traditional Chinese medicine(TCM)formulas containing BR especially when overdosed[6].
Although the pharmacological activity and toxicity of SSs have aroused widespread interest, previous oral pharmacokinetic (PK)studies of BR or related TCM formulas in rats have shown that the in vivo exposure of SSs is very low, even if the oral dose is much higher than the clinically used dose[7-9].Considering most of the Chinese patent drugs formulas containing BR are administered orally [1], the intestinal epithelium is a major barrier for SSs absorption,which may be responsible for the low in vivo exposure of them [10]. In recent years, the Caco-2 cell monolayer model with both functional and morphological characteristics of enterocytes[11] has been used to study the intestinal absorption of SSs. An investigation on the absorption permeability of Xiao Chai Hu Tang(XCHT) with this model reported that SSa, SSd and SSb2could be transepithelially absorbed with a poor permeability [12]. Another transport experiment on Caco-2 cell model indicated passive diffusion was the main absorption mechanism of SSa monomer whose absorption could be characterized by a first-order kinetic process [13]. However, these studies were carried out in different doses and forms of SSs, resulting in no comparability and even contradictory situations between each other. On the other hand, a series of early researches by Japanese scientists have proven that a part of orally administered SSs would undergo a deglycosylation reaction under the hydrolysis of intestinal bacteria to form prosaikogenins(PSGs),and then saikogenins(SGs), and absorbed into the blood in these forms [14-16], which also results in the reduction of prototype SSs in living systems. However, so far, the permeability of SGs and the difference in intestinal absorption behavior between SGs and SSs have not been explored.In summary,the understanding of intestinal absorption for typical SSs and their corresponding SGs is still limited.
Moreover,except for the fact that SSs can be converted to SGs by glycoside hydrolase from the intestinal bacteria, the allyl oxide linkage in the 13, 28-position in the aglycone of SSa and SSd is easily cleaved under acidic conditions to produce homocyclic (SSg produced by SSa)or heterocyclic diene products(SSb1produced by SSa, SSb2produced by SSd) [14]. Considering that the full expression of various active enzymes(including hydrolases)on the Caco-2 cell monolayer [17] and media with specific pH may cause structural transformation of the test compounds,the establishment of a simple method for simultaneously determining the prototype compounds and potential conversion components is a prerequisite step to ensure the reliability of experimental results. To date,although several analytical methods have been developed to quantify SSs and their derivatives in biological samples [7,18],apparent permeability or bidirectional transport of these compounds in in vitro model by a sufficiently sensitive UHPLC-MS/MS method has not been described yet in the literature.
Thus, the present study established a novel UHPLC-MS/MS method for an accurate and rapid determination of the three structurally representative and pharmacologically active SSs (SSa,SSd and SSb2)and their corresponding SGs(SGF,SGG and SGD).The fully validated method was successfully applied to investigate and compare the apparent permeability of these six monomers at the same molarity through a bidirectional transport experiment on Caco-2 cell monolayer model.
2. Materials and methods
2.1. Reagents and chemicals
SSa, SSb2and SSd were purchased from Chengdu Esite Biotechnology Co., Ltd. (Chengdu, China), and the purity of these reference substances was >99.0%. The SGs, including SGF, SGD and SGG, were synthesized and identified according to our previous work (Fig. 1) [18]. Canrenone and digoxin were purchased from National Institutes for Food and Drug Control (Beijing, China). Propranolol and furosemide were obtained from Yuanye Bio-Technology Co., Ltd. (Shanghai, China). N-2-hydroxyethylpiperazine-N-ethanesulphonicacid(HEPES),Hank's balanced salt solution without phenol red(HBSS,powder)and dimethyl sulfoxide(DMSO)were purchased from Sigma-Aldrich (MO, USA). 2-morpholinoethanesulfonic acid(MES) was from Solarbio Science & Technology Co., Ltd. (Beijing,China). Fasted state simulated intestinal fluid (FaSSIF) was supplied by Biorelevant (London, UK). MTT kit was from Beyotime Biotechnology(Nanjing,China).Bovine serum albumin(BSA)and verapamil hydrochloride were supplied by Aladdin Industrial Corporation(Shanghai, China). Minimum essential medium (MEM) and sodium pyruvate were from keygenbio(Nanjing,China).Fetal bovine serum(FBS)was supplied by ExCell Bio(Suzhou,China).Trypsin was from Boster Biological Technology Co., Ltd. (Wuhan, China). Ultra-pure water was obtained through a Millipore Milli-Q Water System(Darmstadt,Germany).All other chemicals or reagents used were of analytical or biochemical grade.
2.2. Instrumentation
The UHPLC-MS/MS system used for all the analysis was a Shimadzu LCMS-8060 system (Shimadzu Co., Kyoto, Japan) which consists of a binary pump LC-30AD, a column oven CTO-20AC, a controller CBM-20A,a sampler SIL-30AC,a degasser DGU-20A5R,a triple quadruple mass spectrometer MS-8060 and an operating software LabSolution.
2.3. Preparation of stock solutions, calibration standards and quality control samples (QCs)
Stock solutions of individual SSs or SGs were prepared in DMSO at a concentration of 5 mM. Then each stock solution was further appropriately diluted with DMSO to obtain a series of standard working solutions. A set of 6 non-zero calibration standards and 3 levels of QCs were prepared by spiking 5 μL of one of the working solutions with 495 μL of drug free blank transport medium. Stock solution of canrenone (internal standard, IS) at a concentration of 1.0 mg/mL was diluted to 0.10 μg/mL with methanol to prepare working solution. The standard working solutions, calibration standards and QCs were all freshly prepared before use.
2.4. Sample processing
To a 100 μL aliquot of the sample,10 μL of IS working solution(100 ng/mL) and 1 mL of ethyl acetate-dichloromethane (4:1, V/V)mixture was added. The mixture was then vortexed for 5 min and centrifuged at 12,000 rpm for 10 min under 4°C.800 μL of organic supernatant was decanted into a fresh tube, and evaporated to dryness with the assist of nitrogen at 37°C. Then the residue was reconstituted with 80 μL of mobile phase and centrifuged for 10 min(4°C,12,000 rpm).Eventually,the supernatant was injected into the UHPLC-MS/MS system for quantitative analysis with an aliquot of 5 μL.
2.5. Analytical conditions
The six analytes and IS were successfully separated on a 1.8 μm ZORBAX Eclipse Plus C18column(2.1 mm× 100 mm;Agilent Technologies,Palo Alto,CA,USA). The mobile phases were water-formic acid(999:1,V/V)(A)and MeOH(B)at a flow rate of 0.3 mL/min during the whole gradient program as follows: 75% B for the initial 0-4 min,and 80%B for 4-6.5 min;finally,B was returned to 75%at 6.5 min and maintained from 6.5 to 7.5 min.Autosampler and column were thermostated at 4°C and 45°C,respectively.
The mass spectrometer was operated via electrospray ionization(ESI) source in positive and multiple reaction monitoring (MRM)mode. The operating parameters included the following: the nebulization gas (nitrogen, 3.0 L/min), the desolvation gas (nitrogen, 10.0 L/min), the collision-induced-dissociation gas (argon,270 kPa), the desolvation line temperature (250°C), the heater block temperature(400°C),and the spray voltage(4.0 kV).Detailed parameters used for monitoring precursors to product ions transitions of the analytes and IS are listed in Table 1.
2.6. Method validation
Referring to the latest FDA Bioanalytical Method Validation Guidance for Industry, the developed method for quantifying SSa,SSb2, SSd, SGF, SGD and SGG in transport medium (HBSS for SSs,HBSS and FaSSIF for SGs) was fully validated in selectivity, calibration curve and sensitivity, accuracy and precision (intra- and inter-day), extraction recovery, matrix effects, stability as well as dilution effects.
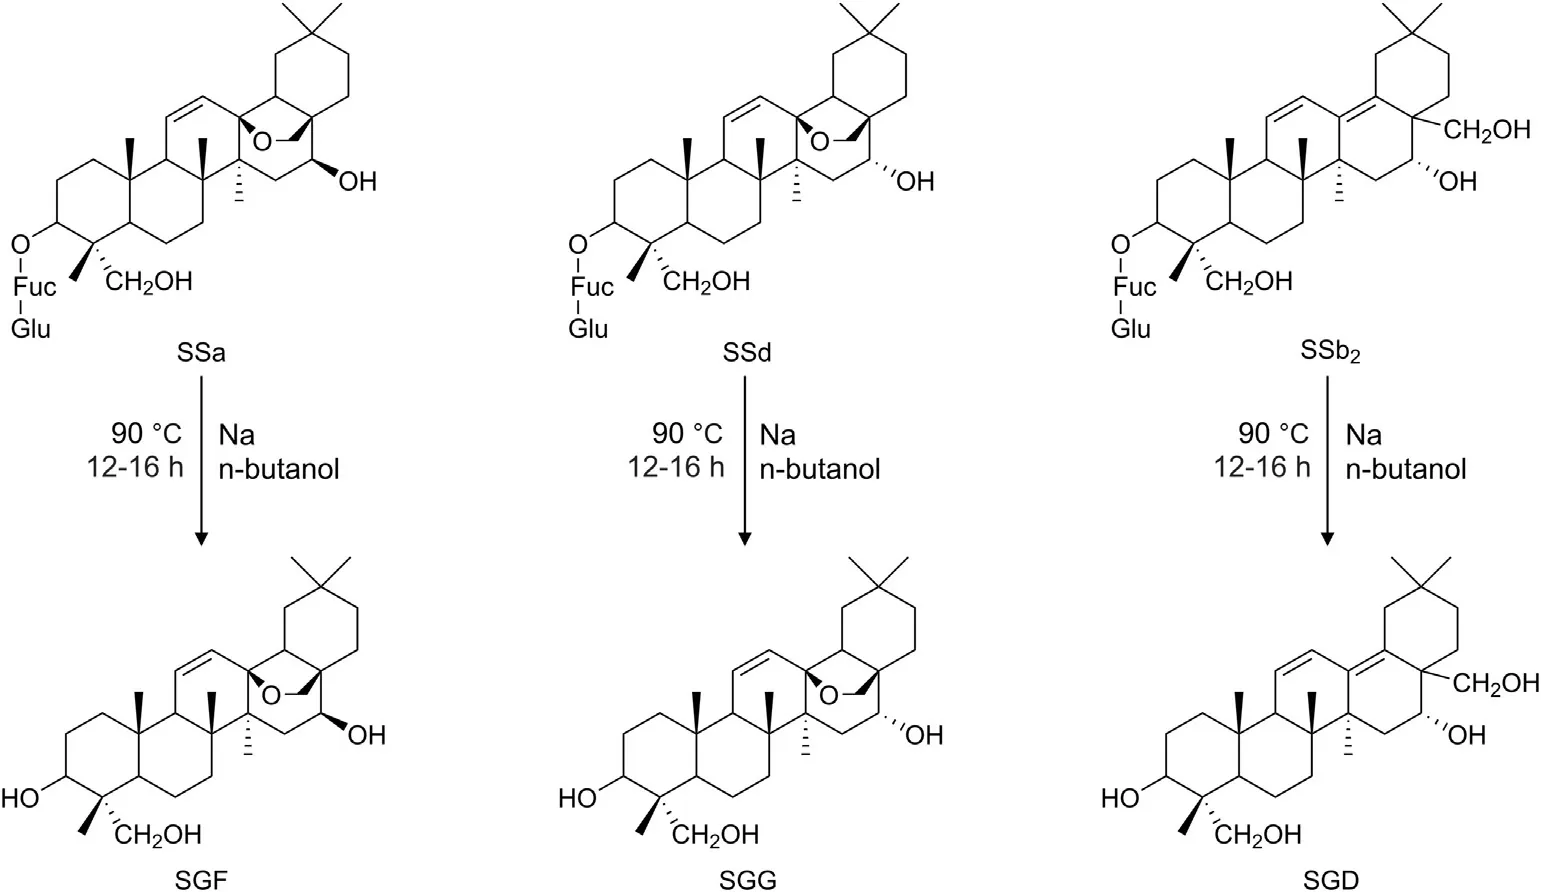
Fig.1. Structures and the main preparation conditions of the saikogenins.

Table 1 Optimized mass spectrometry parameters for the six analytes and IS in positive ESI mode.
2.6.1. Selectivity
The chromatograms of blank transport medium(HBSS or FaSSIF)and those spiked with the six analytes at the lower limit of quantification(LLOQ)concentrations and IS at 10 ng/mL were paralleled to assess the presence of potential interference at targeted retention times and corresponding mass transitions, and thereby to verify that substances being measured were intended ones.Compared to responses in LLOQ samples,only when those in blank ones exceeded neither 10% for the analytes nor 5% for IS, the selectivity of the assay was considered to reach the acceptance criteria.
2.6.2. Calibration curve and sensitivity
For describing the concentration-response relationship, the calibration curves were plotted by the peak area ratios of analytes/IS vs. nominal concentrations (nM) of the analytes in each calibration standard. Meanwhile, quantitation ranges of the curves should adequately cover concentration ranges expected in samples from transport studies. Moreover, the method sensitivity, defined as the lowest non-zero standard on the calibration curve, was determined by LLOQ which should meet all the following requirements in at least five replicates of three runs: 1) signal-tonoise ratio (S/N) ≥10; 2) the accuracy was ±20% of nominal concentration;and 3) the precision indicated by RSD was ±20%.
2.6.3. Accuracy and precision
The estimation of accuracy and intra-day precision involving QCs of 3 levels in five replicates on the same day, as well as inter-day precision involving those in the same procedure on three consecutive days is essential for determining whether the method is suitable to quantify samples across the whole concentration ranges. The accuracy and the precision were expressed by relative error(RE,the percentage differences between the actual measured concentration and nominal value) and relative standard deviation (RSD), respectively. The criteria from FDA guidance indicate that the assay is accurate and precise if both absolute values of RE and RSD ≤15%.
2.6.4. Extraction recovery
Optimization of analytes and IS extraction method is required to ensure consistent and repeatable recovery. Thus, the recovery determining experiment was performed by comparing the analytical results of extracted QCs of 3 levels with corresponding postextracted blank transport medium (HBSS or FaSSIF) spiked with analytes at the same concentration levels. The recovery of IS was assessed in a similar manner at a concentration of 10 ng/mL.
2.6.5. Matrix effects
Matrix effects were evaluated by calculating ratios of the analytes responses (peak areas) from extracted blank transport medium (HBSS or FaSSIF) against those from pure solvent at 3 QC levels in five replicates. RSD of the ratio within 15% is considered acceptable to an almost absence of matrix effect.
2.6.6. Stability
Compared to three replicates of freshly prepared QCs at three concentrations, experiments for QCs stability were conducted under the following 4 different storage conditions: Auto-sampler stability at 4°C for 8 h, bench-top stability at room temperature for 6 h,processed samples(before reconstituted)stability at-80°C for 8 h, and freeze-thaw stability containing three freeze-thaw cycles from-80°C to room temperature.
2.6.7. Dilution effects
Since the analyte concentration in some samples collected from the donor side exceeded the upper limit of quantification (ULOQ),the diluted sample was also analyzed using the developed method.Referring to the quantitation range of each standard curve, five replicates of SSs (SSa, SSb2, SSd) HBSS samples at 10 μM were diluted 50 fold with drug-free HBSS to 0.2 μM,those of SGF and SGG were diluted 5-fold to 2 μM, and SGD were diluted 8-fold to 1.25 μM. Five replicates of each SG FaSSIF sample at 10 μM were diluted 5-fold with blank FaSSIF to 2 μM. Then, the dilution QCs were processed and quantified for accuracy and precision evaluations with the same manner and criteria mentioned in Section 2.6.3.
2.7. Cell culture and Caco-2 cell monolayer model establishment
The Caco-2 human colorectal adenocarcinoma cell line was purchased from Cell Bank of the Chinese Academy of Sciences(Shanghai,China).The cells were maintained in MEM containing Dglucose (1.0 g/L), L-glutamine (0.292 g/L), NaHCO3(2.2 g/L), penicillin (80 U/mL) and streptomycin (0.08 mg/mL), supplemented with 20%(V/V)FBS and 0.11 g/L sodium pyruvate,at 37°C under 5%CO2. The cells utilized were between 22 and 25 passages.
For monolayer differentiation and formation of tight junctions,the cells were removed enzymatically (0.25% (V/V) trypsin-EDTA,2 min, 37°C), and 0.4 mL of the cell suspension (1.5 × 10⁵cells/mL) was seeded onto each cell culture insert (6.5 mm diameter,0.3 cm2membrane surface area, 0.4 μm pore size; Millipore, USA)disposed in a 24-well plate and cultured for 21 days. The medium was changed every other day in the first week,and once a day in the following 2 weeks. Prior to transport experiments, quality validation was performed on each batch of Caco-2 cell monolayers,including assessment of tight junction formation using marker compound propranolol and furosemide; validation of the expression and function of P-glycoprotein (P-gp) by evaluating digoxin efflux ratio (ER) with or without inhibitor verapamil; and measurement of the transepithelial electrical resistance (TEER) value during the whole cultivation period.
2.8. Bidirectional transport experiments
In brief, validated cell monolayers were rinsed twice with warmed HBSS and then pre-incubated for 20 min at 37°C. For initiating the apical (AP) to basolateral (BL) transport, HBSS in AP was replaced by 0.4 mL of each SS (SSa, SSb2or SSd) dissolved in HBSS solution or each SG(SGF,SGD or SGG)dissolved in FaSSIF[19]at pH 6.5. Meanwhile, 0.6 mL of HBSS solution at pH 7.4 in the presence (for SGs) or absence (for SSs) of 4% (m/V) BSA [20] was added to BL. For efflux experiments (BL to AP), 0.6 mL of drug solution was loaded into BL compartment, and 0.4 mL of drug-free HBSS or FaSSIF solution was loaded into another side. Donor concentration of each compound in each direction was 10 μM.
After incubation for 3 h at 37°C on an orbital shaker at 50 rpm,200 μL of samples were collected from both receiver and donor sides and then analyzed using the validated UHPLC-MS/MS method. At the end of the study, TEER value of cell monolayer in each well was measured again to check their integrity. After that,the cell monolayer of each well was washed with pre-warmed HBSS for three times and lysed with 500 μL acetonitrile. In case the recovery rate was low, cell lysate would also be analyzed to quantify the intracellular drug.
2.9. Calculation and data analysis
Bidirectional permeability of test compounds on Caco-2 cells was evaluated by apparent permeability coefficient (Papp) calculated according to the following equation;single time point method was used in our experiment [21]:

where dC is the corresponding concentration of the test compound in the receiving compartment at the end time point of transport,dt is the whole incubation time(3 h),and VRis the volume of receiver compartment.A is the surface area of the cell monolayer(0.3 cm2)and C0is the initial concentration(10 μM)of the test compound in donor compartment. The Pappvalues are finally expressed as cm/s.Moreover, the ER value is calculated as follows:

Another parameter,recovery rate,defined as the amount of each test compound recovered in both AP and BL compartments at the end of the transport, is expressed as a percentage based on the following equation:

where,VRor VDis the volume of receiver or donor compartment;CR,CDand C0represent concentration of the test compound at 3 h in receiver compartment, at 3 h in donor compartment, and at zero time in donor compartment, respectively.
Results are expressed as mean ± S.D. (n=3). Data analysis was accomplished by SPSS Statistics 19.0. Unpaired two-tailed t-test analysis was used to compare differences between two groups,and differences were considered as statistically significant if P <0.05.
3. Results and discussion
3.1. UHPLC-MS/MS method
A sensitive detection of the six analytes was achieved in an optimized MRM mode with an ESI ionization source.Precursor ions were identified from the mass spectra in full-scan mode by injecting standard solutions. In detail, the adduct ion[M+Na]+for the three SSs, fragment ion [M-2H2O+H]+for SGF, and [MH2O +H]+for SGD and SGG were with the strongest signals.Based on these results,top three selective reaction monitoring transitions ordered according to response intensity for each analyte were obtained through an automatical optimization. By comparing the responses in these three transitions of the same analyte in a mixed standard sample, transitions with the best sensitivity were finally confirmed(Table 1).However,the transition m/z 455.00 →105.20,instead of m/z 455.00 →437.20 which maximized the response intensity, was eventually used to quantitatively detect the content of SGD and SGG in the sample.This choice was made to effectively avoid matrix interferences in the sample, especially when measuring low-concentration samples (Fig. 2). With a good response in positive MRM mode and a similar structure to the analytes,canrenone was selected as the IS.Its concentration was set in the middle of the calibration range to 10 ng/mL and the detecting transition was optimized as m/z 340.85 →187.15 for a sufficient sensitivity.
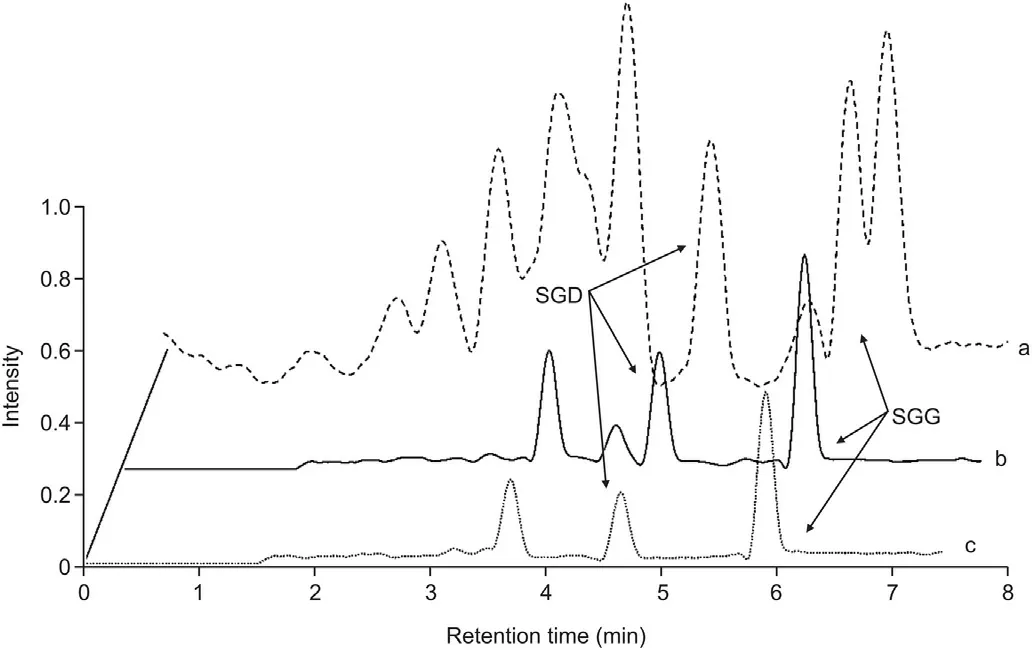
Fig. 2. Chromatograms of SGD and SGG at a low concentration detected in three different monitoring transitions. (a) 455.0500 >437.1500 (+) CE: 16.0, a series of interferences with strong signals appeared near the peak of the analytes; (b)455.0000 >105.2000(+)CE:55.0,the final transition responsible for quantifying SGD and SGG; (c) 455.0000 >95.1500 (+) CE: 45.0, the responses of the analytes were weaker than transition b.
The chromatographic separation conditions were optimized on an UHPLC C18column (2.1 mm × 100 mm,1.8 μm) with the standard mixture of the six analytes and IS. Based on our previous experience with chromatographic separation of SGD and SGG[18],methanol/water system was used as mobile phase solvents.A trace addition of formic acid (0.1%, V/V) into water improved the peak shape and mass spectra responses of the analytes.The three SSs or SGs are isomers of each other so that a complete separation among them could not be easily achieved. It has been reported that the separation efficiency of the UHPLC system with a C18bonded silica stationary phase can be improved by increasing the column temperature, thereby successfully achieving the chromatographic separation of seven ginsenosides with similar structures [22].Therefore, the chromatographic separation of the six analytes was investigated at column temperature from 40 to 45°C,respectively.A complete separation with excellent peak shape was finally achieved when the column temperature rose to 45°C. Under the optimized chromatographic conditions described above, the six analytes and IS could be successfully separated at a flow rate of 0.3 mL/min in a single run of 7.5 min, saving more time than previously reported relevant methods [7,18].
3.2. Sample processing
It was necessary to eliminate the interferences of high salt contents in transport buffers on ionization before analyzing.Liquidliquid extraction (LLE) was tested with various water-insoluble organic solvents including ethyl acetate, dichloromethane, and nbutanol or their mixtures of different proportions. Taking into account the advantages of good recovery,a lower noise near the peak of analytes and a higher vapor pressure, ethyl acetatedichloromethane (4:1, V/V) was finally employed. Mobile phase with initial proportion (methanol-water, 3:1, V/V) was adopted as the reconstitution and injection solvent in order to avoid the distortion of peak shape and the dimunition of peak height ascribed to the solvent effect [23].
3.3. Method validation
We evaluated the selectivity by analyzing in parallel the chromatograms of drug-free transport medium (HBSS or FaSSIF) and those spiked with analytes at LLOQ and IS at 10 ng/mL (Fig. 3). No significant interference was observed around the retention times of the six analytes and IS.
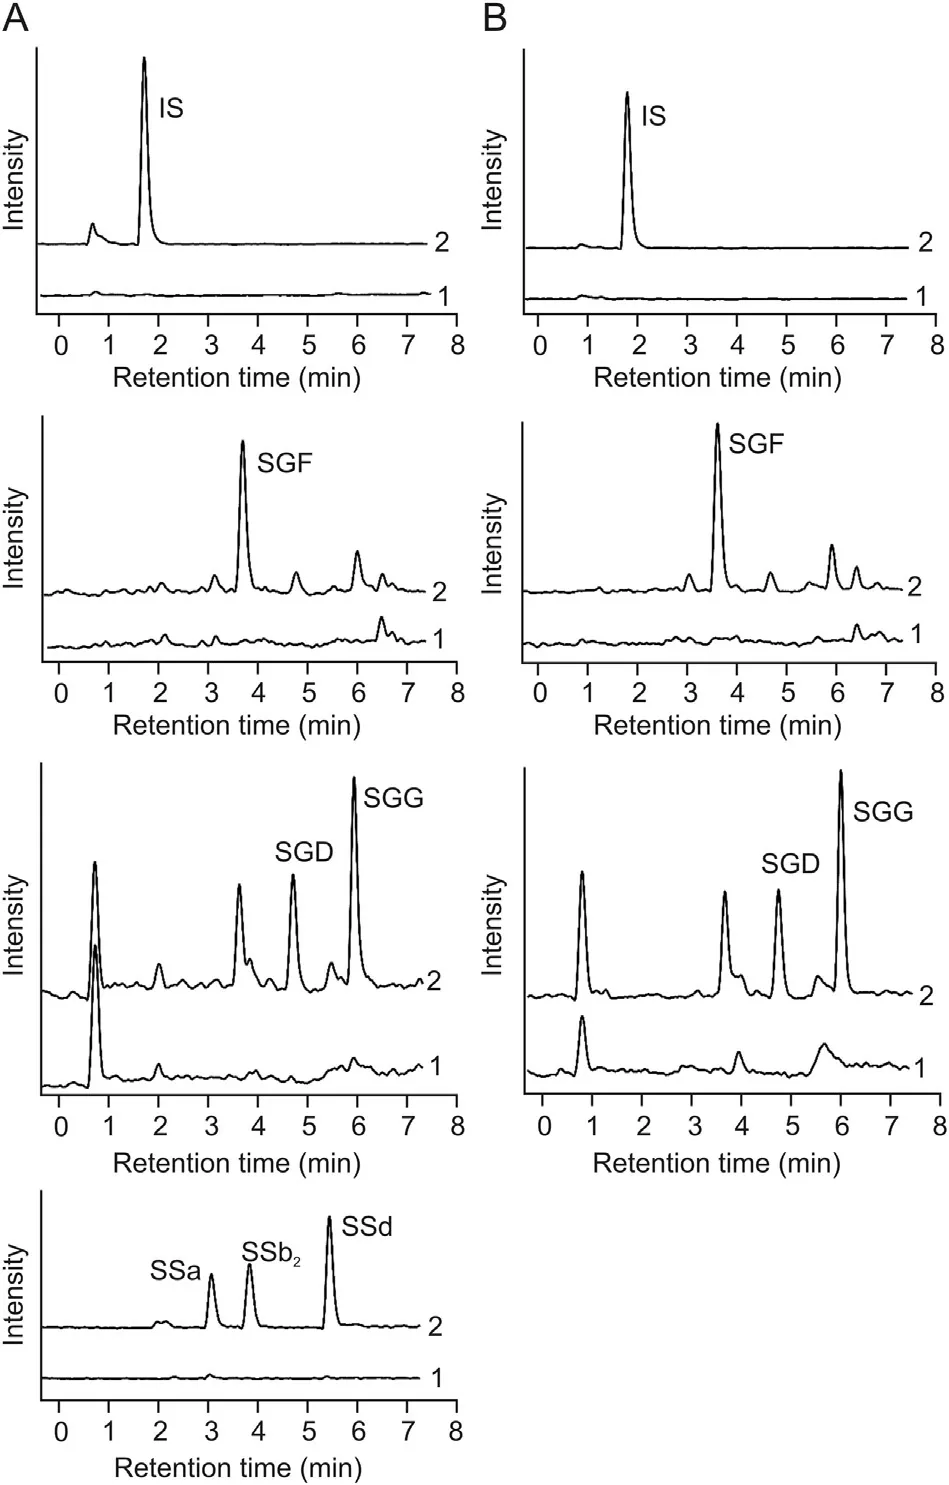
Fig. 3. Chromatograms of the analytes and the internal standard. Column (A): HBSS samples; Column (B): FaSSIF samples. 1: Blank matirx; 2: Blank matirx spiked with LLOQ concentration of each analyte and 10 ng/mL of canrenone (IS).
The linearity regression equation, LLOQ, precision (intra-day and inter-day) and accuracy data, extraction recoveries, matrix effects and dilution effects of this method are all presented in Table 2.Calibration curves for analytes dissolved in HBSS or FaSSIF showed excellent linearity in their respective linear ranges with the values of regression coefficients in the range of 0.9951 and 0.9999.Moreover, the LLOQ of each compound met the sensitivity requirement for quantification of transport medium samples. The accuracy determined by the absolute value of RE was within 13.74%(n =5),and the precision of this method indicated by RSD did not exceed 12.57%on the same day or 10.09%on 3 consecutive days at 3 nominal concentration levels. The extraction recoveries of the six analytes and IS were studied by spiking them before and after the extraction of blank medium. Mean recovery was in the range of 86.01%-106.17% with RSD <11.34% for the six analytes in HBSS,87.17%-109.09% with RSD < 11.62% for the three SGs in FaSSIF,85.86%with a RSD of 3.81%and 96.76%with a RSD of 4.99%for IS in HBSS and FaSSIF, indicating that the recovery of LLE method was consistent and reproducible. The values of peak area ratios for matrix effects evaluation were 87.50%-108.83%with RSD <13.30%for the six analytes in HBSS, and 85.88%-106.90% with RSD <13.79%for the three SGs in FaSSIF.And the matrix factor for IS was 96.62%with a RSD of 2.21%and 107.49%with a RSD of 12.70%in HBSS and FaSSIF, respectively. Thus, it could be considered as almost absence of matrix effects. In order to accurately quantify analytes concentrations in samples collected from donor side,diluted effects of the developed method were also examined. The accuracy of dilution QCs was in the range of 91.67%-106.88%, and the precision (RSD, %) was no more than 7.35% (Table 2), which demonstrated that the effects of dilution on accuracy and precisioncould be negligible. In addition, as shown in Table 3, there was no significant loss of analytes in HBSS or FaSSIF after 8 h in autosampler at 4°C,6 h at room temperature,8 h at-80°C or three freezethaw cycles from-80°C to room temperature, suggesting that all the analytes were sufficiently stable under the conditions where samples were stored.
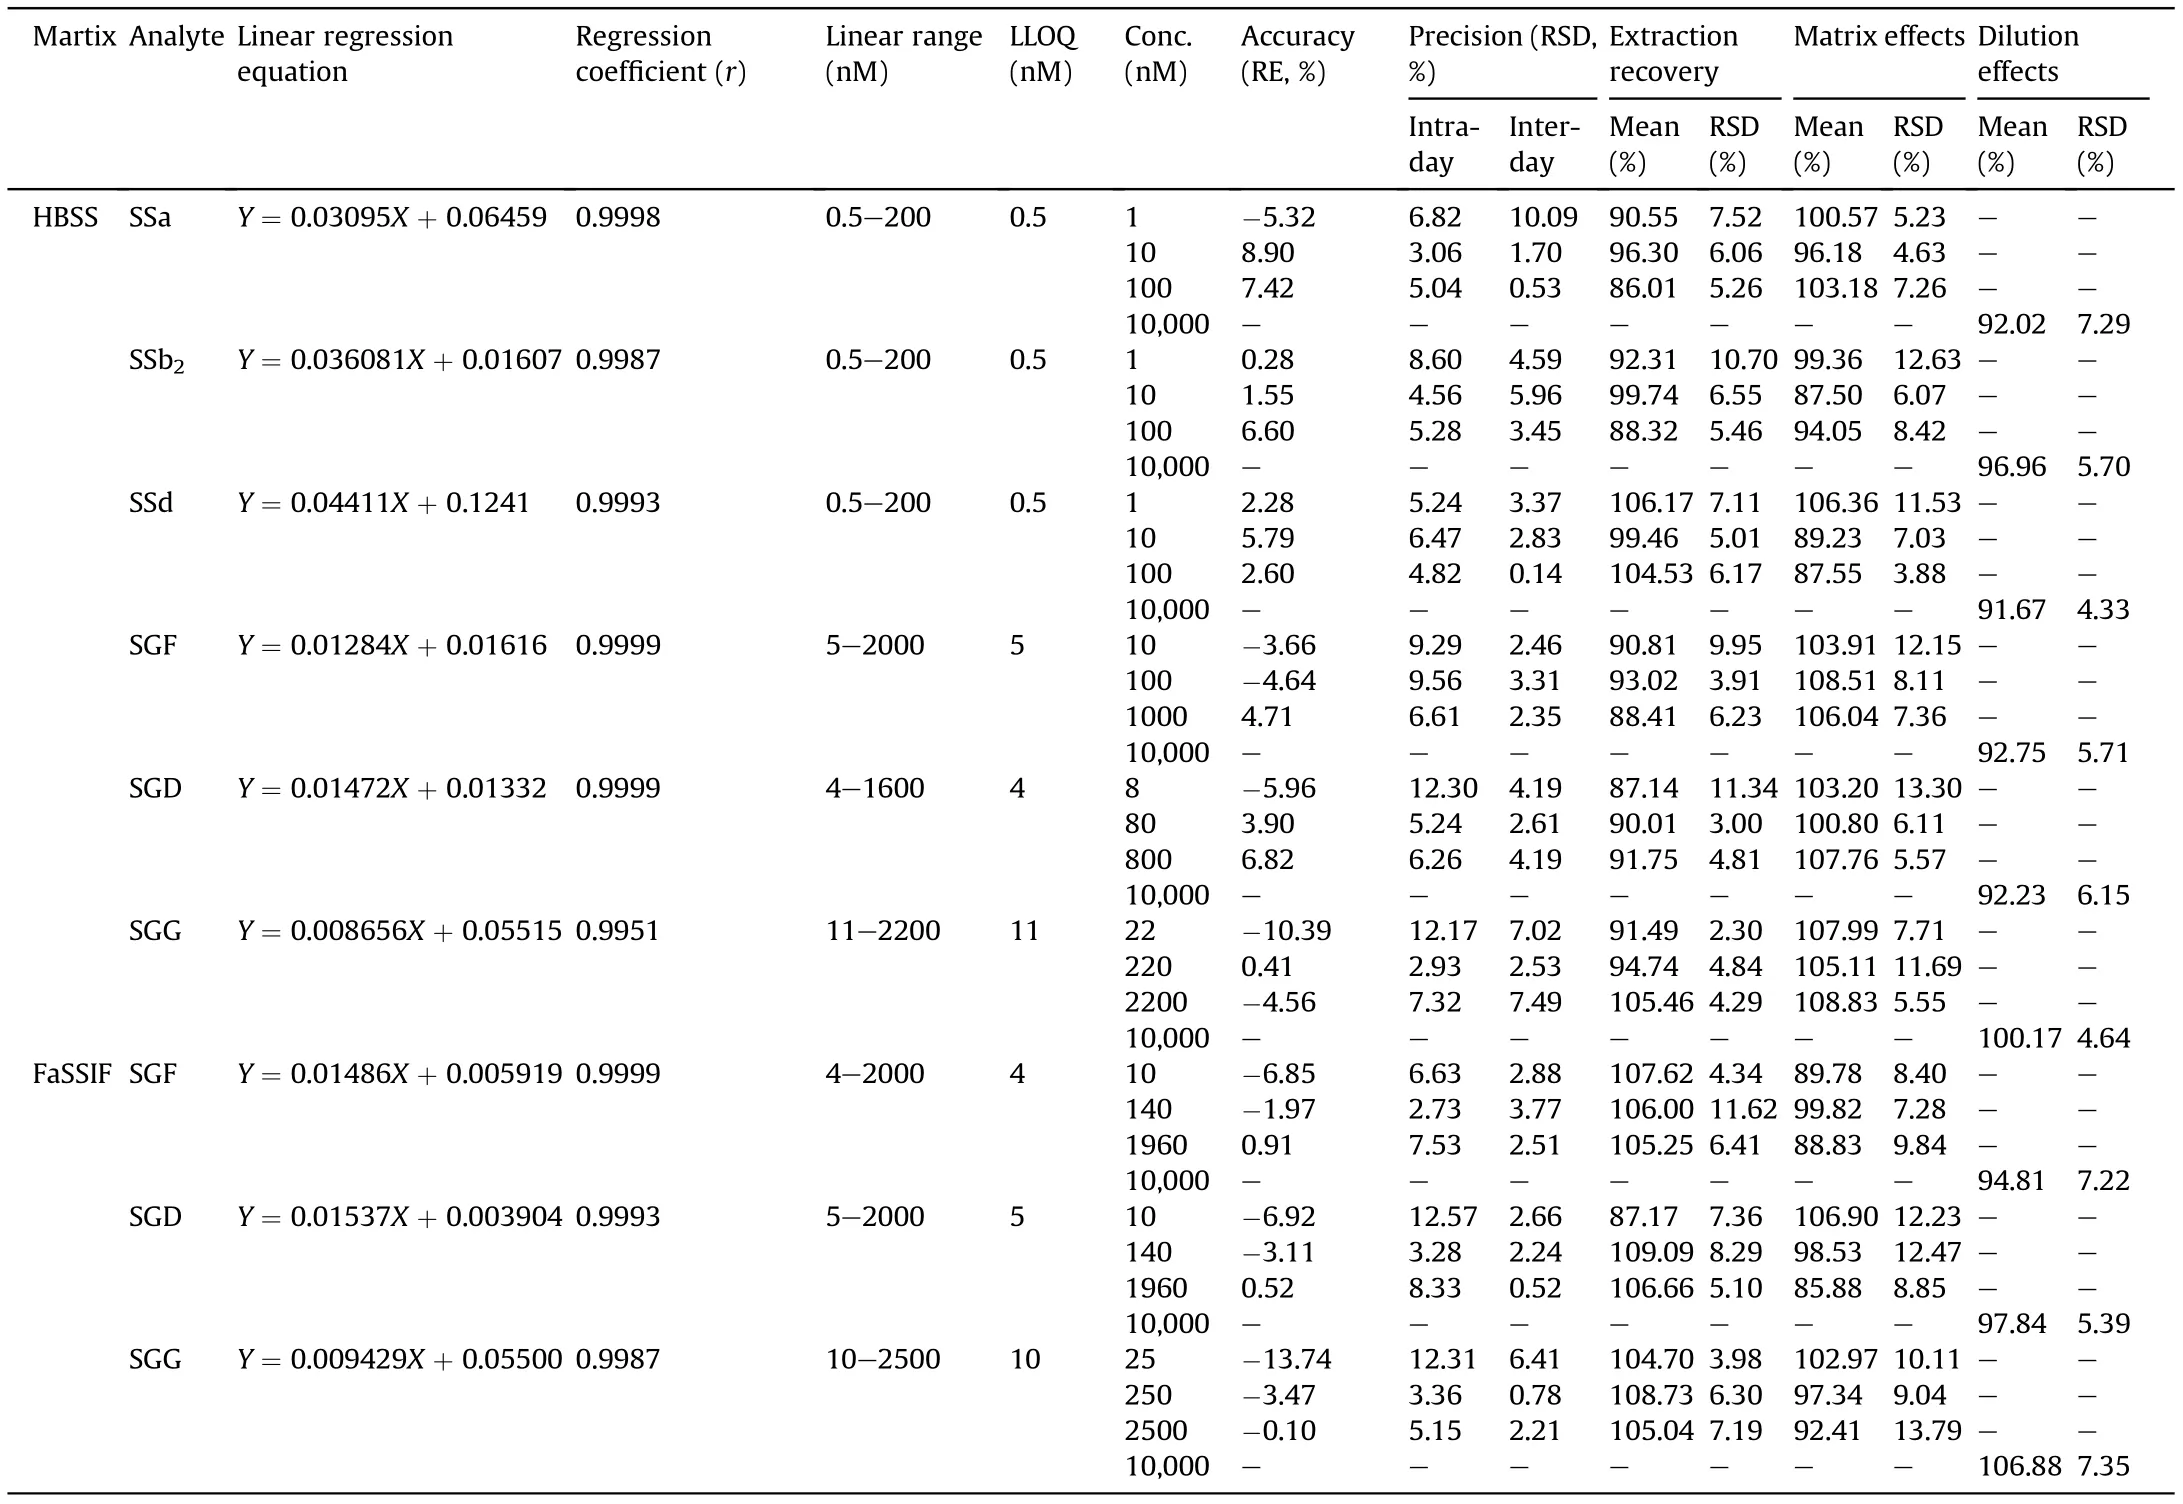
Table 2 Quantification performance for the three saikosaponins and saikogenins in HBSS, and for the three saikogenins in FaSSIF (n =5).
3.4. Apparent permeability between the apical (AP) and the basolateral (BL) compartment
The validated method was then applied to investigate the bidirectional transport of SSa,SSd,SSb2and their SGs on Caco-2 cell monolayer model. As a popular in vitro model in the field of intestinal absorption studies,Caco-2 cell monolayer model exhibits a variety of morphological and functional characteristics similar to human intestinal epithelial cells, providing a powerful tool for predicting the apparent permeability of drugs[11].However,a nonnegligible shortcoming of this model is that any divergence of the cell lines,cell culturing techniques or transport conditions between laboratories are likely to cause different integrity or viability of cell monolayers, resulting in discrepancies in Pappvalues even for the same drug [21]. Therefore, the Caco-2 cell monolayer model established in this study was validated prior to the formal transport experiments by assessing the Pappvalues of reference molecules including propranolol (high permeability class), furosemide (low permeability class) as well as digoxin with or without coadministration of verapamil. As listed in Table S1, Pappvalues of the three reference standards obtained from the present study were basically consistent with those already reported [24-26],which confirmed that the cell line and the culturing technique we used for cell monolayer model establishment met the requirements of characterizing the apparent permeability of drugs.Besides,TEER value of the cell monolayer in each well was also measured during the 21 culturing days to monitor their viability and integrity changes.Only those with TEER values exceeding 500 Ω cm2on the 21st day could be used in subsequent studies.
The bidirectional transport experiments for each compound were separately conducted in above validated Caco-2 cell monolayer model in triplicate.Permeation in AP to BL direction imitated physiological condition of absorption from intestinal lumen to blood compartment. In contrast, transports from BL to AP carried out parallelly in other wells mimicked the permeation in the secretory direction.The concentration of 10 μM was finally selected as donor concentration of each compound with reference to the safe concentration ranges derived from the Caco-2 cell compatibility studies by an MTT assay.Physiologically,since the total transit time for drugs to be absorbed in duodenum,jejunum and ileum is 2-4 h [27], the transport time in the present study was set at 3 h.Since our work focused on the qualitative and comparative study on the permeability of the six compounds, a single time point method was adopted to collect samples, which greatly simplified the operation, and made it possible to successfully compare thepermeability of the six compounds based on our developed UHPLCMS/MS method. Furthermore, for compounds of non-high permeability categories,sampling at a single time point and multiple time points will not cause a significant difference in apparent permeability [20]. Significant signs of mutual transformation during the transport process among these six compounds were not found in our experiments.
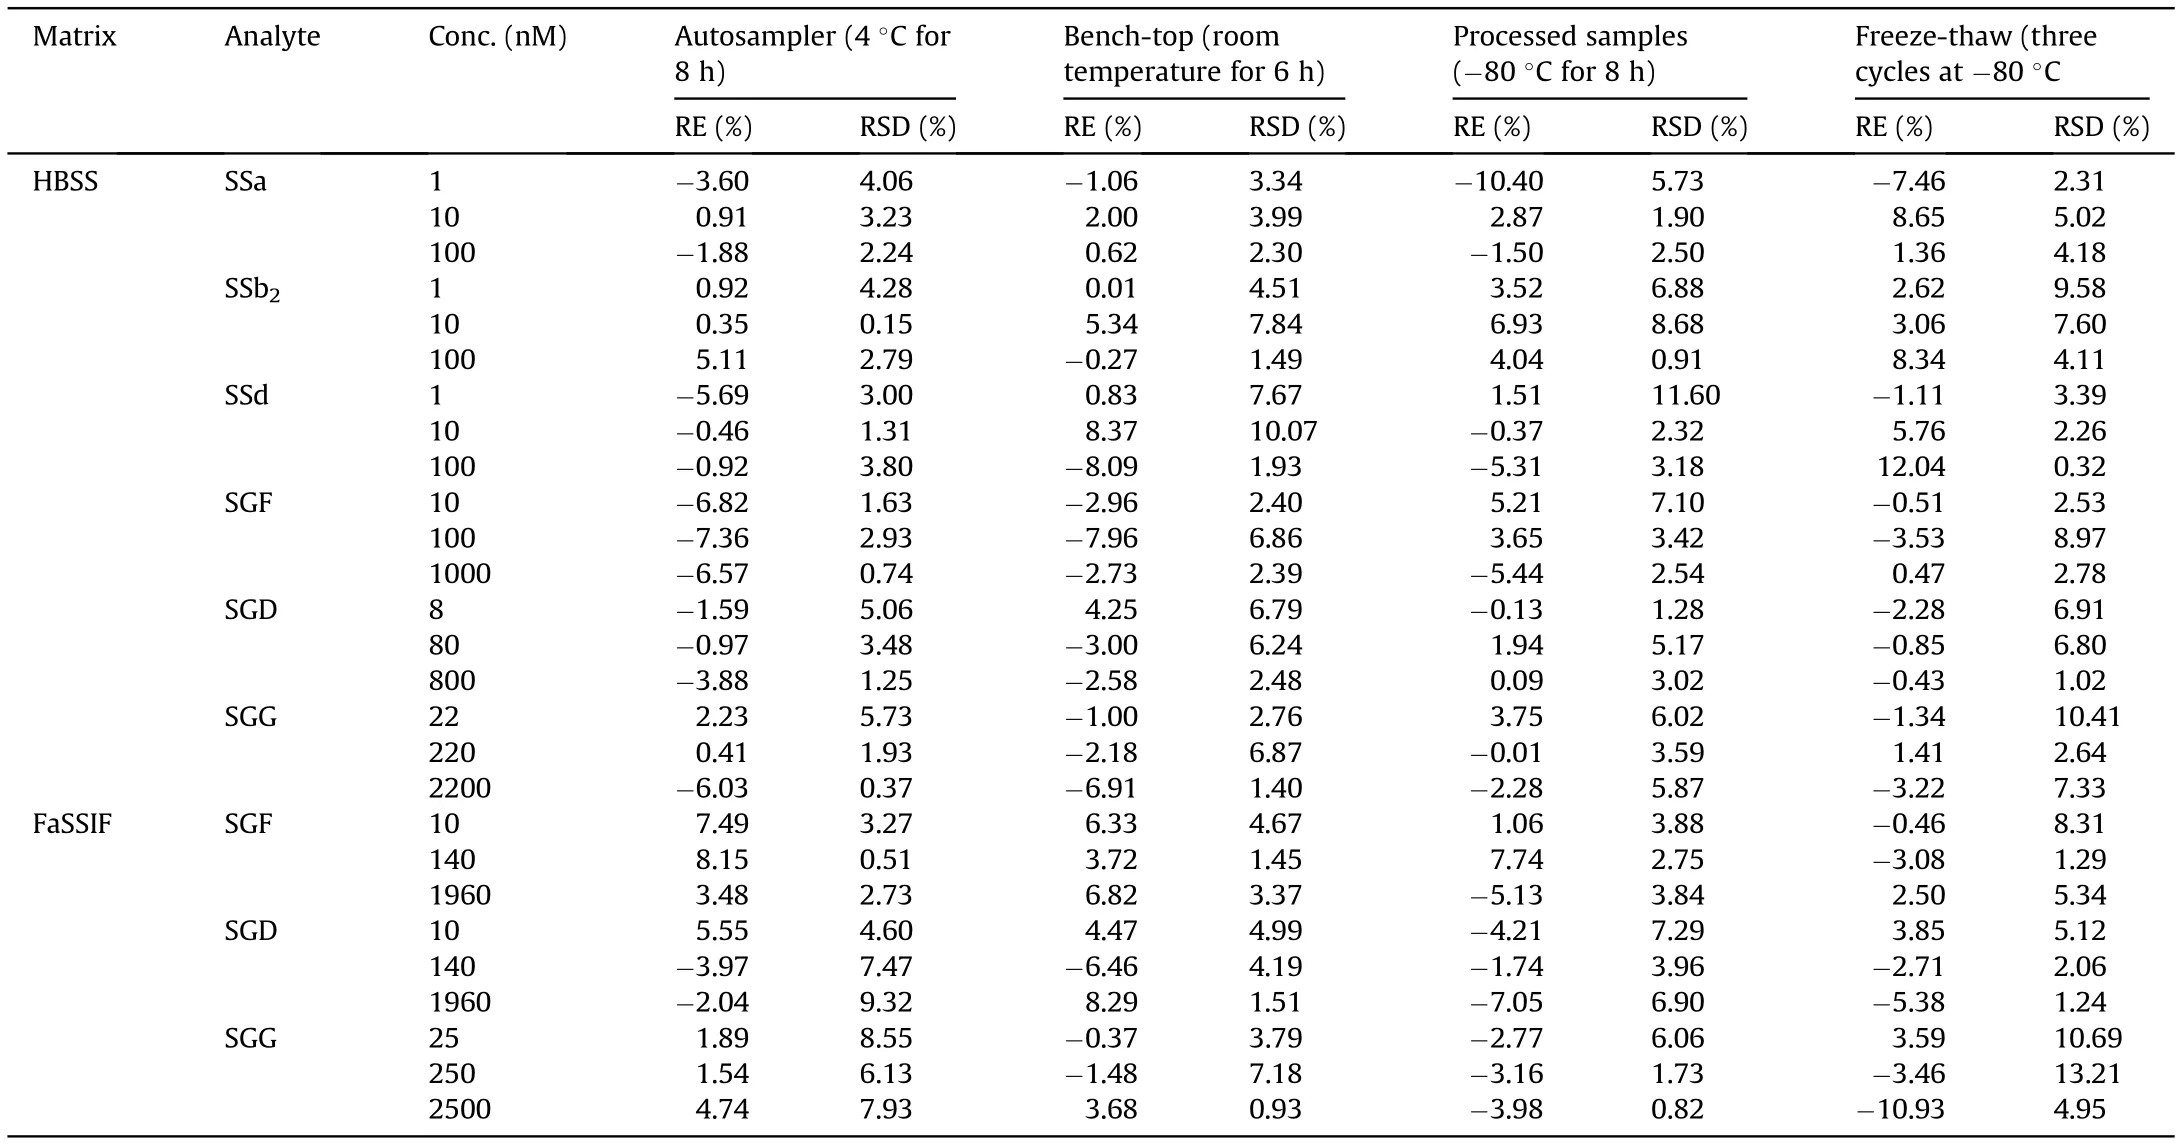
Table 3 Stability investigation of the three saikosaponins and saikogenins in HBSS, and the three saikogenins in FaSSIF (n =3).
Considering the high lipophilicity of SGF,SGG and SGD and their possibility of non-specific binding to the device surfaces,FaSSIF(pH 6.5) was chosen as an AP solvent [19] in SG transport system instead of HBSS, and 4% (m/V) BSA was added into BL medium(HBSS, pH 7.4) as well [20]. Compared with classic aqueous transport buffers, the use of FaSSIF as AP medium can significantly enhance the solubility and recovery of highly lipophilic compounds, mimic the intestinal environment, and have no compatibility issues with Caco-2 monolayer. Moreover, the predicted Pappvalues have not changed with the use of FaSSIF, especially for passively diffused lipophilic compounds [28]. In addition, adding BSA in moderation into BL buffer also can mimic human albumin level in the capillary lumen to provide a more physiological ‘sink’condition [26]. These optimizations in transport system of SGs improved the quality and the physiological relevance of the Caco-2 monolayer model, thus providing a valuable reference for evaluating the permeability of other lipophilic herbal ingredients by this model.
As shown in Table 4,the Papp(AP-BL)values of the three SSs were much less than 2×10⁻⁶cm/s,indicating a poor permeability and a predictive low transepithelial absorption in vivo (0%-20% fraction absorbed), while the three SGs were classified into the medium permeability class with Papp(AP-BL)values between 2 × 10⁻⁶and 10 × 10-6cm/s, predicting an in vivo absorption fraction of 20%-80% [26]. Meanwhile, the possible intestinal absorption mechanisms for these compounds were preliminarily speculated by comparing Pappvalues in two directions. The compound with approximately equivalent Pappvalues in two directions is transported by a passive diffusion. Otherwise, the compound is transported actively following a manner[27]that if the Papp(BL-AP)/Papp(AP-BL)<0.5 (ER <0.5), it is likely to be actively absorbed with the assist of uptake transporters; and if ER >2, it is likely to be actively secreted by efflux transporters. According to the determined ER values(Table 4),a passive transport was mainly involved in the intestinal absorption for SSa and SSb2. The same conclusion was also drawn from the previous experiment on the intestinal absorption of SSs using a rat in situ single-pass intestinal perfusion model [29]. Instead, certain uptake transporters were probably involved in the transport of SSd and the three SGs through the intestinal barrier because their ER values were significantly less than 0.5.However,given that the AP and BL solvents in mechanistic studies should be similar to exclude any external interference on the bidirectional transport of drugs[28],the active transport of the three SGs obtained from this study as well as the identification of specific transporter responsible for uptaking them from AP to BL would be further verified and explored in our subsequent investigation.
Based on our results, poor permeability may be one of the reasons for the low in vivo exposure of SSs presented in orally administered PK studies. Meanwhile, their deglycosylated derivatives produced by intestinal bacterial metabolism have a better permeability and may be more easily absorbed into the blood through the intestinal barrier. Therefore,SGs may exhibit a higher in vivo exposure than corresponding SSs at the same molar concentration from the perspective of absorption. Nevertheless, relative to the poor membrane permeability and absorption of SSs attributed to sugar moieties in their structures, the absorption of their deglycosylated derivatives (SGs) would be limited by the lower solubility if there was a lack of solubilization from some components in intestinal fluid (FaSSIF in this study). This kind of phenomenon was also observed in an absorption investigation on ginsenosides as well as their monoglycosides and aglycones[30].It has been recognized that like most orally administered drugs, theintestinal absorption of SSs and SGs is a combination of complex processes, governed by a number of factors which can be generalized as physicochemical factors of drugs and physiological factors of organisms [31,32]. Besides transport discussed in this study, more efforts should be made in other aspects relevant to intestinal disposition in further studies, so as to completely characterize as well as compare the intestinal absorption behaviors of SSs and SGs.Anyway,results obtained from this bidirectional transport study on Caco-2 cell monolayer model further validated the sensitivity and reliability of the novel UHPLC-MS/MS method,and provided a new perspective for a better explanation of the orally administered PK behaviors of SSs obtained from previous studies.4. Conclusions

Table 4 Bidirectional transepithelial transport of SSa, SSd, SSb2, SGF, SGG and SGD on Caco-2 cell monolayer model.
Here, a new UHPLC-MS/MS method for simultaneously determining the major active SSs (SSa, SSb2, SSd) in BR and their deglycosylated derivatives(SGF,SGD,SGG)was developed and fully validated, which was applied to the investigation on bidirectional transport of the six monomers mentioned above based on Caco-2 cell monolayer model.All the analytes in processed samples could be sensitively quantified in 7.5 min with outstanding selectivity,linearity,accuracy and reproducibility under the optimized sample pretreatment method and chromatographic conditions. The Pappvalues obtained from this study indicated that the permeability of SSa,SSb2and SSd improved after in vivo deglycosylation.Based on the ratio of Pappof bidirectional transport,the transport mechanism of each compound was preliminarily speculated.To the best of our knowledge, this is the first report in which the apparent permeability of the three SSs and that of the corresponding SGs were compared through Caco-2 cell monolayer model.Thus,the current method and our results would be useful in helping further characterize the intestinal absorption behaviors of these important components extracted or derived from BR.
Declaration of competing interest
The authors declare that there are no conflicts of interest.
Acknowledgments
This project was financially supported by the National Natural Science Foundation of China (No.81573626), the Open Project Program of Guangxi Key Laboratory of Traditional Chinese Medicine Quality Standards, China (No.201503), the Natural Research Foundation of Jiangsu Province, China (No. BK20161456), and the Qing Lan Project of Jiangsu Province, China (2017). We are especially grateful to Feng Xu (Center of Drug Metabolism and Pharmacokinetics, College of Pharmacy, China Pharmaceutical University,Nanjing,Jiangsu Province,China)for his help during this research.
Appendix A. Supplementary data
Supplementary data to this article can be found online at https://doi.org/10.1016/j.jpha.2020.06.006.
杂志排行
Journal of Pharmaceutical Analysis的其它文章
- A simplified LC-MS/MS method for the quantification of the cardiovascular disease biomarker trimethylamine-N-oxide and its precursors
- UHPLC-MS/MS analysis of cAMP and cGMP in rat plasma as potential biomarkers of Yin-Yang disharmony in traditional Chinese medicine
- Liquid chromatography-mass spectrometry method for the quantification of an anti-sclerostin monoclonal antibody in cynomolgus monkey serum
- Plasma-metabolite-based machine learning is a promising diagnostic approach for esophageal squamous cell carcinoma investigation
- Reducing SARS-CoV-2 pathological protein activity with small molecules
- Development of the general chapters of the Chinese Pharmacopoeia 2020 edition: A review
