Liquid chromatographic methods for determination of the new antiepileptic drugs stiripentol, retigabine, rufinamide and perampanel: A comprehensive and critical review
2021-09-14SrMeirinhorcioRodriguesAnFortunAmlcrFlcGilbertoAlves
Sr Meirinho , M′rcio Rodrigues ,b, An Fortun , Amílcr Flc~o ,Gilberto Alves ,*
a Faculty of Health Sciences, Health Sciences Research Center, University of Beira Interior (CICS UBI), 6200-506, Covilh~a, Portugal
b Research Unit for Inland Development, Polytechnic Institute of Guarda (UDI-IPG), 6300-654, Guarda, Portugal
c Coimbra Institute for Biomedical Imaging and Translational Research (CIBIT), University of Coimbra, 3000-548, Coimbra, Portugal
d Laboratory of Pharmacology, Faculty of Pharmacy, University of Coimbra, 3000-548, Coimbra, Portugal
Keywords:Bioanalysis Liquid chromatography Perampanel Retigabine Rufinamide Stiripentol
ABSTRACT The new antiepileptic drugs perampanel, retigabine, rufinamide and stiripentol have been recently approved for different epilepsy types. Being them an innovation in the antiepileptics armamentarium, a lot of investigations regarding their pharmacological properties are yet to be performed. Besides,considering their broad anticonvulsant activities, an extension of their therapeutic indications may be worthy of investigation,especially regarding other seizure types as well as other central nervous system disorders. Although different liquid chromatographic (LC) methods coupled with ultraviolet, fluorescence,mass or tandem-mass spectrometry detection have already been developed for the determination of perampanel, retigabine, rufinamide and stiripentol, new and more cost-effective methods are yet required. Therefore, this review summarizes the main analytical aspects regarding the liquid chromatographic methods developed for the analysis of perampanel, retigabine (and its main active metabolite), rufinamide and stiripentol in biological samples and pharmaceutical dosage forms.Furthermore, the physicochemical and stability properties of the target compounds will also be addressed.Thus,this review gathers,for the first time,important background information on LC methods that have been developed and applied for the determination of perampanel, retigabine, rufinamide and stiripentol,which should be considered as a starting point if new(bio)analytical techniques are aimed to be implemented for these drugs.
1. Introduction
Epilepsy is one of the most prevalent neurological diseases worldwide, affecting nearly 1%-2% of the population [1-4].Currently, there are more than 20 antiepileptic drugs (AEDs)available for clinical use, which are usually divided into three different generations. First-generation AEDs present several drawbacks such as narrow therapeutic indices, complex pharmacokinetic profiles, saturable metabolism, high plasma protein binding (PPB), and high potential for drug interactions,and may induce anticonvulsant hypersensitivity syndrome.However, the cumulative experience in its clinical application is extensive, this being the reason why these AEDs are still the first choice for many epilepsy disorders [5-9]. To overcome the aforementioned disadvantages and to achieve higher efficacy and better tolerability,second-generation AEDs were then developed,followed by third-generation AEDs, which began with the approval of lacosamide in 2008[5,6,8].Besides the improvements in their pharmacological profiles, third-generation AEDs also present some new chemical structures that allow them to act by new mechanisms of action, interact with different therapeutic targets and modulate different pathways of neuronal excitability that were not covered by first- and second-generation AEDs[5,10-12]. Thus, to increase therapeutic effectiveness, improve tolerability and decrease toxicity, the introduction of thirdgeneration AEDs as adjunctive therapy to patients already treated with other types of AEDs is frequent[6].Examples of AEDs with such characteristics are shown in Fig.1 and include retigabine (RTG) (known as ezogabine in USA), rufinamide (RFM), stiripentol (STP) and perampanel (PER). RFM and STP are both classified as orphan drugs since their therapeutic indications are specific for treating epileptic syndromes with a very low prevalence in population.Specifically,RFM is indicated to treat a severe,chronic, and multiple drug-resistance epileptic encephalopathy mostly characterized by the occurrence of multiple seizure types so called Lennox-Gastaut syndrome. It is also used in the treatment of super-refractory tonic-clonic status epilepticus and as adjunctive treatment of partial seizures in adults and adolescents[13-15].On the other hand,STP is indicated as adjunctive therapy with clobazam and valproic acid to treat Dravet syndrome not only in children, but also during adolescence and adulthood[16,17]. This syndrome, also known as severe myoclonic epilepsy of infancy, is another progressive epileptic encephalopathy[18-21]. Contrary to STP and RFM, RTG and PER are broadly used as adjunctive therapy in different types of epileptic seizures[2,5,22-26]. Recently, clinical evidence also shows that PER is effective in monotherapy for the treatment of focal seizures[4,27].
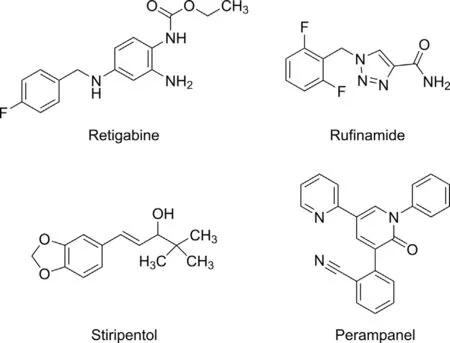
Fig.1. Chemical structures of retigabine, rufinamide, stiripentol and perampanel.
Although the new AEDs present a better safety profile,they are also associated with adverse and toxic effects,most of them being dose-dependent [6,7,18,26]. Hence, even though the therapeutic reference range for plasma/serum concentrations of these new AEDs is presently under debate, it is indisputable the important role that therapeutic drug monitoring (TDM) plays as a therapeutic guidance because epilepsy treatment is mostly prophylactic. Therefore, the application of TDM to these new AEDs is useful and,sometimes,critical[25,28-31].However,to accurately apply TDM, the measurement of RFM, STP, RTG and PER concentrations in plasma,serum or whole blood must be performed with validated bioanalytical methods. Though, to correlate AEDs concentrations with respective clinical effects, the concentration of drugs in brain may still be more determinant than that in blood.Nevertheless, as the drug quantification in patients' brains is not feasible, it is of great importance to perform non-clinical pharmacokinetic and pharmacodynamic assays in order to correlate, as accurately as possible, the plasma drug concentrations with drug concentrations in brain.For that,the development of methods for quantification of these AEDs in several laboratory animals’ matrices used to perform these studies becomes mandatory [30,32]. Considering the new AEDs, there is also evidence of important interindividual variability in their pharmacokinetics,which is mostly resultant from differences in the hepatic metabolism. In fact, pharmacokinetic properties and their influence on the pharmacodynamics must be investigated more deeply,particularly for new AEDs,such as RTG,RFM,STP and PER,since the information currently available is still scarce. Thus, to successfully and accurately obtain this evidence, drug concentration in biological samples must be measured and, for that reason,bioanalysis is crucial.In this context,it is important to use fully validated bioanalytical methods to generate reliable data. In addition, some analytical methods have also been developed for the quantification of the selected AEDs in pharmaceutical formulations,which is fundamental during quality control process of medicinal products. Therefore, this work aims to provide a comprehensive and critical review of some pharmacokinetic aspects of interest from a bioanalytical perspective for RFM, RTG,STP and PER, as well as to gather, for the first time, sufficient background information about several techniques involving liquid chromatography (LC) that have been reported for the determination of those AEDs in both biological matrices and pharmaceutical formulations.All these gathered data,herein discussed in an integrated manner, will be useful for supporting the development and validation of new and improved analytical methods for the determination of these target compounds(i.e.,RFM,RTG, STP and PER).
2. Pharmacokinetic properties
In general, third-generation AEDs have a more favorable pharmacokinetic profile than the old ones [5,31]. The main pharmacokinetic properties of RTG, RFM, STP and PER in humans are summarized in Table 1 [2,4,18-20,22,23,25,33-39].
Except for RTG, which shows an oral bioavailability of 60%, all the other three AEDs have a high oral bioavailability (≥85%), with PER presenting the ideal value of approximately 100%.On average,the time to reach maximum plasma concentration(tmax)after oral administration is shorter for both RTG and PER, than that for STP and RFM [2,4,15,23,25,36,38-40]. Food is also responsible for RTG and PER tmaxdelay up to 2 h, but for both drugs, the extent of absorption and their bioavailability are not substantially affected[2,4,18,22,23,38,39]. In the case of RFM and STP, they are recommended to be administered with food, because it is demonstrated that food intake not only increases the bioavailability of RFM[15,36], but also protects STP from fast degradation in the acidic environment found on an empty stomach [20]. Actually, STP degradation in acidic conditions was demonstrated during a stability study that used 0.5 M hydrochloric acid,a similar condition of the stomach environment [41]. Regarding PPB, there are some differences between the four AEDs (Table 1). STP and PER are particularly characterized by high PPB values of 99% and 95%respectively, being for that important to take these values into consideration when determination of plasma concentrations is performed, particularly during TDM studies and therapeutic reference ranges optimization[5,19,32,38,42].By analyzing Table 1,it is also evident that there are different characteristics in relation to apparent volume of distribution (Vd) and elimination half-life (t1/2el). RTG shows a larger Vdcomparatively with PER and RFM[22,23]. Regarding RFM and PER Vdvalues, it can be expected thatboth present similar body distribution patterns [15,18,36,40]. In case of STP, its Vdvalues were found to be variable, probably as a result of its non-linear pharmacokinetics, its strong PPB and its complex and extensive metabolism[18,20].In fact,as illustrated in Fig. S1, STP extensive hepatic metabolism involves four different metabolic pathways (i.e., glucuronidation, oxidation of the methylenedioxy ring system, hydroxylation of t-butyl group, and conversion of the allylic alcohol chain to an isomeric 3-pentanone structure) [19,34,42-45]. Similarly to STP, PER also presents an extensive hepatic metabolism (Table 1) mainly mediated by CYP3A4 and CYP3A5 and, subsequently, by phase II reactions,originating inactive metabolites (Fig. S2) [38]. Contrary to STP and PER, RFM and RTG appear to have a less complex hepatic metabolism.In fact,clinical studies proved that RFM is not metabolized by CYPs, but rather by hydrolysis through carboxylesterases into inactive metabolites (Fig. S3) [36,40,46,47]. In the case of RTG, its metabolism is exclusively by phase II enzymes (Fig. S4)[2,26,35,48,49]. One of the metabolites formed during RTG metabolism is N-acetyl-retigabine,which has been a study target due to its potential anti-seizure activity revealed in animals,being for that a strong candidate for further pharmacologic studies[22,23,26,35,50-53].However,one of the most challenging steps in the quantification of both RTG and the active metabolite N-acetylretigabine is the lability of N-glucuronide metabolites that are rapidly back-converted to RTG and N-acetyl-retigabine, creating a possible overestimation on its plasma concentration values. So,aiming to overcome this challenge, several works have been published focusing not only on the study of RTG metabolism and Nacetyl-retigabine pharmacological activity,but also on this stability issue [50-53].
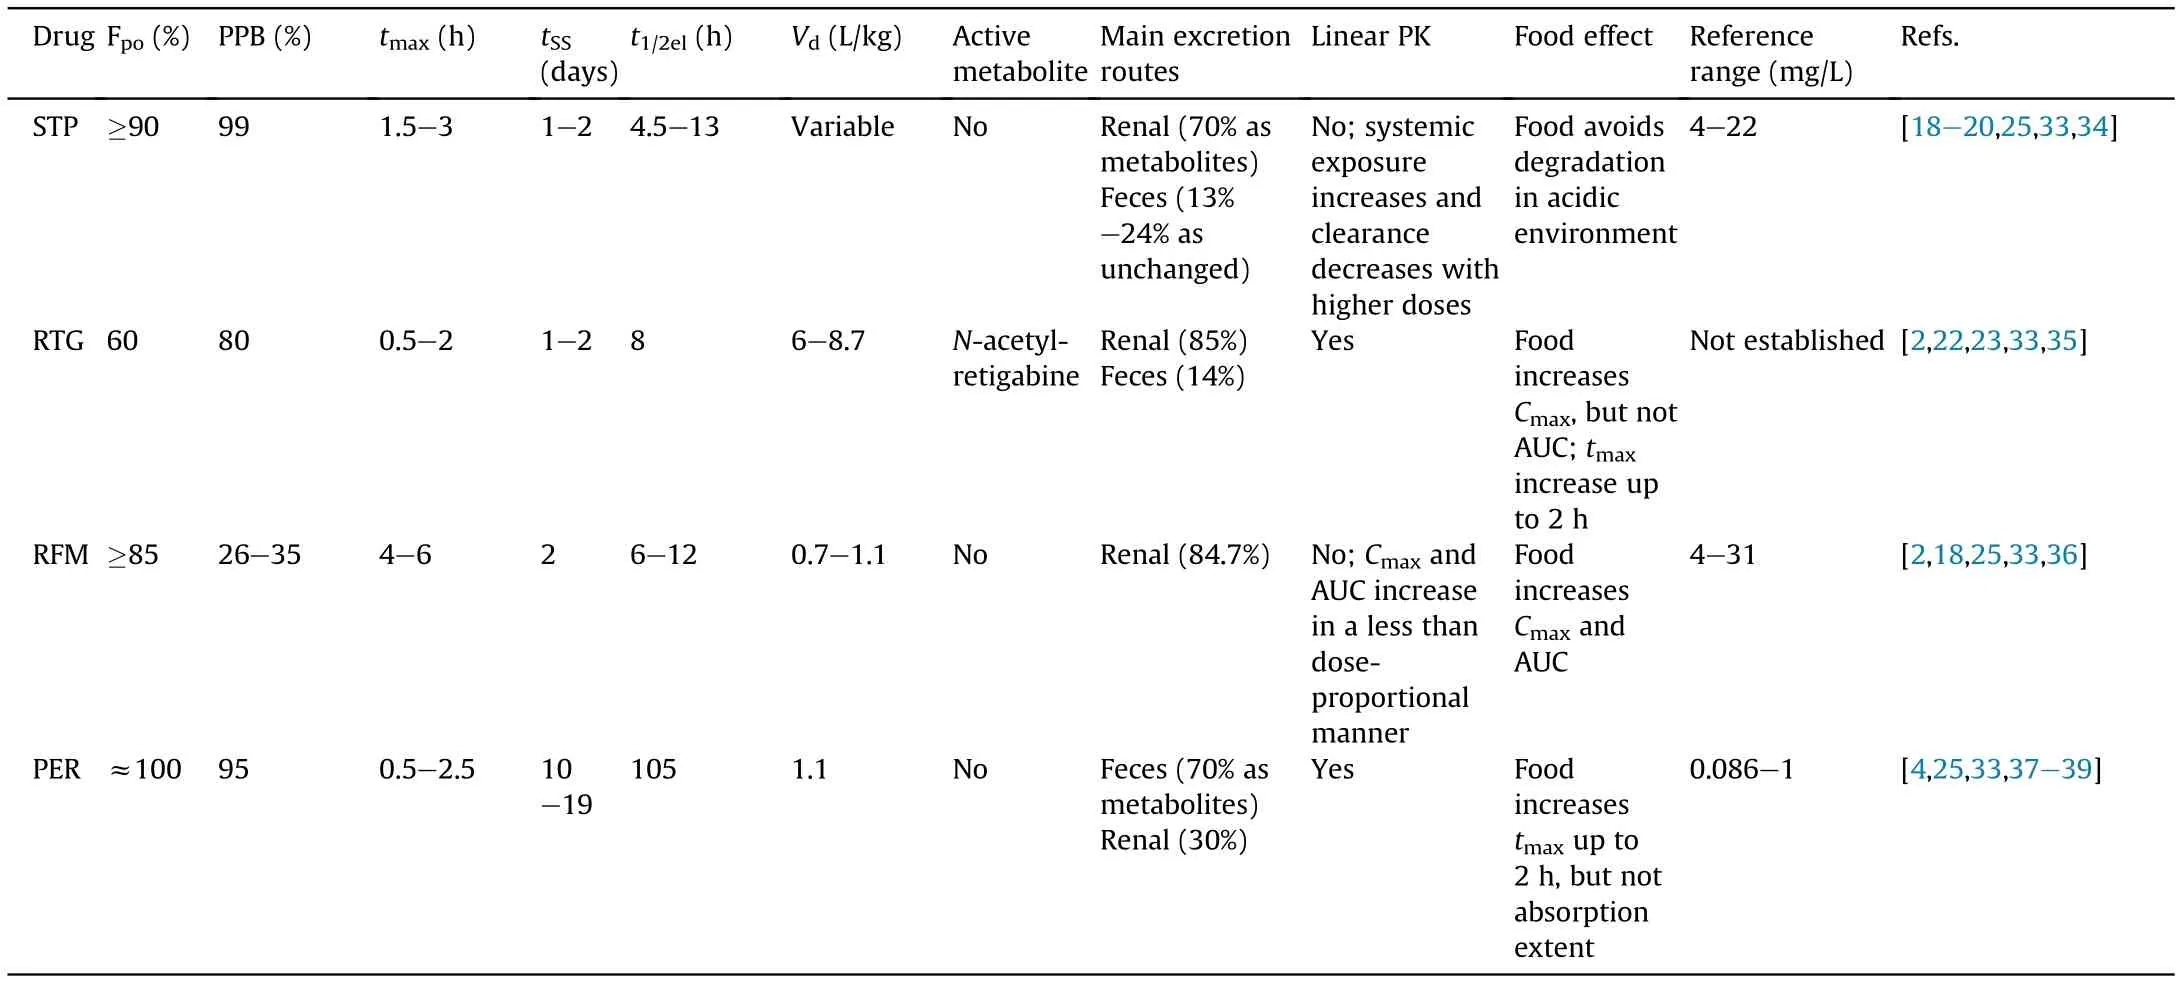
Table 1 Main pharmacokinetic properties of the new antiepileptic drugs stiripentol (STP), retigabine (RTG), rufinamide (RFM) and perampanel(PER) in humans.
In order to achieve an appropriate seizure control and a suitable TDM,therapeutic reference ranges have already been proposed for STP, RFM and PER, but not yet for RTG (Table 1). For the implementation of TDM in clinical practice,the availability of therapeutic ranges and suitable bioanalytical methods for measurement of drug concentration levels are useful, allowing the adjustment of patient's medication regimens and the improvement of its therapeutic outcomes [25,28-30,33]. Validated bioanalytical methods are required to determine these AEDs concentrations in order to establish relationships between pharmacokinetic and pharmacodynamic properties,to better monitor patients'therapy with these new antiepileptics using TDM and to perform other valuable studies that can lead to an increase of the clinical and non-clinical knowledge regarding these new AEDs. Thus, this review will further focus on LC techniques already available in literature for RTG and N-acetyl-retigabine, RFM, STP and PER.
3. Physicochemical properties and drug stability
For the development of new bioanalytical methods, firstly we should consider the physicochemical properties of the target analytes.In case of RTG,RFM,STP and PER,up to date,the information available in literature regarding those properties is still scarce(Table 2) [37,38,41,54-65].

Table 2 Physicochemical properties of stiripentol (STP), retigabine (RTG), rufinamide (RFM) and perampanel (PER).
Considering their chemical structures, depicted in Fig. 1, the differences between the chemical groups that assembly these four AEDs are evident.PER is chemically a 2-(2-oxo-1-phenyl-5-pyridinyl-1,2-dihydropyridin-3-yl) benzonitrile hydrate, whose structure is responsible for the selective non-competitive antagonism of AMPA ionotropic glutamate receptors [38,64,66]. STP (4,4-dimethyl-1-[3,4(methylenedioxy)-phenyl]-1-penten-3-ol) is an aromatic allylic alcohol with no carbonyl or nitrogenous heterocycle in its structure that usually is responsible for the antiepileptic properties of the majority of AEDs.A particular feature of STP is the presence of a chiral center in C-3,resulting in a racemic mixture of R(+)-STP and S(-)-STP enantiomers,with the R(+)-STP presenting an anticonvulsant potency approximately 2.4-fold greater than that of the S(-)-enantiomer [34,41]. RFM (1-[(2,6-difluorophenyl)methyl]-1H-1,2,3-triazole-4-carboxamide) presents a triazole ring that can be responsible for its activity in different seizure types being,until now,the first AED with that unique chemical structure[15].On the other hand,RTG(N-(2-amino-4-(4-fluorobenzylamino)phenyl carbamic acid ethyl ester) is an ester similar to the central analgesic flupirtine but structurally different from any other AEDs[49]. All four AEDs are weak bases [37,54,57-59,61], being their water solubility dependent on the pH values of the dissolution media. Therefore, a higher solubility is expected in acidic aqueous conditions instead of basic aqueous solutions,being this evident for PER and RFM, which have a higher solubility in a 0.1 M hydrochloride acid solution than in water(Table 2).Indeed,Rogawski and Hanada [64] stated that an explanation for PER fast absorption in the upper gastrointestinal tract is the rapid dissolution of the charged species in acidic conditions as gastric acid. PER, RTG and STP present a low water solubility,which is reflected by their high values of octanol/water partition coefficient (Log P) and distribution coefficient(Log D)measured in a buffer with a pH value of 7.4[55,56,58,60,65,67] (Table 2). Therefore, a higher solubility of PER,RTG and STP in organic solvents is expected,being this a reasonable explanation to prepare their stock and working solutions using medium polarity solvents as acetonitrile[68-72],methanol[73,74]and ethanol[75-77].In opposition,by analyzing RFM Log P and Log D values, this AED presents a lower lipophilic profile when compared with PER, RTG and STP [63]. This could be the reason why, in several studies, RFM powder dissolved in methanol is mentioned[62,78-81],a most polar solvent than acetonitrile, in a mixture of acetonitrile and water [82-85], or in a mixture of methanol and water or other polar solvents [86,87].
Another key factor to be considered in the development of new chromatographic methods is the stability of the analytes in biological samples and in stock and working solutions. Stability is usually related to compounds physicochemical properties, storage conditions,container systems,and the biological matrix itself[88,89].The acceptance criteria for stability studies in biological samples are well described in the Guideline on Bioanalytical Method Validation[89]of the European Medicines Agency and in the recent FDA Guidance for Industry: Bioanalytical Method Validation [88]. Both guidelines refer that testing should cover the stock and working solutions stability as well as the analytes stability during sample collection, handling,storage and analysis. The accuracy of these assays at each concentration level should bewithin±15%of nominal concentrations.All the revised publications that performed stability studies adopted this acceptance criterion, and these studies are summarized in Table 3[41,50,62,69-72,74-78,80-82,84,86,90-97].
Regarding short-term stability assays in biological matrices, for the studied AEDs, this period varied between 1.5 h [78] and one month [82], being the most common short-term stability studies performed after 24-72 h.In a particular case in which dried blood spots samples was used,la Marca et al.[82]exceptionally evaluated RFM stability after one month at room temperature, and proved that this form of sampling could be kept in these storage conditions for at least one month. Stability studies under refrigerated storage conditions(e.g.,4°C)are also frequently performed;STP,RTG,RFM and PER were shown to be stable after at least 24 h in those conditions. Besides, stability after three freeze-thaw cycles (24 h per cycle) and long-term stability tests performed at freezing temperatures in a time period ranging from 3 weeks to 376 days were also demonstrated for the four compounds. All storage conditions(sample type, storage time and temperature) applied in stability studies of the AEDs here studied are also described in Table 3.
Contrary to stability determination in biological matrices,only a few studies determined stability of PER,RTG,RFM and STP in stock and working solutions(Table 3).In several studies,the focus was to evaluate the AEDs stability in bulk and pharmaceutical forms and to investigate their degradation products and impurities[41,69,70,74,84,87,93,94,98], being that of great interest for the pharmaceutical industry. Stress degradation studies were carried out under acid and basic hydrolysis, oxidation, thermal and photolytic forced conditions.RTG proved to be sensitive to UV light exposure and susceptible to acidic and basic hydrolysis. Furthermore, like RFM, RTG can also be destroyed under oxidative conditions [69,74,84,94], while RFM and STP are degraded by acid hydrolysis[41,84,87].In fact,STP instability in acidic conditions has practical implications, being mandatory to administer this drug orally with meals in order to avoid its acidic degradation by gastric acid[20].In all cases,none of the degradation products showed to interfere with the retention time of the analyte.
4. Sample preparation
Sample preparation procedures are critical and time-consuming steps applied to biological samples before the analysis of target analytes.Besides the great impact on nearly all the later analytical steps, sample preparation is essential since the presence of small molecules and macromolecules,salts and other matrix endogenous compounds may influence the detection of the analytes under investigation. Furthermore, those interferences can also be incompatible with the chromatographic system, particularly with chromatographic columns [99-101].
Before the beginning of sample pretreatment, it is common to add an internal standard(IS)to the sample.The use of an IS aims to compensate the loss of analytes during all steps of sample preparation and chromatographic procedures, leading to an increased accuracy and precision of the method [89,102,103]. The IS compound should preferentially have a chemical structure and physicochemical properties comparable to those of target drugs, must not be present in the original samples and not react or be destroyed by the sample components,mobile phase or stationary phase of the chromatographic columns. In some bioanalytical methods, the compounds used as IS are drugs clinically used to treat diseases which,in some cases,include epilepsy.In these cases,an extra care must be taken in order to understand whether the IS used is or is not present in the therapeutic regimens of the studied patients; if not,the method can be safely applied in sample analysis.Chemical structures of IS that have been used in bioanalytical assays for quantification of the target AEDs herein considered (i.e. STP, RTG,RFM and PER) are shown in Fig. S5. By comparing the chemical structures of STP,RTG,RFM and PER with the respective structures of the compounds used as IS for each AED analysis,the resemblance between them becomes quite evident.A good example of this is the use of flupirtine as IS in the determination of RTG in human plasma[91].Regarding this matter,some studies have even used analogue compounds or labeled isotopes of the original analytes to increase the similarities,which is preferable to the use of other compounds[50,75,76,85,92,104].
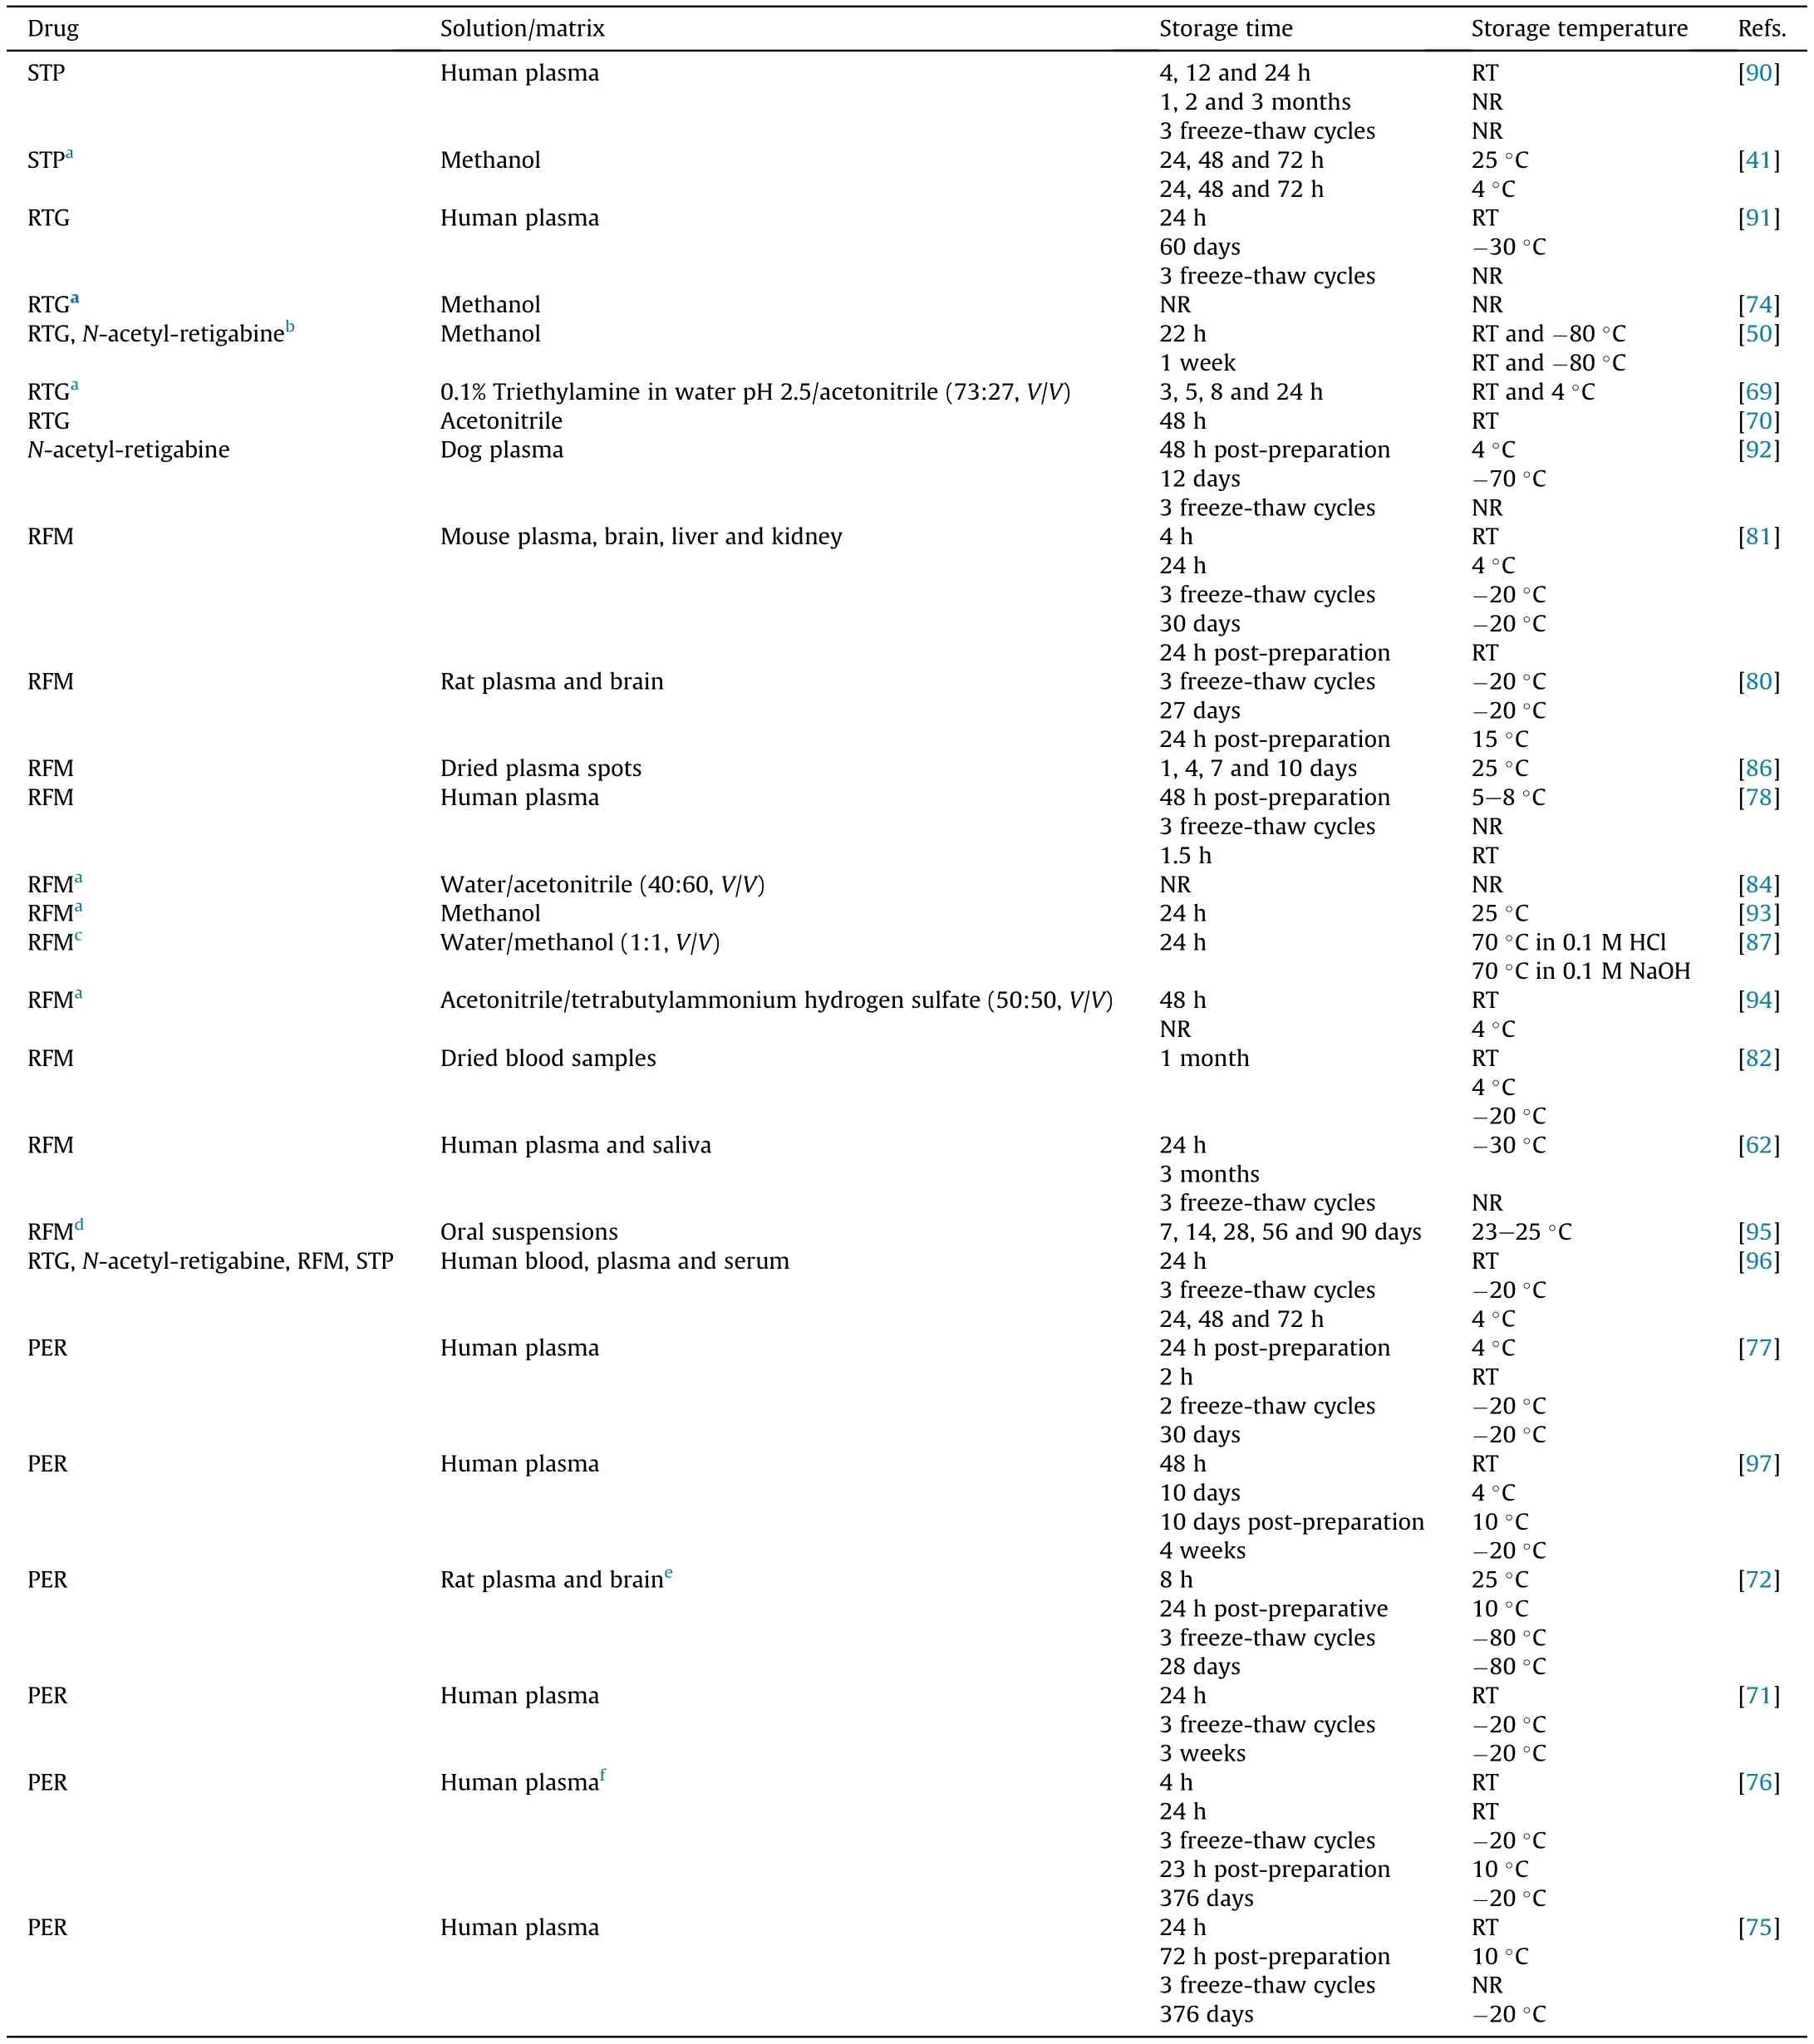
Table 3 Stability of stiripentol (STP),retigabine (RTG), rufinamide (RFM) and perampanel(PER) in organic solutions and in human and animal biological matrices.
Despite the recent advances in the development of miniaturized techniques for sample preparation, e.g., microextraction by packed sorbent (MEPS) [105] or salting-out assisted liquid-liquid extraction (SALLE) [106,107], conventional techniques as solidphase extraction (SPE), liquid-liquid extraction (LLE) and protein precipitation(PP) are still the most widely used.Considering the information summarized in Table 4 [40,42-44,47,50,51,62,71,72,75-83,85,86,90-92,96,97,104,108-116], it is evident that conventional sample preparation approaches (LLE,PP and SPE) continue to be the most applied techniques in studies involving the quantification of STP, RTG, N-acetyl-retigabine, RFM and PER.
By analyzing Table 4,it is evident that LLE was the most common extraction procedure used to determine STP in biological samples[42,44,108,109,112]. Also, several studies aiming to determine RTG and N-acetyl-retigabine[50],PER[75,76]and RFM[62,81,114]used this sample preparation technique. Instead of following conventional LLE procedure, Perez et al. [50] determined RTG and Nacetyl-retigabine in human plasma and urine using an automated LLE procedure based on a 96-well plate format, so that the study could be less time-consuming. This wide use of LLE can be explained by the AEDs lipophilic character that allows their transfer from the aqueous phase (matrix) into the organic phase (solvent).However, since all of them have polar groups in their chemical structures,the organic extraction solvent must be carefully chosen in order to increase analyte extraction efficiency. Considering all the LLE revised techniques, the organic extraction solvents mostly used were ether derivatives, dichloromethane and ethyl acetate,resulting in variable recovery values (Table 4). In fact, Mano et al.[75,76] have developed two different methods for PER quantification in human plasma using different detection systems and, in both, LLE was the selected extraction procedure. In one of the methods, methyl tert-butyl ether was used [75] instead of diethyl ether[76],obtaining higher recovery values with methyl tert-butyl ether. That suggests differences in the extraction capacity of these two different ether derivatives. However, in some cases, high recovery values need to be sacrificed in order to achieve appropriate selectivity. Globally, considering all the LLE procedures summarized in Table 4,it can be seen that the recovery values obtained are quite variable. In some situations, those values can be so low that discourage the use of LLE comparatively to other extraction procedures such as PP. In fact, a simple, fast and inexpensive sample preparation approach largely used for blood and plasma samples is PP. Acetonitrile and methanol have been shown to be the precipitating agents that provide the best recoveries of analytes. Nevertheless,in some cases,the supernatant may still contain significant interferences of non-precipitated matrix components that can impair the analyte quantification; in these circumstances, PP may be combined with other extraction procedures. As depicted in Table 4, two clear examples of that situation are described by Meirinho et al.[81]and Perez et al.[50].Both studies applied a PP step previously to LLE procedure in order to obtain cleaner sample extracts, which improved the selectivity for RFM quantification in mouse matrices and for N-acetyl-retigabine and RTG quantification in human plasma and urine, respectively. However, by observing
Table 4, it is also clear that PP alone is the sample preparation approach most commonly used for PER and RFM determination[46,47,71,72,77-80,82,86,96,97,116]; on the contrary, PP alone was uniquely applied in one assay for the determination of RTG in brain tissue samples [113]. PP was the sample preparation technique employed by Deeb et al. [115] for the simultaneous determination of STP,RTG,N-acetyl-retigabine,RFM and seventeen other AEDs in postmortem samples.
Specifically,with regard to precipitating agents,acetonitrile was the most frequently used organic solvent, allowing AEDs determination within target ranges and minimizing matrix effects[41,43,47,71,72,77,79,82,90,96,97,110,113,116].Actually,in the study by Paul et al. [72], methanol and acetonitrile were tested and compared as protein precipitating agents,with PER peaks showing better characteristics when acetonitrile was used. Even though methanol is not considered as a better precipitating agent than acetonitrile,it is another organic solvent commonly used in several works to precipitate proteins[78,80,86,115].Another alternative for PP considered in two different studies was the use of a mixture of acetonitrile and methanol (90:10, V/V), aiming to achieve a better selectivity compared with the use of a single organic solvent[43,46].
SPE is another sample preparation technique, which is of great value in bioanalysis. It provides high recoveries, effective preconcentration of the analytes and is of easy automation; its key advantage is its ability to remove phospholipids and proteins.In the reviewed SPE techniques that aimed the extraction of N-acetylretigabine, RTG and RFM from biological matrices, most of the studies referred to the use of cartridges containing silica-based sorbents with ethyl carbon chains (C2), octyl carbon chains (C8) or octadecyl carbon chains (C18) [51,53,83,85,91,92,104]. It is well known that the characteristics of these silica beds increase the retention degree of hydrophobic,non-polar basic analytes.So,once RFM, RTG, STP and PER present weak basic features with clear lipophilic profiles, this could be a probable justification for the frequent use of these cartridges in these analytes’ extraction from biological matrices[117].Differently from the majority of studies that used silica-based columns in conventional SPE format,Bu et al.[92]performed a unique study involving the determination of N-acetylretigabine in dogs plasma resorting to an Oasis HLB μElution column integrated in an automated off-line 96-well plate configuration. In fact, this type of SPE columns contain co-polymers in its sorbents that do not require care in the prevention of column dryness;therefore, the critical steps when using Oasis HLB cartridges are sample adsorption and elution rather than conditioning or washing steps,contrary to what happens when silica-based columns are used[118]. Besides this study, other automated SPE systems were also applied,particularly to determine RTG and its main active metabolite[104]and RFM[83,85].In fact,if automation was applied in all types of sample preparation procedures, it could increase the throughput of bioanalytical methods, making bioanalysis more cost-effective.The most common automated on-line PP, SPE and LLE configuration is the 96-well plate format that allows a faster analysis of the samples[99-101].Actually,the use of on-line SPE 96-well plates has proven to be a much quicker method, having smaller sorbent bed amounts than traditional SPE cartridges and using fewer amounts of organic solvents.In addition,evaporation or reconstitution steps are not required before sample injection into high-performance liquid chromatography(HPLC)system [83,99].A clear example of this online method was described by Rouan et al. [83], which used a C18Empore®disc 96-well extraction plate,obtaining satisfactory results with no need to suppress RFM ionization as a consequence of its weak base characteristics.Also,for the determination of RTG,Knebel et al. [104] applied another on-line SPE technique based on a column-switching mechanism that allowed the direct wash of matrix compounds immediately into the waste and right after the sample loading in the column. Then, a valve was switched and the retained analytes were eluted with a strong mobile phase to the analytical chromatographic system.This means that while a sample is being analyzed,another sample is capable of being loaded in the extraction column. So, this assay has shown to be faster and more efficient than off-line SPE [104]. High recoveries were always obtained when using SPE for extracting RTG and RFM from biological samples, presenting values ranging from 63.8% to 106%. Only the study that aimed the determination of N-acetyl-retigabine in dogplasma has shown a low recovery(37%),which was explained by the loss of some amount of N-acetyl-retigabine together with N-glucuronide-N-acetyl-retigabine removal[92].Curiously,to the best of our knowledge,none of the studies aiming to determine STP and PER in biological samples used SPE.An explanation for it could be that both AEDs present a highly lipophilic character,making PP and/or LLE two more promising and economical techniques than SPE.
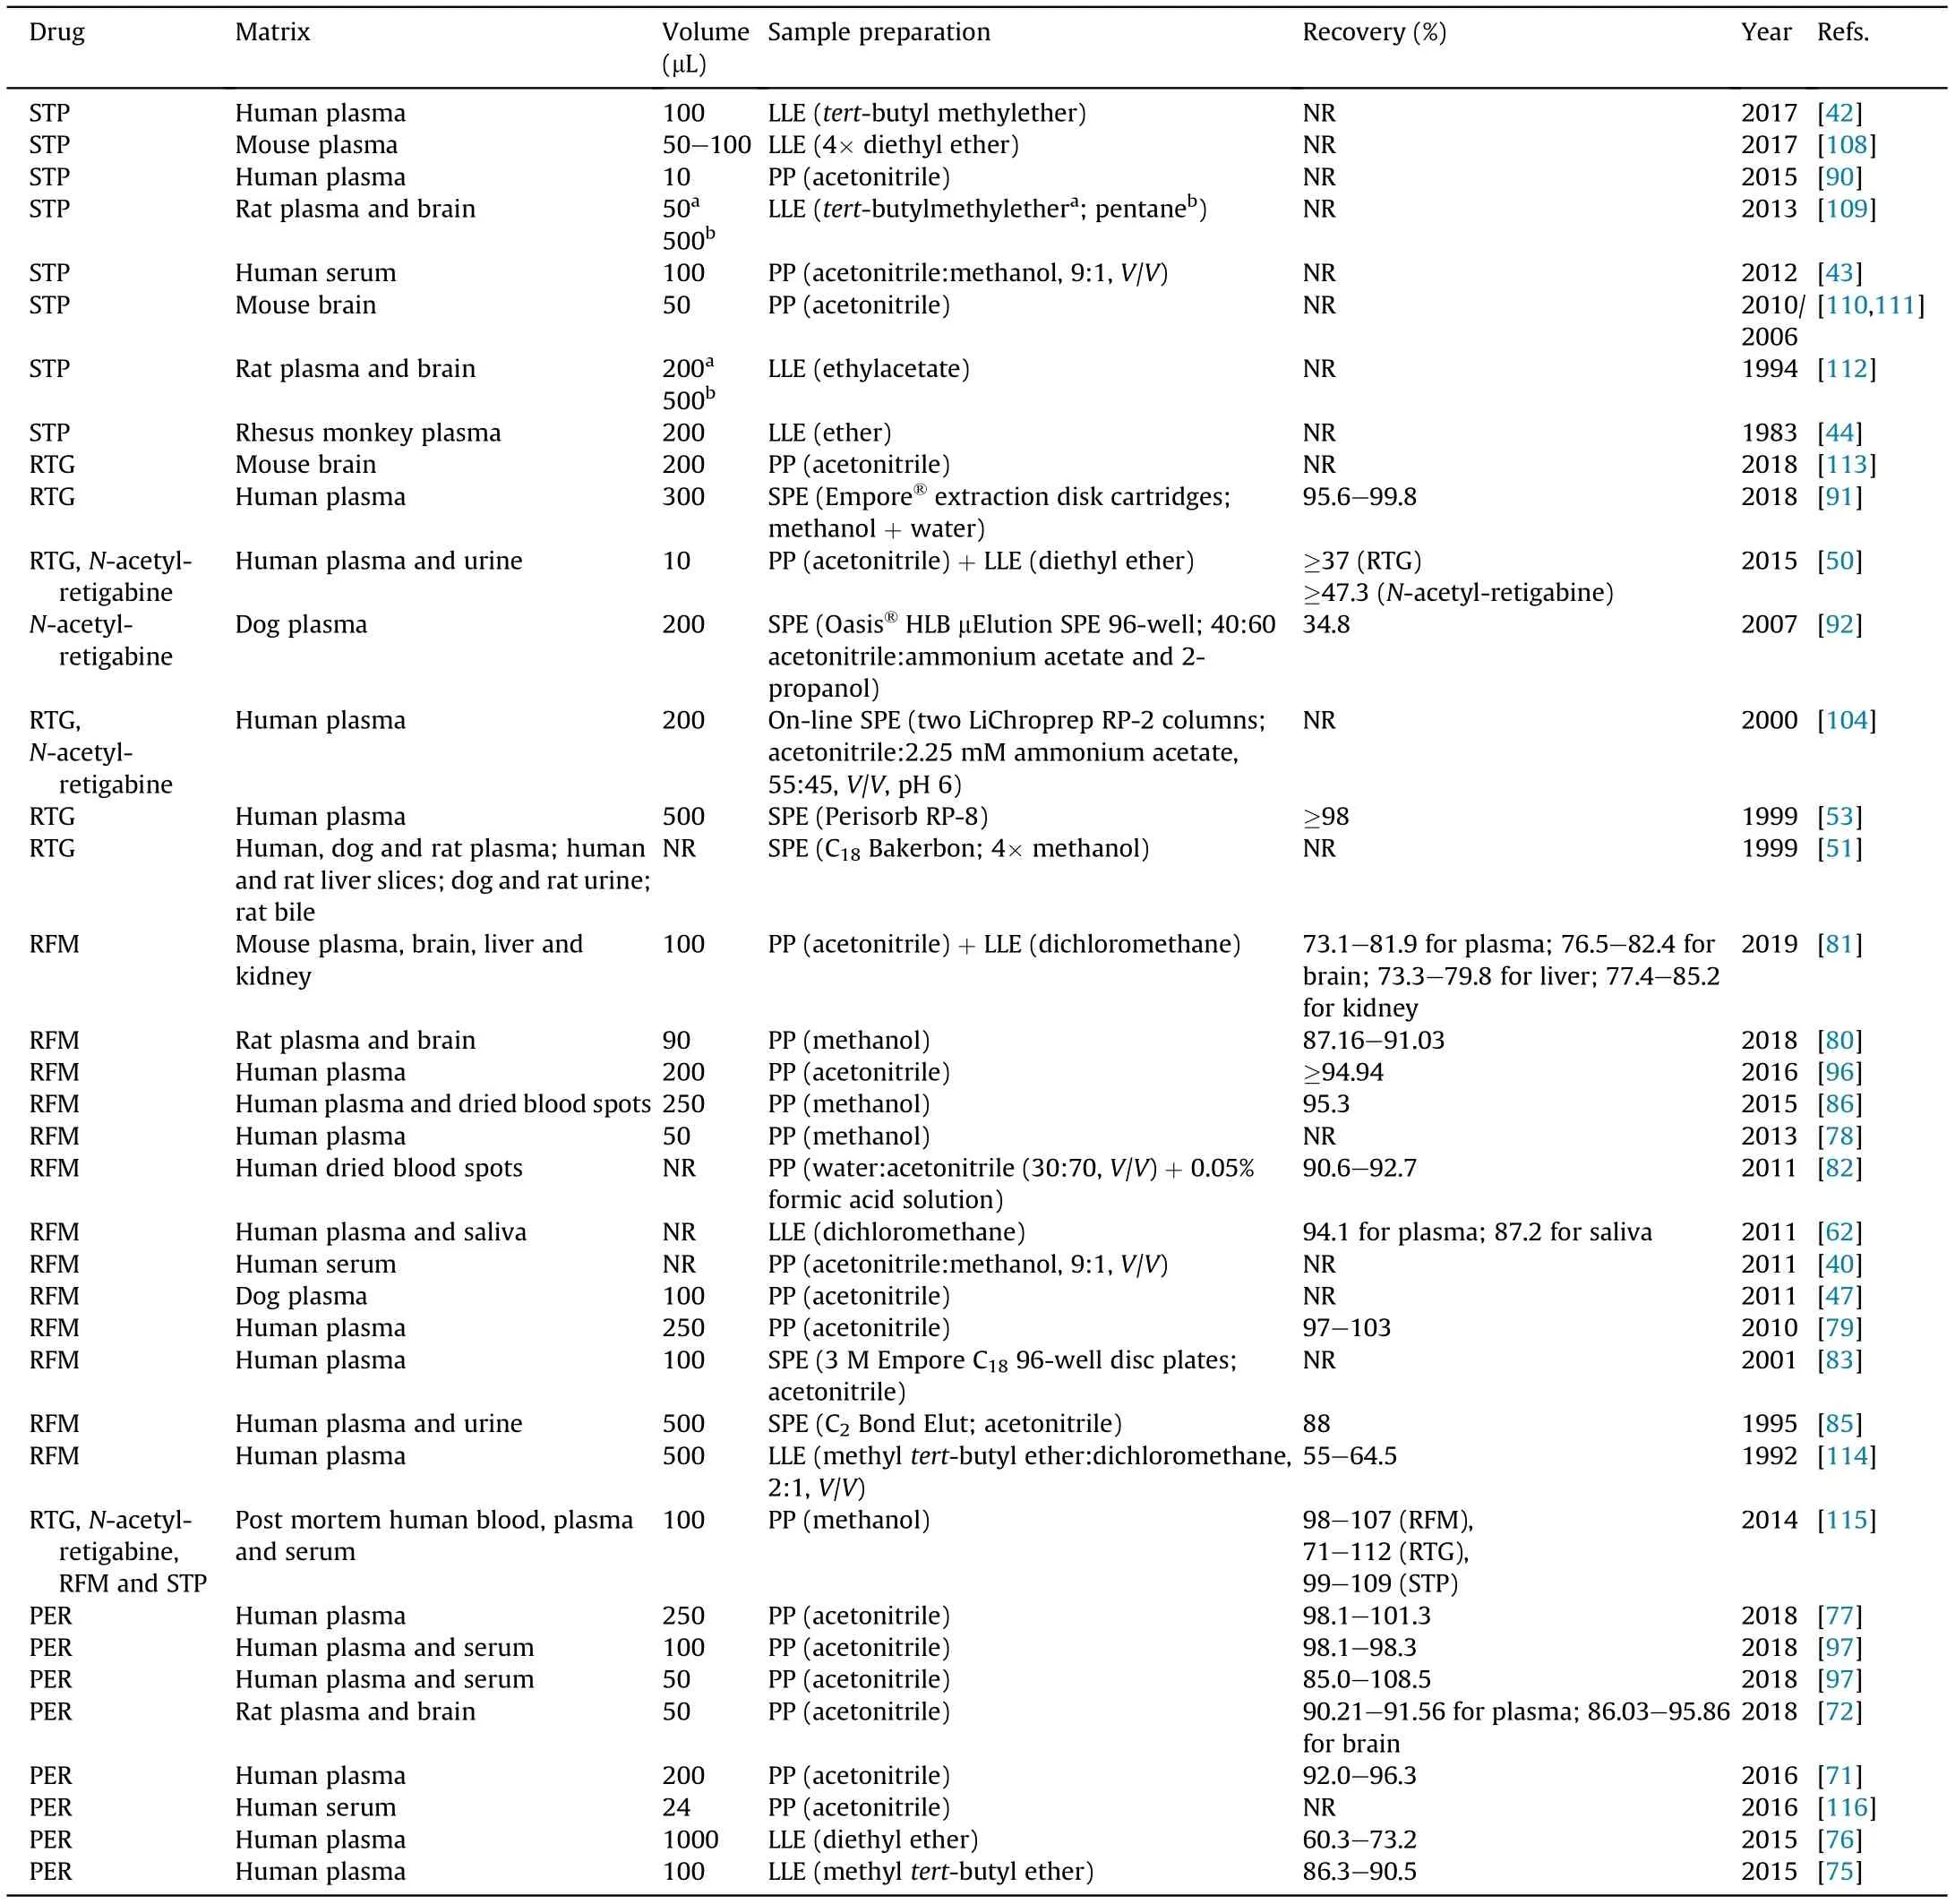
Table 4 Sample pre-treatment and recovery values obtained of the antiepileptic drugs stiripentol (STP), retigabine (RTG) and its active metabolite N-acetyl retigabine, rufinamide(RFM) and perampanel(PER) from biological matrices.
Considering miniaturized extraction techniques (e.g., MEPS,SALLE), until now, there are no available reports in literature that have used any of these procedures for the analysis of biological samples containing STP, RTG, N-acetyl-retigabine, RFM or PER.Hence, the application of miniaturized techniques is a field that deserves to be explored. Indeed, the cost reduction when using these miniaturized procedures is their major advantage, as they allow the reduction of the amount of sample and the volume of organic solvents. In addition, simple and fast experimental execution, compatibility with various analytical instruments, the possibility of automation, as well as the chance of combination with other extraction techniques are other advantages[99,105,106].
There are particular situations where biological samples are only subjected to dilution, filtration and/or centrifugation steps,making it difficult to remove contaminants and other unwanted analytes [99,100]. Based on the gathered information, dilution combined with filtration or centrifugation was only used for determination of RTG, RFM and STP in bulk and pharmaceutical formulations. In these cases, compounds were weighed and, if appropriate,powdered to be dissolved in a selected solvent and,in some situations,diluted,filtered,sonicated and/or centrifuged to be finally injected into the chromatographic system[41,68-70,73,74,84,87,93,94,98,119,120].
Thus,gathering all the collected information about the different preparation procedures used in samples containing STP, RTG, Nacetyl-retigabine, RFM or PER, the authors suggest that in less complex matrices, simpler methods such as PP, or even mere dilutions steps and centrifugation/filtration procedures can be used.However, if samples are expected to be more complex (e.g., liver and kidneys), more complex procedures such as SPE, or even a combination of several preparation methods may be necessary to assure suitable selectivity, even with the risk of compromising the analytes recovery.
5. LC methods
Over the years, several LC methods have been developed to determine the new AEDs STP, RTG, RFM and PER (Table 5)[40-44,47,50-53,62,68-87,90-98,104,108-116,119,120]. Actually,in the last decade,LC has been the dominant methodology used for analytical and bioanalytical purposes in laboratories worldwide especially in the pharmaceutical field.
To the best of our knowledge,the first HPLC method reported in literature for STP quantification had the purpose to study its complex pharmacokinetic profile in rhesus monkey plasma [44]. Over the times,HPLC has become an important tool to better understand the pharmacokinetic behavior of STP, RTG, RFM and PER, with a particular focus on their metabolism and drug interactions.In fact,several studies have applied HPLC to help elucidate the N-glucuronidation[52,53],N-acetylation[50,92,104]and other possible RTG metabolic routes [51]. The extensive investigation on the metabolism of RTG is related to the evidence that N-acetyl-retigabine presents anticonvulsant activity, which justifies the availability of some HPLC methods specifically developed and validated to quantify this metabolite in biological matrices [50,92,104].
Several HPLC methods have also been employed to support the evaluation of the pharmacokinetics and pharmacological behavior of the AEDs herein addressed (i.e., STP, RTG, RFM and PER). Evaluating the different pharmacological activity and neurotoxicity of the two STP enantiomers[112],studying STP pharmacokinetics and its interactions with other co-administered drugs in pediatric population [42] or in a genetic mouse model [108] and even to study the STP activity in immature rat brains compared with adult rats [109] are examples of different research works supported by HPLC assays.Likewise,research work focused on the assessment of drug interactions of RTG and STP with other possible co-prescribed AEDs using isobolographic analysis [110,111,113,121] is other examples of studies in which HPLC was used as supportive analytical methodology. In addition, LC was also applied to characterize the pharmacokinetics of PER and its brain uptake in a rat species [72]and to study RFM,PER and STP serum concentration dependence in function of the administration route, age, dose, food and comedication [43,46,96,116,122]. Although several pieces of works have been developed and validated for the determination of STP,RTG,RFM and PER,to the best of our knowledge,up to date,there is only one method using HPLC coupled with tandem mass spectrometry (MS/MS) able to simultaneous determine STP, RTG, Nacetyl-retigabine and RFM,together with seventeen other AEDs in the same chromatographic run, being PER not included in this group. This HPLC assay was developed and validated for routine forensic toxicological analysis, and it was demonstrated to be sensitive, selective and accurately applied to postmortem blood,plasma and serum samples [115]. In all studies here reviewed,different HPLC assays were used, confirming the value and versatility of this analytical methodology to respond to specific needs in different scientific fields.
Throughout drug development programs, a variety of LC methods are also applied in order to guarantee the quality control of pharmaceutical forms, conduct accelerated stability studies and evaluate the presence of impurities. In fact, the study of RTG impurities in bulk drug using HPLC analysis was found to have a relevant role,proving that the impurities found were generated in the last step of RTG synthesis and could be found in different commercial batches [68-70,74,98,120].
Thus, in the next section of this review, the main purpose is to focus on the critical chromatographic variables, in particular the chromatographic columns and respective mobile phases, and also the detection systems that are of the utmost importance for the development and application of LC methods intended for STP,RTG,N-acetyl-retigabine, RFM and PER quantification.
5.1. Chromatographic columns and mobile phases
During the development of new HPLC methods, steps like column (stationary phase) selection and optimization of the mobile phase composition, pH and flow-rate are critical. The choice of these parameters is mostly based on the desirable peak characteristics (height/area, tailing, shape, symmetry, separation, theoretical plates),run time and solvent consumption [123].
Considering the information summarized in Table 5, the majority of methods reported in literature for STP, RTG, N-acetylretigabine, RFM and PER determination applied to bulk or pharmaceutical formulations are usually simpler and faster than those applied to biological samples. Additionally, for bulk and pharmaceutical formulations,complex sample preparation procedures and highly sensitive detection methods are not justifiable since the analytes’ concentrations are expected to be higher than those expected in biological matrices. Besides, it is not probable to find significant amounts of endogenous interferences that could influence analytes quantification. Methods that quantify the herein studied analytes in bulk and pharmaceutical formulations using HPLC or UHPLC were mostly applied for RTG[68-70,74,98,120]and RFM [84,87,93-95,119], but also, in a smaller proportion, for STP[41,73] (Table 5). In four of the six studies that quantified RTG in bulk and/or pharmaceutical formulations, gradient elution programs were used to pump different mobile phases through the chromatographic system. Acetonitrile was the organic modifier used in all those methods, only modifying the aqueous phase composition(potassium hydrogen phosphate buffer,triethylamine buffer and trifluoroacetic acid in water) pumped through the C18silica columns. All the other HPLC or UHPLC methods for the determination of RTG, RFM and STP in bulk and pharmaceutical formulations resorted to isocratic elution, with chromatographic separations also achieved on reversed-phase C18bonded to silica columns,with particles size lower in the UHPLC methods compared to the conventional HPLC ones. The only case where a C18column was not used was the Saleh et al. [73] study, in which a chiral stationary phase based on polysaccharides, linked to a silica matrix,was employed to obtain the best conditions for STP enantiomers separation. In the isocratic programs applied to bulk and pharmaceutical formulations, acetonitrile was also the organic phase modifier mostly used, followed by methanol. In fact, when compared with methanol, acetonitrile presents some advantages,
in particular, its lower viscosity that reduces the back pressure in the analytical system, its higher elution strength and its lower ultraviolet (UV) absorptivity [123]. However, in a study that aimed the separation of RFM from its three impurities, the use of methanol in the mobile phase allowed a better compound separation and an improved chromatographic resolution compared with the use of acetonitrile [87]. Regarding the aqueous phase composition used in the aforementioned methods, it varied between ammonium sulfate, potassium or sodium phosphate buffers, with pH values ranging from 2.5[69]to 8.0[74].Additionally,triethylamine was added to some aqueous phases aiming to reduce the peak tailing effect[69,74].In other studies,the aqueous phase consisted solely of water, obtaining, in such cases, a good resolution of the analytes in a wide range of linearity [73,74,84,95].
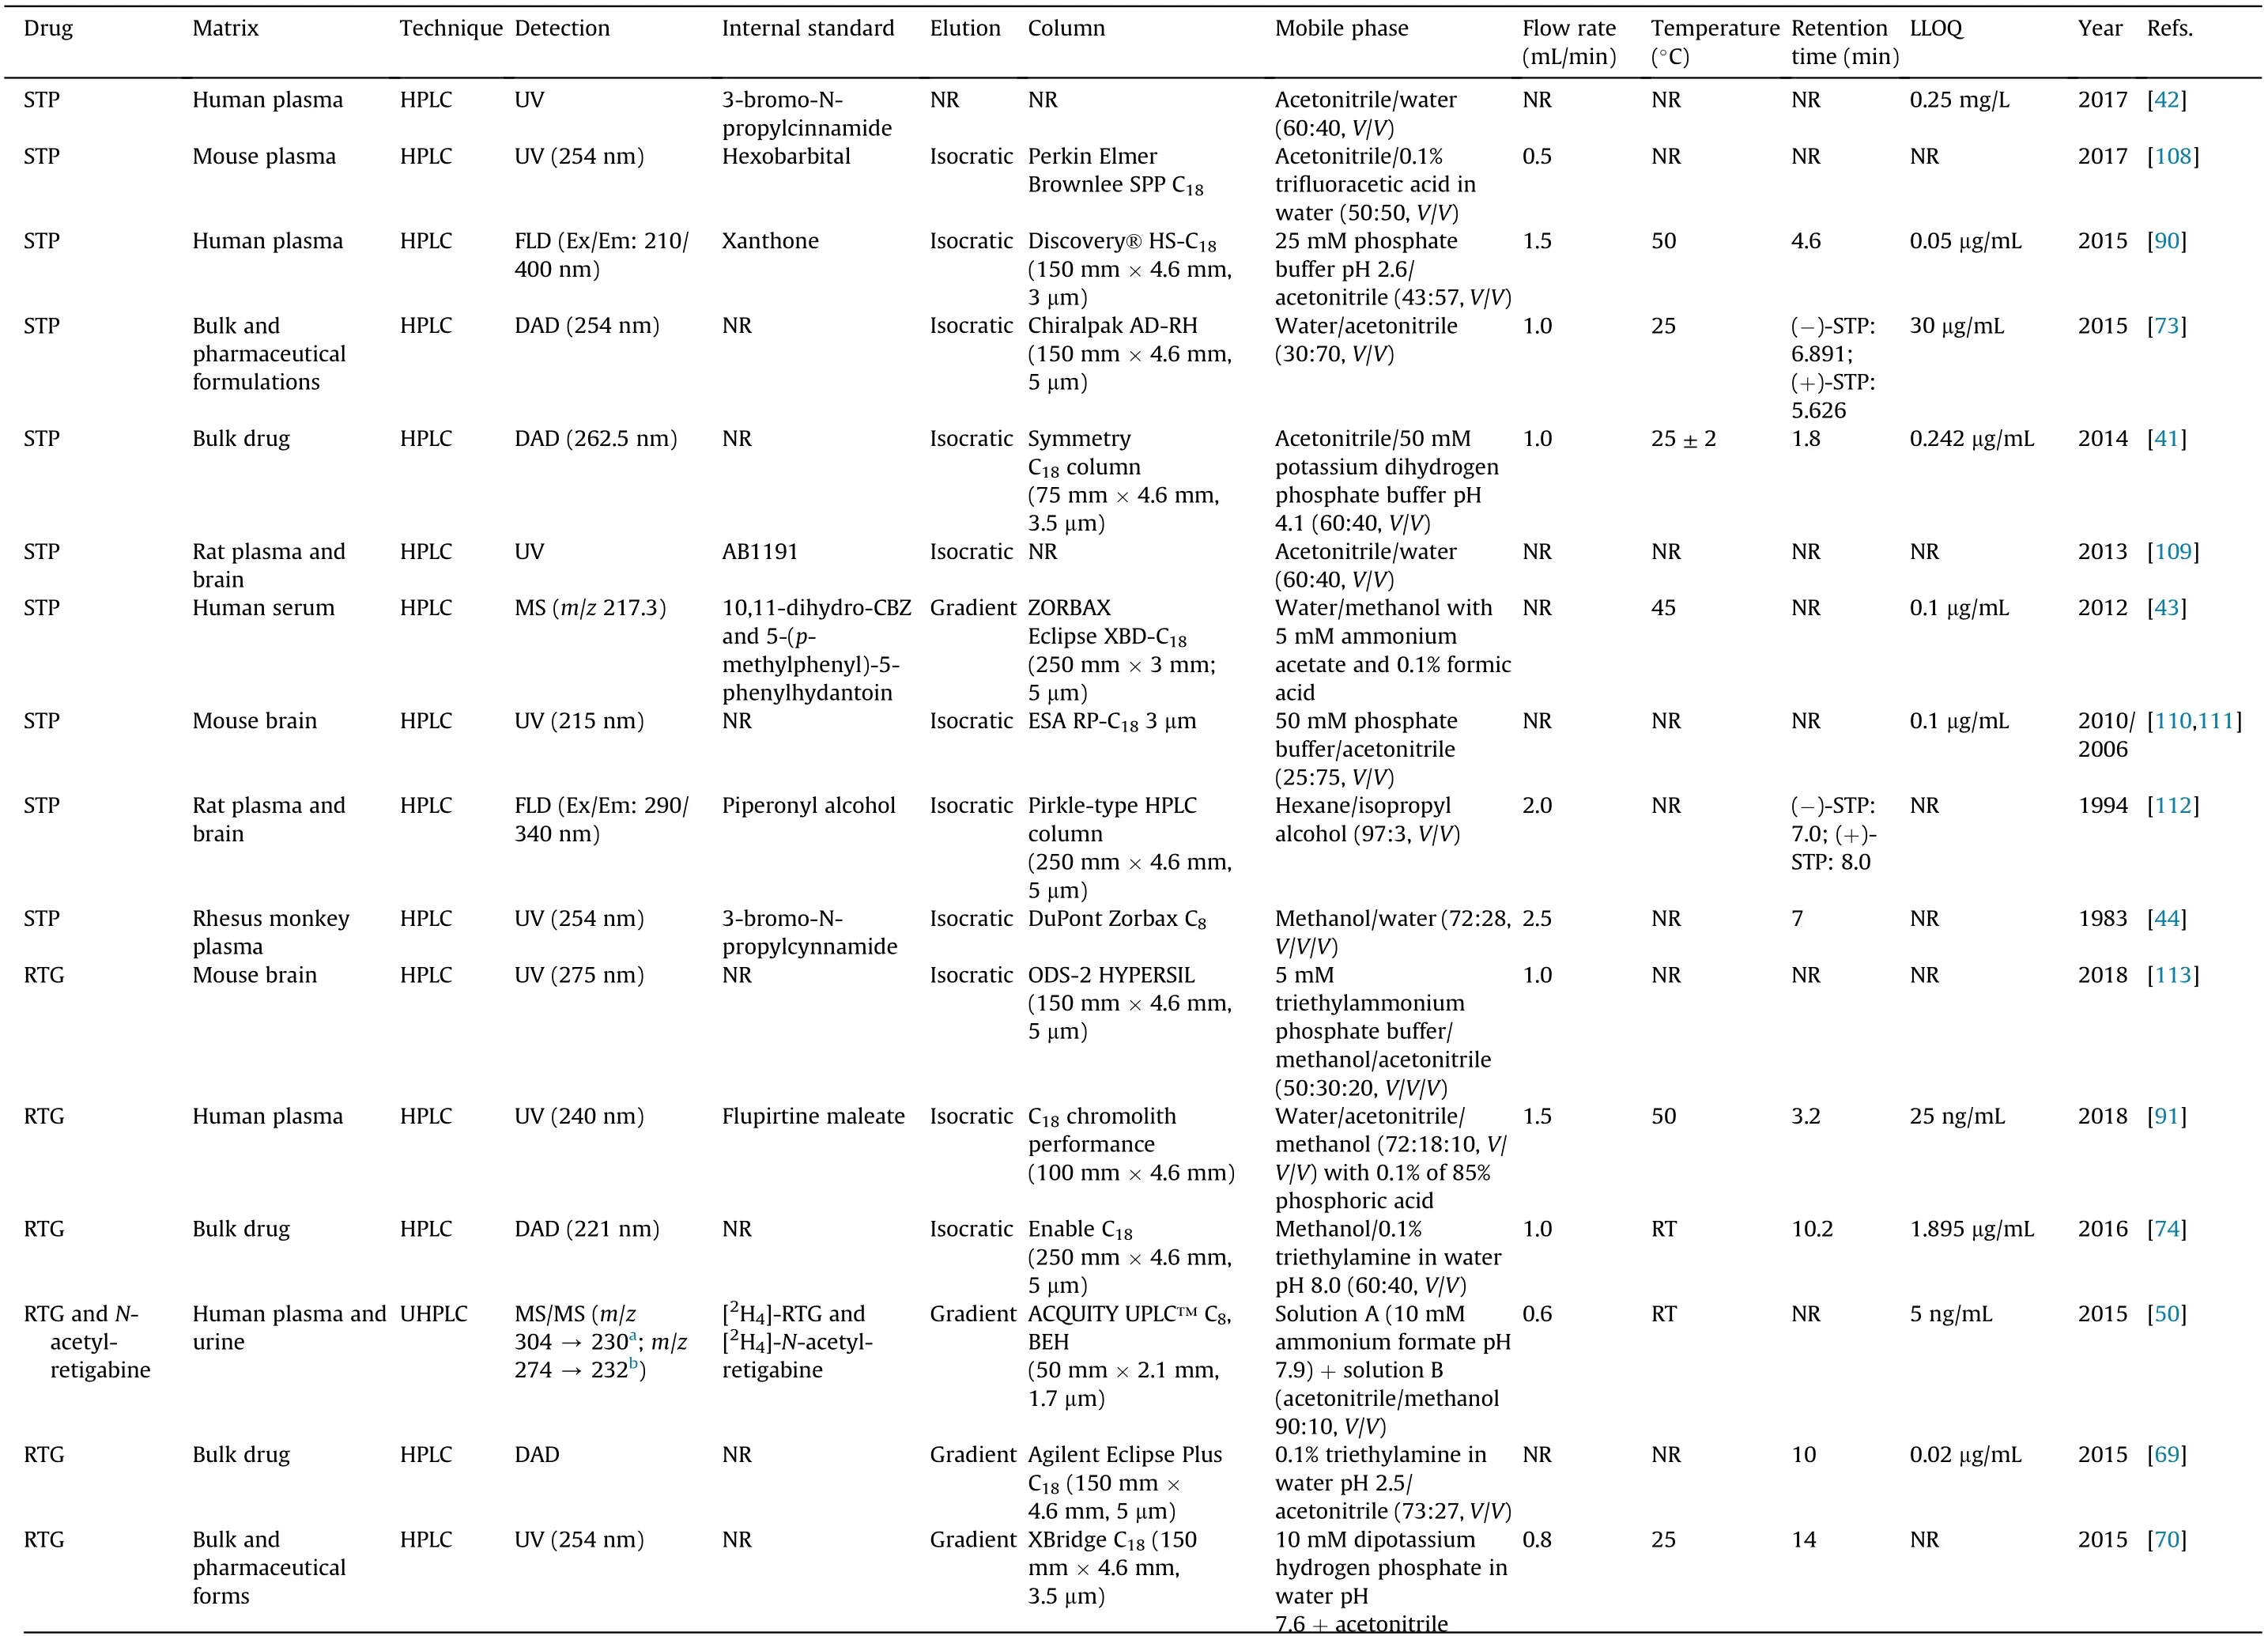
Table 5 Liquid chromatography techniques and analytical conditions for the determination of stiripentol(STP),retigabine(RTG)and its active metabolite N-acetyl retigabine,rufinamide(RFM)and perampanel(PER)in different matrices.
(continued on next page)
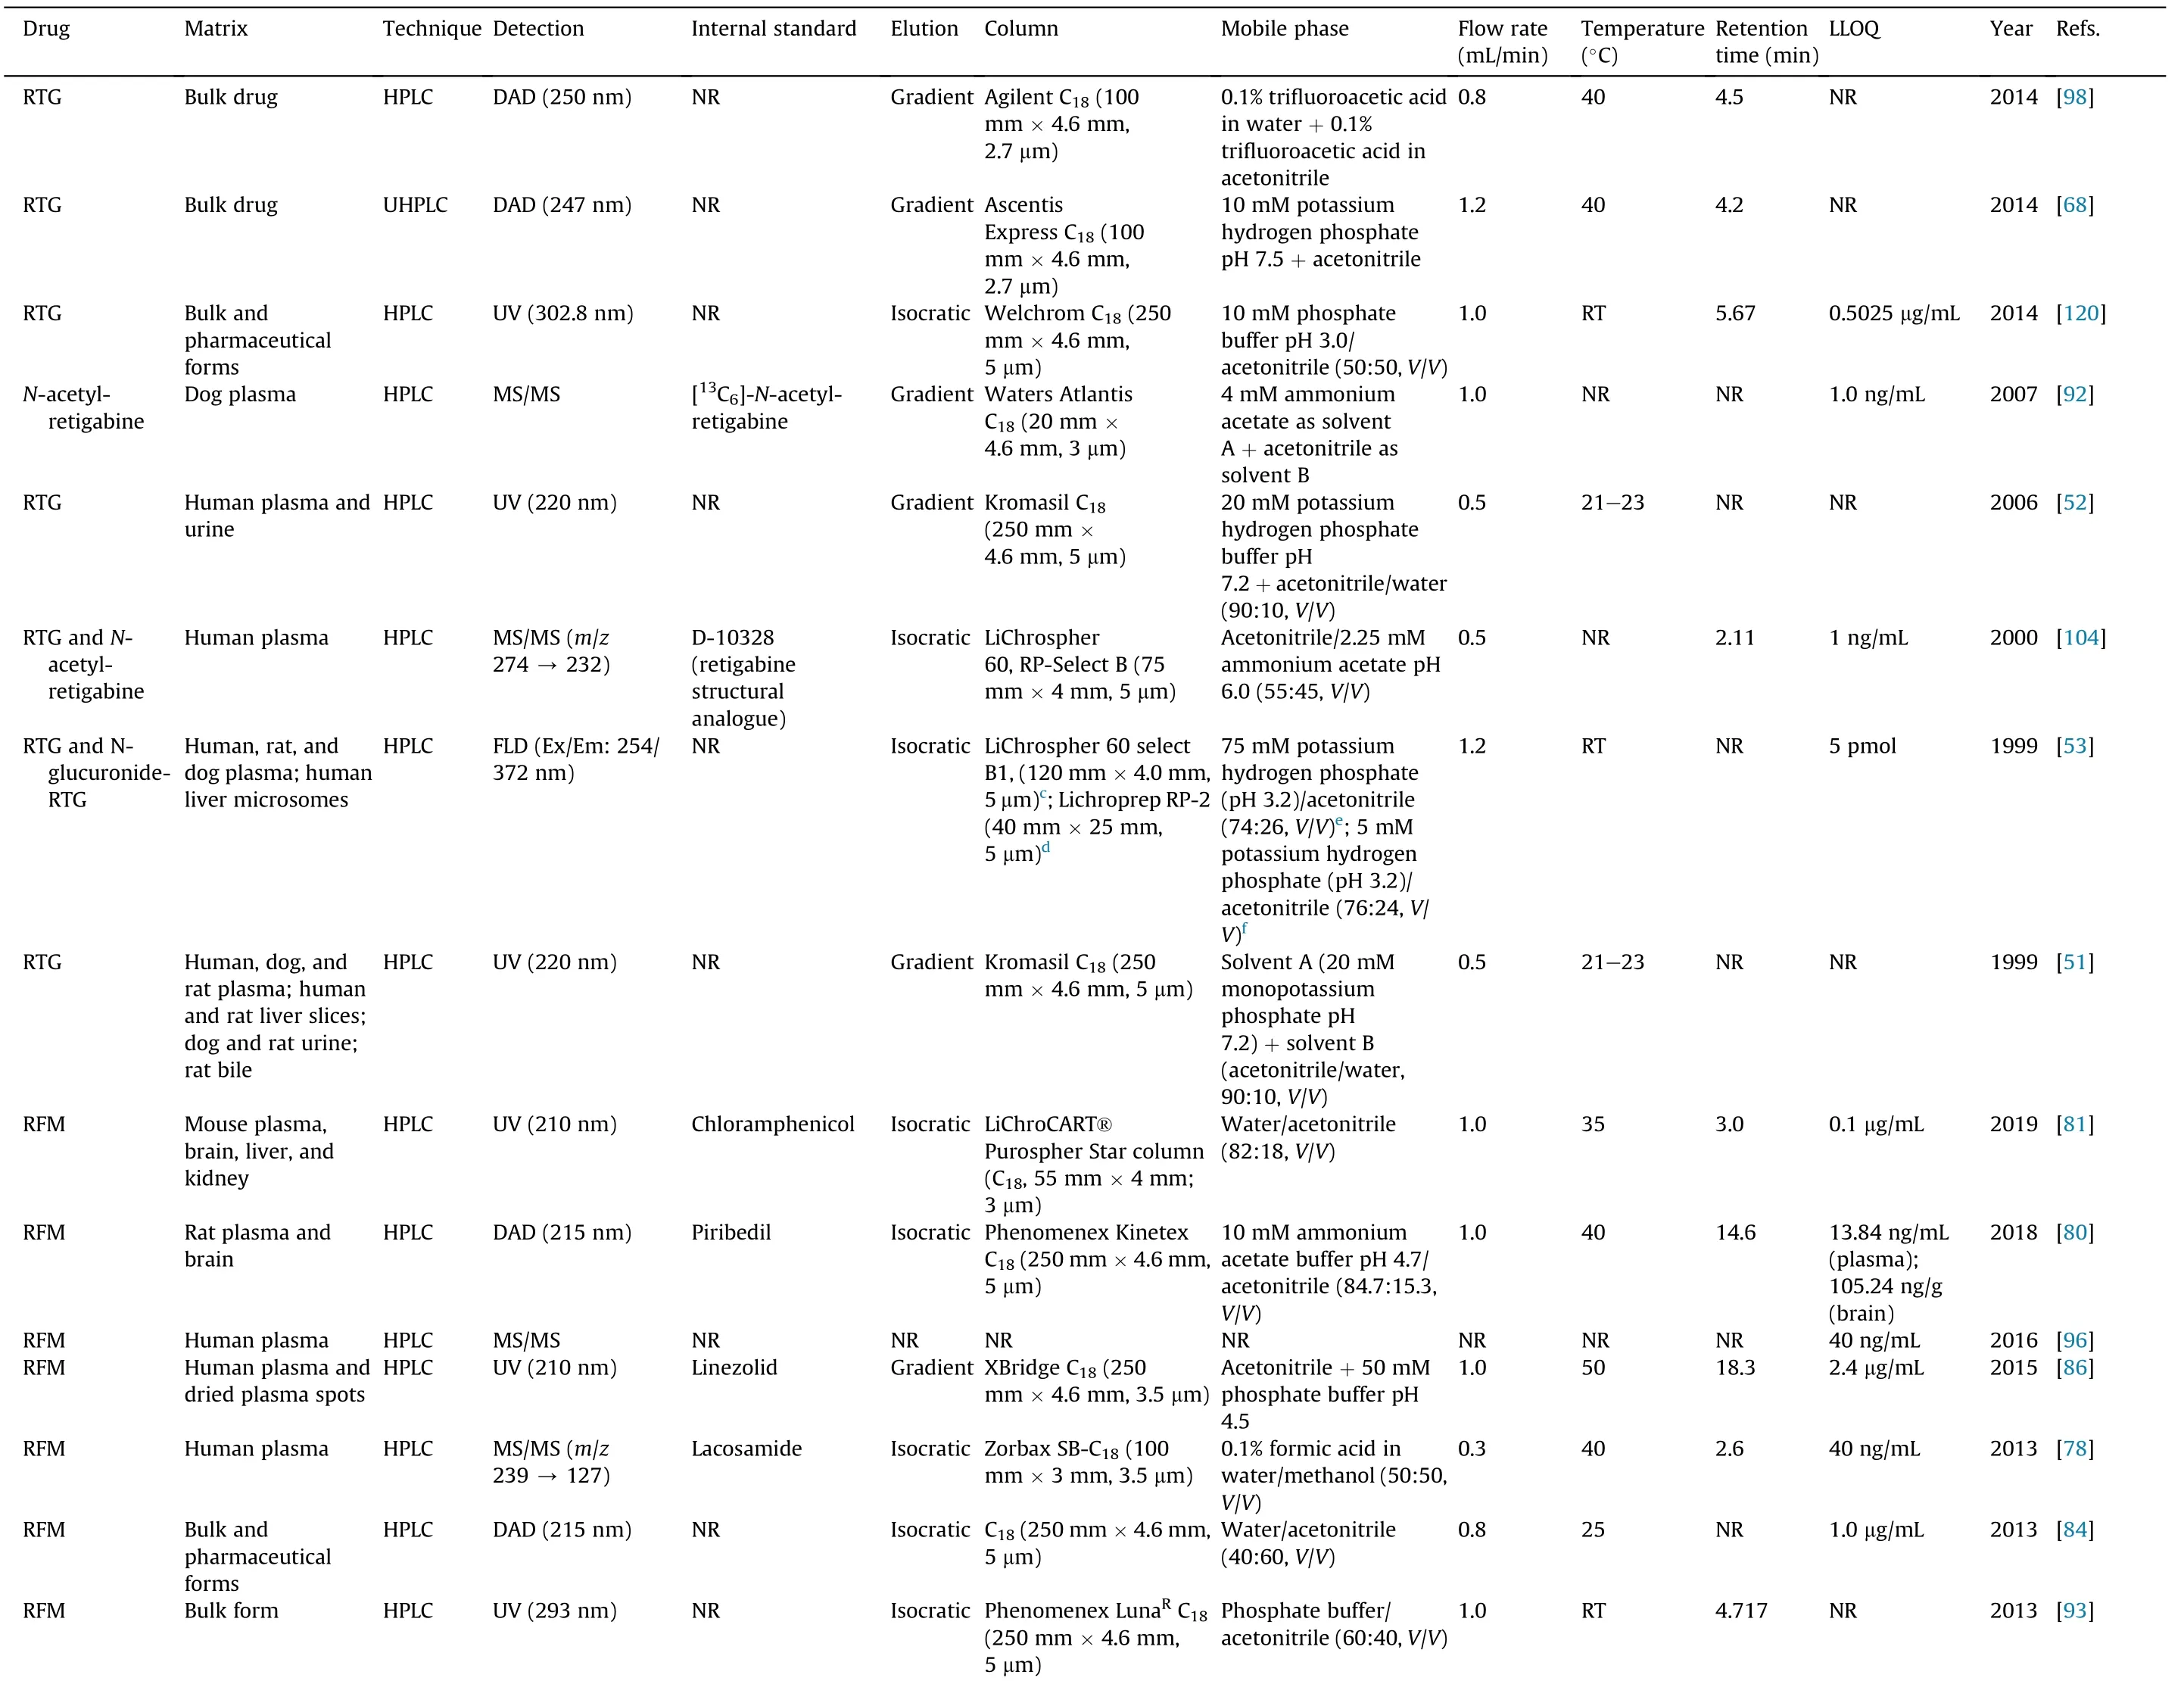
Table 5 (continued)
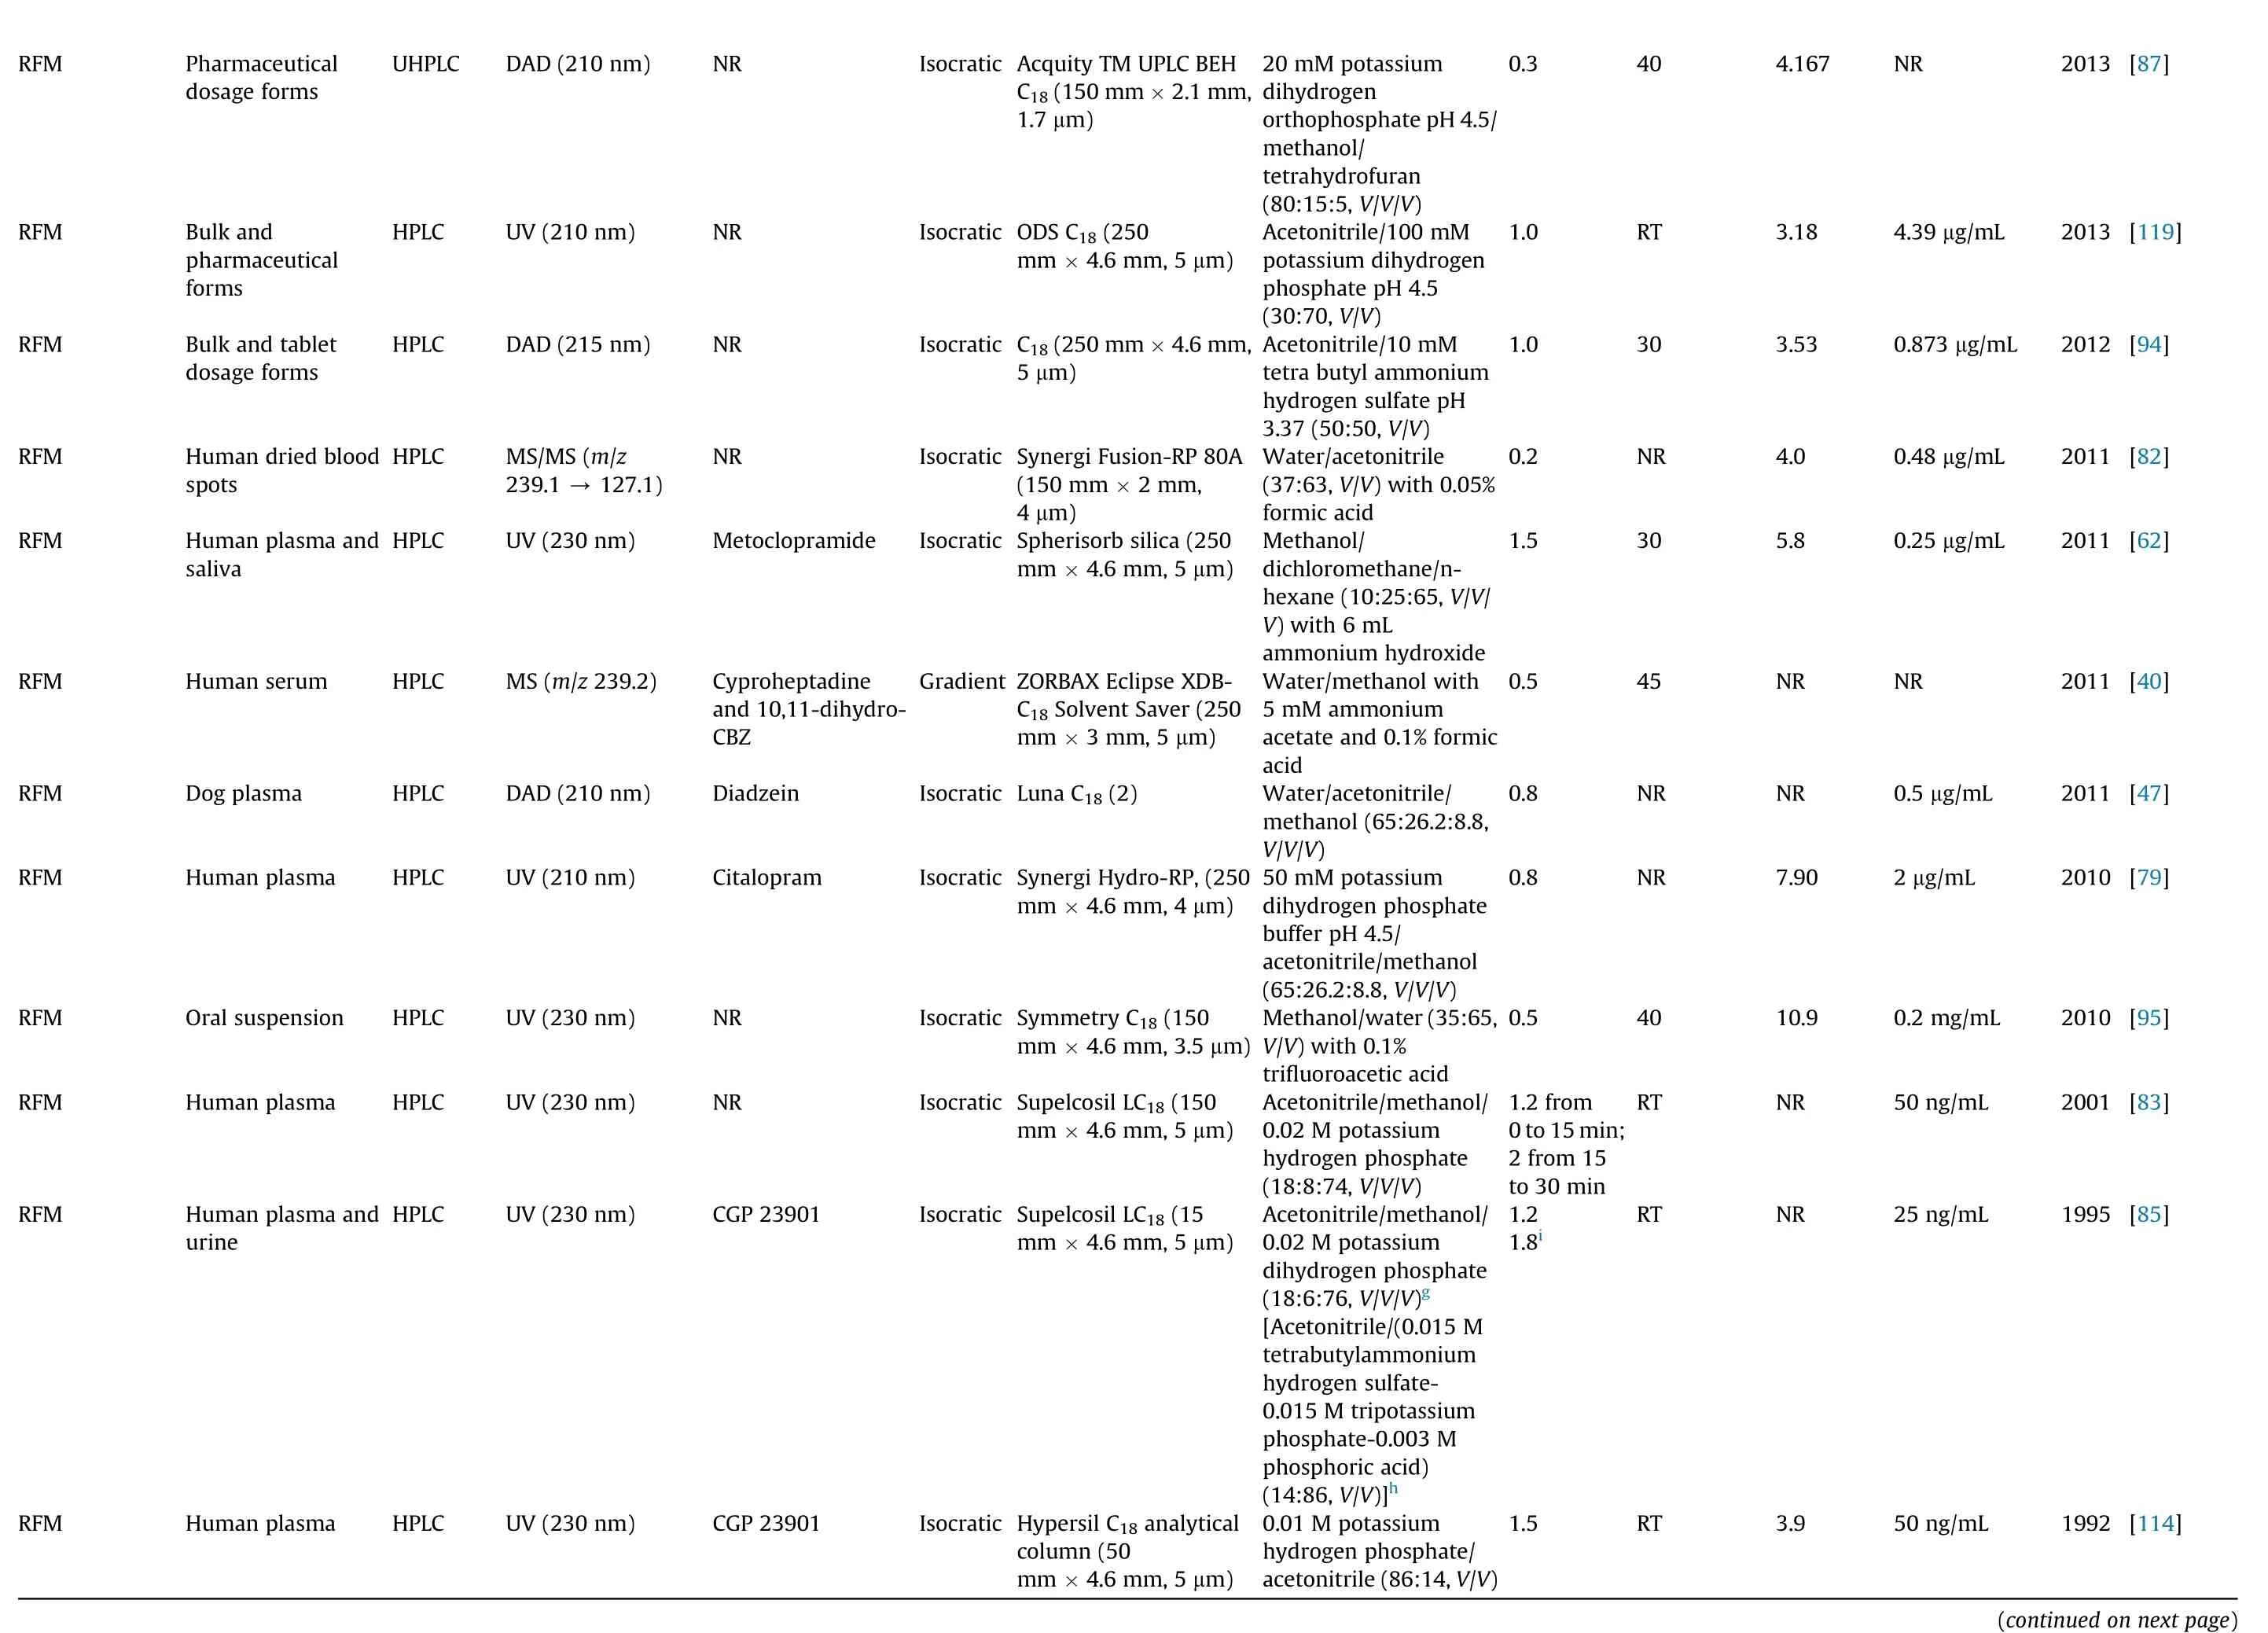
2013[87]NR 2013[119]4.39μg/mL 2012[94]0.873 μg/mL 2011[82]0.48μg/mL 2011[62]0.25μg/mL 2011[40]NR 2011[47]0.5 μg/mL 2010[79]2 μg/mL 2010[95]0.2 mg/mL 2001[83]50ng/mL 1995[85]25ng/mL 1992[114]50ng/mL(continuedon next page)4.167 3.18 3.53 4.0 5.8 NR NR 7.90 10.9 NR NR 3.9 40 RT 30 NR 30 45 NR NR 40 RT RT RT 0.3 1.0 1.0 0.2 1.5 0.5 0.8 0.8 0.5 1.2 from 0 to15 min;2 from 15 to30 min 1.2 1.8i 1.5 20mM potassium dihydrogen orthophosphatepH 4.5/methanol/tetrahydrofuran(80:15:5, V/V/V)Acetonitrile/100mM potassium dihydrogen phosphate pH 4.5(30:70, V/V)Acetonitrile/10 mM tetra butylammonium hydrogensulfatepH 3.37(50:50, V/V)Water/acetonitrile(37:63, V/V) with 0.05%formicacid Methanol/dichloromethane/nhexane(10:25:65, V/V/V)with 6mL ammoniumhydroxide Water/methanolwith 5 mM ammonium acetate and0.1% formic acid Water/acetonitrile/methanol(65:26.2:8.8,V/V/V)50mM potassium dihydrogenphosphate bufferpH 4.5/acetonitrile/methanol(65:26.2:8.8, V/V/V)Methanol/water(35:65,V/V)with 0.1%trifluoroaceticacid Acetonitrile/methanol/0.02Mpotassium hydrogenphosphate(18:8:74, V/V/V)Acetonitrile/methanol/0.02Mpotassium dihydrogenphosphate(18:6:76, V/V/V)g[Acetonitrile/(0.015M tetrabutylammonium hydrogensulfate-0.015 Mtripotassium phosphate-0.003 M phosphoricacid)(14:86, V/V)]h 0.01Mpotassium hydrogenphosphate/acetonitrile(86:14,V/V)Isocratic AcquityTM UPLC BEH×2.1mm,×4.6mm,C18(150 mm 1.7 μm)Isocratic ODSC18(250 mm×4.6mm, 5μm)Isocratic C18(250mm 5 μm)Isocratic SynergiFusion-RP80A(150mm ×2mm,4 μm)Isocratic Spherisorb silica (250 mm×4.6mm, 5μm)GradientZORBAX EclipseXDBC18SolventSaver(250 mm×3mm, 5μm)Isocratic Luna C18(2)Isocratic SynergiHydro-RP, (250 mm×4.6mm, 4μm)Isocratic Symmetry C18(150 mm×4.6mm, 3.5μm)Isocratic Supelcosil LC18(150 mm×4.6mm, 5μm)Isocratic Supelcosil LC18 (15 mm×4.6mm, 5μm)Isocratic Hypersil C18analytical column(50 mm×4.6mm, 5μm)NR DAD (210 nm)UHPLC Pharmaceutical dosageforms RFM NR UV(210 nm)HPLC Bulkand pharmaceutical forms RFM NR DAD (215 nm)HPLC Bulkandtablet dosageforms RFM NR MS/MS (m/z 127.1)239.1 →HPLC Human driedblood spots RFM Metoclopramide UV(230 nm)HPLC Human plasma and saliva RFM Cyproheptadine and 10,11-dihydro-CBZ MS(m/z 239.2)HPLC Human serum RFM Diadzein DAD (210 nm)HPLC Dog plasma RFM Citalopram UV(210 nm)HPLC Human plasma RFM NR UV(230 nm)HPLC Oralsuspension RFM NR UV(230 nm)HPLC Human plasma RFM CGP 23901 UV(230 nm)HPLC Human plasma and urine RFM CGP 23901 UV(230 nm)HPLC Human plasma RFM
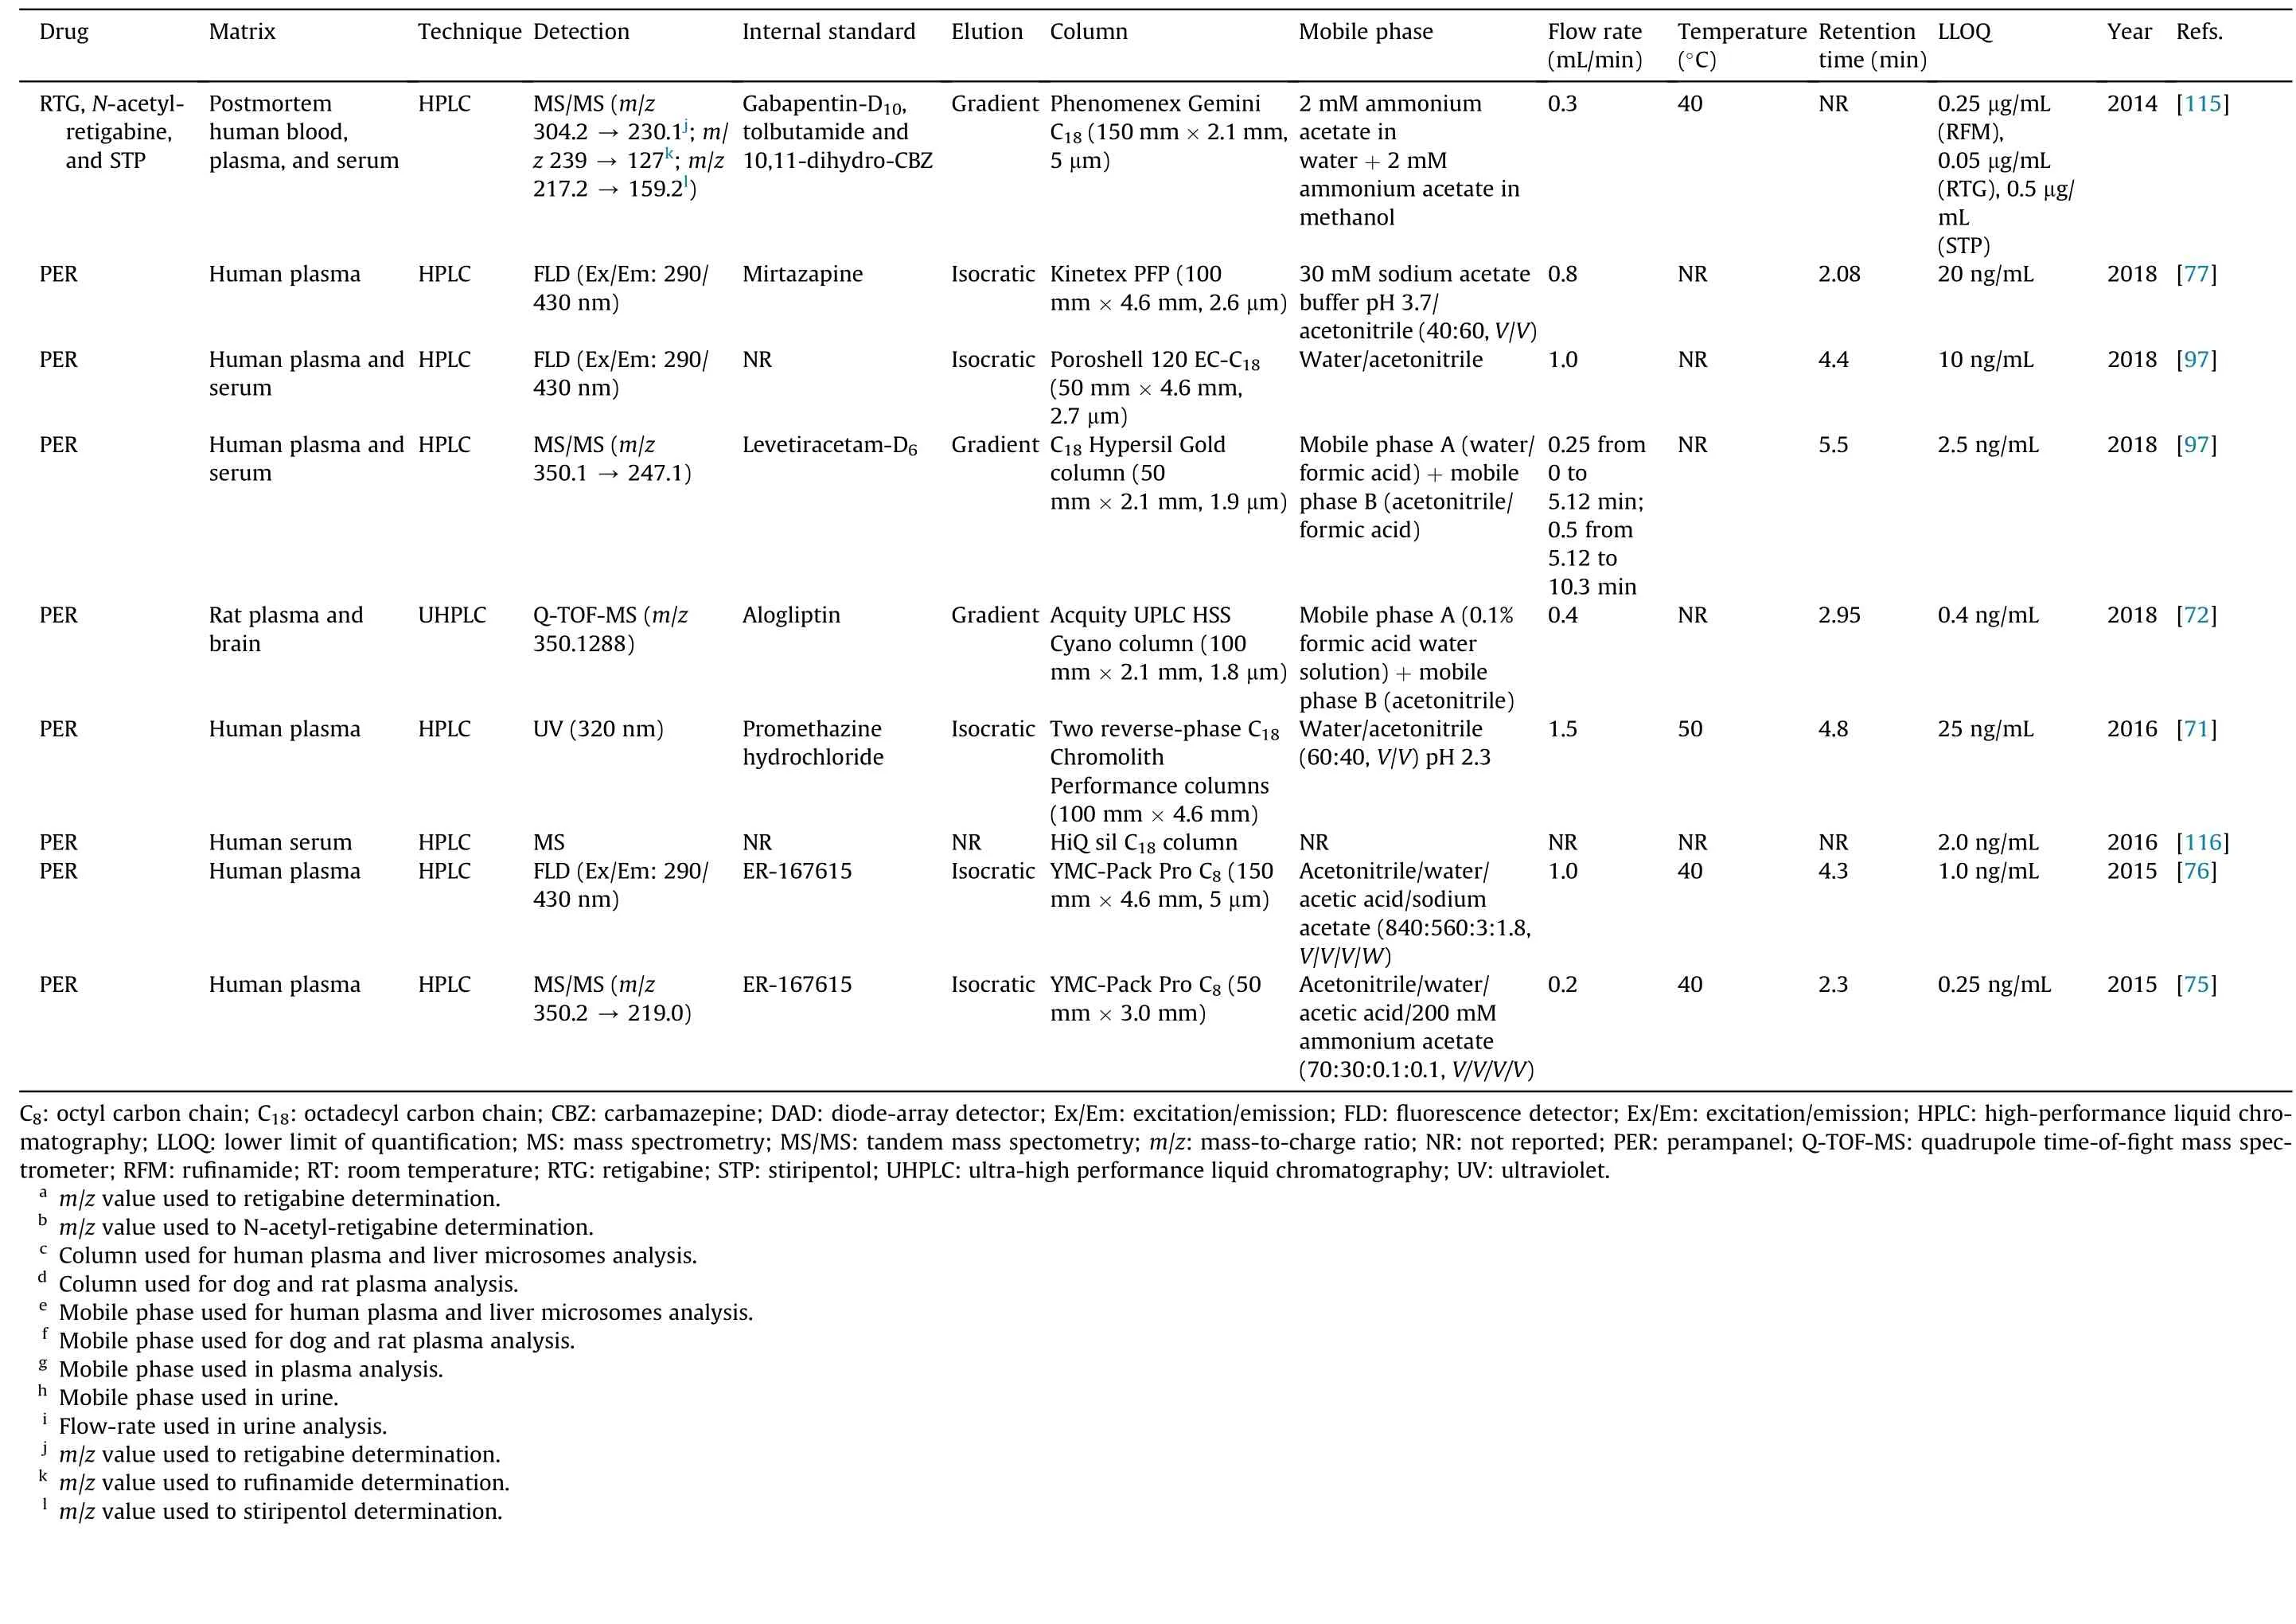
Table 5 (continued)
Concerning the methods applied to biological samples analysis,and bearing in mind their increased complexity when compared with bulk and pharmaceutical formulations,buffers as aqueous phase are usually required to obtain selectivity,accuracy,precision,and sensitivity in shorter run time.The use of an isocratic or a gradient elution program is also avariable of concern during the development of HPLC methods applied to biological samples. According to Table 5, the majority of the HPLC or UHPLC assays developed to determine STP,RTG, RFM and PER in biological matrices applied isocratic elution procedures. In fact, those that applied gradient elution programs either aimed the simultaneous determination of different AEDs in a short run-time [86,97,115,124] or were focused on pharmacokinetic studies involving STP, RTG, N-acetyl-retigabine, RFM and PER[43,46,50-52,72,92].Regarding the type of stationary phase used for biological matrices analysis, Table 5 clearly shows that the chromatographic separation of STP, RTG, RFM and PER has mostly been achieved using porous silica C18reversed-phase columns[43,46,47,51,52,71,78-83,85,86,90-92,97,108,110,114-116]. However,due to the short retention time of both PER and IS in Franco et al.[71] method, two reversed-phase C18chromolith performance columns were used to separate IS from PER during the analysis of human plasma samples. Particularly, those new chromatographic columns contain a monolith sorbent instead of packed porous particles,creating a uniform surface area that allows a decrease of the chromatographic system back pressure, even with high flow-rates.Furthermore, it enables to increase sensitivity, improve peaks resolution and obtain shorter analytical time[99].
The use of guard-columns is also highly noticeable in many chromatographic methods. The aim is mostly to increase column lifetime by protecting them from quick deactivation and destruction,a situation that is more frequent when dealing with biological samples.Thus,the use of a guard-column is a cost-effective option since the value of a chromatographic column is pronounceably higher than that of the guard-column itself [123]. In fact, the robustness of HPLC methods is frequently compromised by the column aging, usually accompanied by an increase of column pressure and an increase of peak tailing, leading to oscillations in analytes retention time. Therefore, column aging must be monitored and the column must be changed particularly when analytes signals decrease, a situation that is easily observed when low analytes' concentrations are being measured [75].
Although reversed-phase HPLC columns are the most commonly used in LC analysis,among the reviewed methods, two works applied normal phase HPLC columns: one aimed the determination of RFM in human plasma and saliva [62] and the other aimed the characterization of the pharmacokinetics of STP enantiomers in rat plasma and brain [112] (Table 5). This type of HPLC separation is usually appropriate to more polar compounds that are able to be strongly retained in a polar (hydrophilic) stationary phase flushed with non-polar mobile phases. Actually, in both studies, mobile phases containing high percentages of strong apolar solvents (e.g., hexane and dichloromethane) and specific chromatographic columns with polar silica coatings were used[62,112].Particularly,Arends et al. [112]used a specific Pirkle-type chromatographic column (4.6 mm × 250 mm, 5 μm; ®-DNB PG(covalent)) that allowed the resolution of enantiomers in a chiral normal phase HPLC method, obtaining acceptable retention times for (-)-STP (7 min) and (+)-STP (8 min) and fulfilling the pharmacokinetic study purpose. Nevertheless, separation with normal phase columns is becoming less used, in that the use of mobile phases containing high percentages of dangerous and polluting organic solvents is one of the main reasons for its discontinuation.Actually, reversed-phase HPLC methods generally use lower percentages of organic solvents in the mobile phase composition, in that the aqueous phase usually composed by water or by an aqueous buffer (Table 5). In fact, for the analysis of biological samples, besides water or water with an acidic modifier or triethylamine, potassium or sodium phosphate buffers are the most used aqueous composition of the mobile phases, their pH values being between 2.5 and 9.9. Still, regarding chromatographic apparatus lifetime and time-consuming procedures, whenever it is possible,the use of water is more desirable than that of buffers.In fact, the studies by both Meirinho et al. [81] and Franco et al. [71]clearly support that statement by testing different buffers and water as aqueous components of mobile phases. Since any of the buffers improved neither resolution nor peak shapes, water solely was finally used as aqueous phase, making mobile phase preparation much simpler. For the analysis of RFM in different biological matrices, most studies used a higher percentage of aqueous than organic solvent in the mobile phase, contrary to what occurs with STP, RTG, N-acetyl-retigabine and PER. This difference can be justified by the fact that STP, RTG and PER present a much more hydrophobic character than RFM, as clearly demonstrated by the log P and log D values of each drug stated in Table 2.
Mano et al. [76] made an inter-laboratory cross validation of a method developed for PER quantification in human plasma. This study was carried out in two different laboratories and it was necessary to modify some components of the method, such as column type(C8to C18)and mobile phase composition(decrease in acetonitrile percentage).That resulted in a marked increase of PER retention time (4.3-11.7 min), which shows the impact of chromatographic conditions in the obtained results.In next section,we will discuss the selection of the analytical detection systems,another key aspect to consider in the development of LC methods.
5.2. Detection systems
Different types of detection systems have been used in quantitative HPLC methods, the most commonly being used the UV/diode-array detectors (DAD), the fluorescence detectors and several MS methodologies. UV detectors are the less expensive detection systems but present poor selectivity as a disadvantage.For that,more laborious extraction procedures are required in order to eliminate the interfering endogenous substances that also absorb in the same wavelength range of the target analyte.In those cases and in situations where more than one analyte with different absorption characteristics needs to be quantified,the use of a DAD is of great value by allowing the simultaneous detection of several compounds at different wavelengths in the same chromatographic run [123]. Several studies used this versatile detection system in the analysis of pharmaceutical formulations and biological samples(Table 5).By examining the information summarized in Table 5,it is clear that RFM absorbs UV light at very distinct wavelength ranges than STP and RTG, contrasting with the similarities between UV absorbance of both RTG and STP. This characteristic corroborates the existing similarity in the physicochemical properties of RTG and STP,in contrast with the ones of RFM.For PER,only one study used UV detection for its quantification in human plasma[71].However,in this study,the lower limit of quantification(LLOQ)achieved was much higher than those in other methods that used MS or fluorescence detection(Table 5),demonstrating the lower sensitivity of UV detectors than that of the others used. In fact, since PER have native fluorescence,this detection type has been widely used for its quantification in biological matrices [76,77,97]. Fluorescence detection was also used to quantify RTG in human plasma[53]and STP in human and rat plasma and brain [90,112]. Once again,fluorescence detection proved to be highly selective and sensitive since,for the analysis of STP from the same type of biological matrix(i.e.,human plasma),the LLOQ obtained by Takahashi et al.[90]was half of the value achieved with an MS detector[43] and five times lower than the LLOQ reached using a UV detector [42]. To apply fluorescence detectors,a specific excitation wavelength must be set to allow the passage of the analyte to a more energetic state that will further enable the isolation of the desired emission wavelength. Then, that emission wavelength will be directed to a photodetector where it is monitored and converted in an electric signal for data processing [123]. The pairs of excitation and emission wavelengths chosen for PER were 290/430 nm [76,77,97], for RTG were 254/372 nm [53] while for STP were 290/340 nm [112]and 210/400 nm [90] (Table 5).
In more recent years, MS and MS/MS detection systems have been becoming widely used in the analysis of pharmaceutical compounds in biological matrices. Between both detectors, MS is simpler than MS/MS since it only measures a single ionic species of each analyte when a specific mass-to-charge ratio (m/z) value is applied. In contrast, MS/MS isolates the primary ionic species in order to be fragmented into additional ions and then monitors one or more of these product ions [103,123]. Both systems offer a good selectivity and sensitivity, with MS/MS presenting an additional selectivity generated by the specific analytes’signatures as a result of the precursor to product ions transition [103,123]. Another type of detector that is also based in MS is the mass quadrupole time-offight coupled with electrospray ionization (ESI), affording high selectivity,sensitivity and accuracy.This more recent and expensive detector enabled to study PER pharmacokinetics and for the first time its brain disposition [72]. In general, these mass detection systems have been widely applied to support pharmacokinetic studies, allowing the use of sufficient low LLOQ values required for the accurate estimation of elimination pharmacokinetic parameters.According to Table 5, several LC methods using MS or MS/MS detectors have been developed to support pharmacokinetic and pharmacodynamic studies involving STP, RTG and N-acetyl-retigabine, RFM and PER [43,46,50,72,92,96,104,116]. Moreover, studies that determine RFM in low sample volumes[78]and in dried blood spots[82],studies that compared fluorescence detection with MS for PER quantification[76,97],and studies that aimed to analyze a high number of AEDs in the same chromatographic run [115] also used these detection systems. Positive-ion detection, which shows protonated molecules, was mostly used for STP, RTG, RFM and PER determination.With that purpose,different ionization sources were applied:negative ESI[78,115],atmospheric pressure ionization(API)[43,46,50,75,82,96], positive-ion atmospheric pressure chemical ionization(APCI)[92,104],and heated electrospray source ionization(HESI) operating in positive-ion mode [97]. When compared with ESI, APCI methods are more powerful in the quantification of moderately polar, or non-polar, low-molecular mass compounds.They also decrease the ionization suppression of analytes caused by endogenous sample interferences,enabling a better sensitivity[104].
When MS or MS/MS detectors used, stable labeled isotopes are frequently used as IS, thus improving accuracy and precision;moreover, their chemical behaviors and ionization properties are very similar to those of the unlabeled analyte.Resorting to positive ionization in the multiple reaction monitoring transitions, Perez et al.[50]used[2H4]-RTG as IS to quantify RTG,and[2H4]-N-acetylretigabine to measure the N-acetylated RTG metabolite. Furthermore, a levetiracetam-d6 isotope was used for PER quantification,in which the HESI was applied[97].So,even though MS and MS/MS detection systems are more expensive than UV or fluorescence detectors, their higher sensitivity is undeniable, thus showing a particular interest in pharmacokinetic studies.This is clearly stated in Mano et al. studies [75,76] that initially developed an MS/MS method, which is a technology not routinely available in many clinical and research laboratories [75]. Accordingly, in order to make PER quantification easier and less expensive, they further developed an HPLC method coupled to fluorescence detection[76].However,as expected,the LLOQ value of PER with MS/MS detection was lower (0.25 ng/mL)than the corresponding value obtained by fluorescence detection (1 ng/mL); nevertheless, both achieved LLOQs are both consistent with the therapeutic range of PER(Table 1).
6. Conclusion
This review gathered important data related to LC methods developed,validated and applied for determination of STP,RTG,Nacetyl-retigabine, RFM and PER in different matrices. These analytical tools were developed not only to be applied in quality control studies of pharmaceutical formulations but, mostly, to support pharmacodynamic and pharmacokinetic studies intended to investigate drug interactions,toxicity and therapeutic efficacy of STP,RTG,RFM and PER.This range of applications was only possible because HPLC techniques present several advantages, compared with other analytical methodologies,such as good sensitivity,high resolution, versatility, shorter analysis time per sample, and automation capability. However, in this review, our main focus was on the critical steps that need to be considered during the development of a LC method to achieve the suitable selectivity,sensitivity,accuracy and precision, even when working with very low sample quantities and analytes concentrations. Sample preparation methods, chromatographic columns, mobile phases, and detectors selection are particularly important to successfully achieve all those points. In the methodologies herein reviewed, PP is the predominant technique used to prepare samples containing STP, RTG, Nacetyl-retigabine,RFM or PER.Nevertheless,extraction procedures using miniaturized techniques are yet not widely applied for samples containing these drugs. However, depending on the sample aimed to be analyzed,less labor-consuming methods as dilution and centrifugation can be applied in simpler samples but, if the complexity of the matrix increases, it may be necessary to apply more complex sample preparation procedures(e.g., SPE).
Regarding the physicochemical properties of the analytes here addressed, and particularly considering their polarity and hydrophobicity,the majority of reported HPLC methods used a reversedphase separation, with silica-based C18columns as stationary phase.However,comparing the mobile phases used for RFM and for STP, RTG, N-acetyl-retigabine and PER, it is clear that, in order to improve RFM detection and separation, a higher percentage of aqueous components is required. This is especially important for new method development, since it is related to the higher hydrophilic character of RFM compared with STP, RTG, N-acetyl-retigabine and PER.
MS and MS/MS detection are regarded as the current focus of interest by their clear advantages in terms of selectivity and sensitivity.However,one of their major limitations is the high costs involved. Therefore, UV and fluorescence detection systems continue to be useful approaches for STP,RTG,N-acetyl-retigabine,RFM and PER determination.As STP,RTG and its active metabolite,and PER present native fluorescence, fluorescence detection must be primarily considered in the development of new LC methods for their determination.
Thus,the development of new and more cost-effective methods for research purposes and clinical application is a continuous challenge.Therefore,more work needs to be performed in order to quantify new generation of AEDs such as STP, RTG and its active metabolite N-acetyl-retigabine,RFM and PER in an easier and faster manner. The use of different types of samples, such as saliva and urine, as well as the use of simpler and less time-consuming extraction procedures can be a starting point to expand the knowledge on these new AEDs and make available novel and improved bioanalytical tools for application in TDM.
Declaration of competing interest
The authors declare that there are no conflicts of interest.
Acknowledgments
This work was supported by Banco Santander/Totta (Portugal)through the fellowship BID/ICI-FCS/CICS/Santander Universidades-UBI/2017,by Foundation for Science and Technology(FCT)through the fellowship SFRH/BD/136028/2018 and by FEDER funds through the POCI-COMPETE 2020-Operational Program Competitiveness and Internationalization in Axis I (Project No. POCI-01-0145-FEDER-007491) and National Funds by FCT (Project No. UIDB/00709/2020; and Project No. UIDP/00709/2020). The authors also would like to thank the support provided by FEDER funds through the “Programa Operacional do Centro” (Project No. CENTRO-01-0145-FEDER-000013).Appendix A. Supplementary data
Supplementary data to this article can be found online at https://doi.org/10.1016/j.jpha.2020.11.005.
杂志排行
Journal of Pharmaceutical Analysis的其它文章
- A simplified LC-MS/MS method for the quantification of the cardiovascular disease biomarker trimethylamine-N-oxide and its precursors
- UHPLC-MS/MS analysis of cAMP and cGMP in rat plasma as potential biomarkers of Yin-Yang disharmony in traditional Chinese medicine
- Liquid chromatography-mass spectrometry method for the quantification of an anti-sclerostin monoclonal antibody in cynomolgus monkey serum
- Plasma-metabolite-based machine learning is a promising diagnostic approach for esophageal squamous cell carcinoma investigation
- Reducing SARS-CoV-2 pathological protein activity with small molecules
- Development of the general chapters of the Chinese Pharmacopoeia 2020 edition: A review
