Rapid determination of leaf water content for monitoring waterlogging in winter wheat based on hyperspectral parameters
2021-08-12YANGFeifeiLIUTaoWANGQiyuanDUMingzhuYANGTianleLIUDazhongLIShijuanLIUShengping
YANG Fei-fei ,LIU Tao ,WANG Qi-yuan ,DU Ming-zhu ,YANG Tian-le ,LIU Da-zhong ,LI Shi-juan,LIU Sheng-ping
1 Key Laboratory of Agri-information Service Technology,Ministry of Agriculture and Rural Affairs/Agricultural Information Institute,Chinese Academy of Agricultural Sciences,Beijing 100081,P.R.China
2 Jiangsu Key Laboratory of Crop Genetics and Physiology/Jiangsu Co-Innovation Center for Modern Production Technology of Grain Crops/Agricultural College,Yangzhou University,Yangzhou 225009,P.R.China
3 College of Geoscience and Surveying Engineering,China University of Mining &Technology,Beijing 100083,P.R.China
Abstract Waterlogging is becoming an obvious constraint on food production due to the frequent occurrence of extremely high-level rainfall events.Leaf water content (LWC) is an important waterlogging indicator,and hyperspectral remote sensing provides a non-destructive,real-time and reliable method to determine LWC.Thus,based on a pot experiment,winter wheat was subjected to different gradients of waterlogging stress at the jointing stage.Leaf hyperspectral data and LWC were collected every 7 days after waterlogging treatment until the winter wheat was mature.Combined with methods such as vegetation index construction,correlation analysis,regression analysis,BP neural network (BPNN),etc.,we found that the effect of waterlogging stress on LWC had the characteristics of hysteresis and all waterlogging stress led to the decrease of LWC.LWC decreased faster under severe stress than under slight stress,but the effect of long-term slight stress was greater than that of short-term severe stress.The sensitive spectral bands of LWC were located in the visible (VIS,400–780 nm)and short-wave infrared (SWIR,1 400–2 500 nm) regions.The BPNN Model with the original spectrum at 648 nm,the first derivative spectrum at 500 nm,the red edge position (λr),the new vegetation index RVI (437,466),NDVI (437,466) and NDVI´ (747,1 956) as independent variables was the best model for inverting the LWC of waterlogging in winter wheat(modeling set:R2=0.889,RMSE=0.138;validation set:R2=0.891,RMSE=0.518).These results have important theoretical significance and practical application value for the precise control of waterlogging stress.
Keywords:winter wheat,hyperspectral remote sensing,leaf water content,new vegetation index,BP neural network
1.Introduction
Waterlogging is becoming a more obvious constraint on food production due to the frequent occurrence of extremely highlevel rainfall events.Waterlogging has been reported around the world,such as in Egypt and Saudi Arabia (Bastawesyet al.2012),in the mid-lower reaches of the Yangtze River(Wuet al.2018),Bihar State in India (Chowdaryet al.2008)and the Indo Gangetic Plain in India (Pandeyet al.2010).The damage of waterlogging stress to crops is mainly caused by secondary stress induced by the excessive soil water,such as excessive CO2and hypoxia (Yanget al.2011).In the short term,it can weaken cell respiration,affect root pressure,and subsequently hinder water absorption.Over a longer time frame,anaerobic respiration occurs,more alcohol is produced and accumulated,the root system is poisoned and injured,and water absorption is reduced,which can lead to a decrease of leaf water content (LWC)(Yanget al.2011;Sampathkumaret al.2014).When the leaves are deficient in water,the biosynthesis of chlorophyll is affected.The decomposition of the existing chlorophyll is accelerated,causing the leaves to yellow,affecting the photosynthesis of the leaves (Duet al.2012;Shenet al.2015),and thus affecting the growth of the crops.LWC reflects the absolute value of water content (Liet al.2018),which can more directly reflect the actual condition of crop growth.It is an important index for monitoring various crop physiological processes (Shenet al.2015;Junttilaet al.2016) and evaluating (Ullahet al.2014) waterlogging stress.LWC is often calculated by the drying method,which has the limitations of high labor intensity and long monitoring time.Hyperspectral remote sensing provides a nondestructive,real-time and reliable method for determining LWC (Arshadet al.2017;Zhanget al.2017).Fertilizer addition (Khanet al.2017;Nguyenet al.2018) and drainage management can reduce the impact of waterlogging stress on the soil(Nguyenet al.2018) and the damage to the crops generally.Therefore,it is of great significance to determine the LWC of waterlogging in winter wheat rapidly based on hyperspectral parameters.
At present,vegetation moisture inversion methods mainly include radiative transfer models (Cleverset al.2010;Jonget al.2014;Yiet al.2014),traditional regression analysis methods (Geet al.2016;Rodríguez-Pérezet al.2018) machine learning algorithms (Kiraet al.2015),and other methods.The radiative transfer model is a function with canopy,leaf,and soil background characteristics.It has a physical theoretical basis,but has poor quality for model inversion (Atzbergeret al.2015).Traditional regression analysis methods mainly include ordinary least squares regression (OLSR),regression coefficient (RC),stepwise discriminant analysis (SDA),and others.They have higher accuracy but are not universally applicable.Machine learning algorithms,such as artificial neural network (ANN) and support vector machine (SVM),have the characteristics of learning,fault tolerance and real-time application,and also have an unparalleled advantage in fitting nonlinear problems.Rodríguez-Pérezet al.(2018)used field hyperspectral data to estimate LWC of grapes,modeled it using OLSR and functional linear regression(FLR) models,and found that the FLR Model centered at 1465 nm had the highest accuracy (R2=0.7,RMSE=8.485).Caoet al.(2015) determined that the optimal spectral ranges for monitoring leaf moisture conditions were 350–700 and 1 300–2 500 nm through a leaf dehydration experiment.The optimal hyperspectral vegetation indices were dND (1 415,1 530) and dSR (1 530,1 895) built on a normalized and ratio first derivative spectrum,with correlation coefficients of 0.95 and 0.97,respectively.Geet al.(2016) described the above-ground growth and water use of maize under two water treatments based on RGB and hyperspectral images,and modeled LWC (R2=0.81,0.92).Zhang and Zhou (2015) found that the most sensitive vegetation indices for monitoring canopy water content (CWC) and leaf equivalent water thickness (EWT) were green chlorophyll index (CIgreen),red edge chlorophyll index (CIred edge)and red edge normalized ratio (NRred edge),respectively,while CWC was closely related to soil water status and crop growth stage.
There have been a few studies on the waterlogging stress level based on hyperspectral remote sensing,mainly including monitoring the occurrence of waterlogging stress and distinguishing between two kinds of environmental stresses (Emenginiet al.2013;Jianget al.2015).Jianget al.(2013) found that R800×R550/R680(R800,R550and R680,the spectral reflectance value at 800,550 and 680 nm,respectively) was the optimal vegetation index for identifying waterlogging stress.Xionget al.(2016) suggested that the mean difference of the spectrum in the 670–2 400 nm band could be used to reflect the situation of wheat under waterlogging stress.Jianget al.(2015) found that AREAred/AREAgreenand AREAred×AREAgreen(AREAgreenand AREAred,the area of the 510–545,and 690–750 nm regions of the first-derivative curve,respectively) can effectively distinguish crops under CO2leakage and waterlogging stress.Emenginiet al.(2013) proved that the combination of hyperspectral and thermal infrared remote sensing may distinguish oil pollution,waterlogging and the coupled stress of oil and waterlogging.
The vegetation indices for estimating LWC were mostly determined by using existing water-sensitive bands,but they did not take all bands into account for a comprehensive analysis (Huntet al.2016).Some vegetation indices still needed to consider the problem of premature saturation when vegetation coverage is high (Zhang and Zhou 2015;Zhanget al.2017).This paper compared the effect of different waterlogging stresses on LWC and analyzed the full-band spectral data of leaves in the 350–2 500 nm spectral region in order to construct new vegetation indices that are suitable for inverting LWC of winter wheat under waterlogging stress.
Therefore,it is desirable to improve the accuracy of rapid LWC determination for waterlogging in winter wheat based on hyperspectral parameters.The objectives of the present study are thus to:(1) compare the effect of different waterlogging stresses on LWC,(2) determine the optimal correlations between hyperspectral parameters and LWC,and (3) establish an optimal model to invert LWC of waterlogging in winter wheat.
2.Materials and methods
2.1.Experimental design
The experiment was conducted in the potted proving ground of Yangzhou University,Yangzhou,China (119°25´N,32°23´E).Seeds were sown on 10 November 2018,the seeding density was eight holes per pot,two seeds per hole.When the three leaves were concentrated,the seedlings were set to eight plants per pot,and harvested on 28 May 2019.The inner diameter of the pot bottom was 20 cm,the inner diameter of the mouth was 28 cm,the height was 29 cm,and the empty pot weighed 0.54 kg.Each pot contained 10 kg air-dried soil and 5.28 g compound fertilizer.The N–P–K ratio of the compound fertilizer was 15%–15%–15%.After sowing,1 kg of soil was covered,and 3.52 g of compound fertilizer was applied at the jointing stage.The wheat varieties included Yangfumai 4 (YF4),Jimai 31(JM31) and Jimai 38 (JM38) (C1,C2 and C3),among which YF4 is normal,JM31 is sensitive to water,and JM38 is not sensitive to water.The gradient experiment of waterlogging stress was conducted on winter wheat at the jointing stage(15 March 2019),including control (W1),slight waterlogging stress (W2) which lasted 5,10 and 15 d (D1,D2 and D3)and severe waterlogging stress (W3) which lasted 5,10 and 15 d.All waterlogging stress treatments were completed on 30 March 2019.After this,soil water of each pot was controlled as normal until the winter wheat was mature and harvested.The design consisted of 21 treatments (W1C1,W1C2,W1C3,W2D1C1,W2D1C2,W2D1C3,W2D2C1,W2D2C2,W2D2C3,W2D3C1,W2D3C2,W2D3C3,W3D1C1,W3D1C2,W3D1C3,W3D2C1,W3D2C2,W3D2C3,W3D3C1,W3D3C2,and W3D3C3),and each treatment was repeated nine times.The weighing method was used to control water in the experiment.Waterlogging stress can be divided into two types:slight and severe waterlogging stresses (Yuet al.2013).The degree is mainly determined by precipitation (Maet al.2018) or soil relative water content (Gaoet al.2018).Combined with previous studies (Liet al.2011,2017) and the research objectives of this paper,the design criteria for this gradient experiment of waterlogging stress were as follows:W1 was set to control soil relative water content at 70–80%,W2 was set to control soil relative water content at 85–90%,and W3 was set to keep a water layer (about 1.5 cm) above the soil surface.After waterlogging stress,the pot experiment of winter wheat at the heading stage is shown in Fig.1.
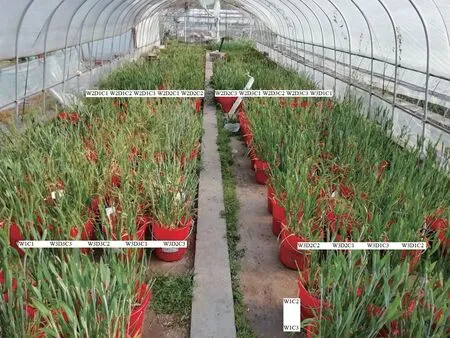
Fig.1 Pot experiment of winter wheat (heading stage).W1,control;W2,slight waterlogging;W3,severe waterlogging.D1–D3,5,10 and 15 d,respectively.C1,YF4;C2,JM31;C3,JM38.
2.2.Data acquisition
Leaf hyperspectral dataLeaf hyperspectral data were measured in the optical range (350–2 500 nm) using a field spectrometer (ASD Field Spec3,USA) equipped with a leaf clip,in which a light source of a tungsten quartz halogen lamp was embedded.The sampling interval was 1.4 nm from 350 to 1 000 nm and 2 nm from 1 000 to 2 500 nm.A white reference scan was made for calibration before the reflectance measurement,which was done in the leaf clip with matched openings for non-destructive contact measurements.Starting from the day of waterlogging at the jointing stage,we chose sampling times with sunny and windless weather,and measured the leaf hyperspectral data at 10:00–14:00,once every 7 days until the winter wheat was mature.Leaf hyperspectral data were measured at the middle part of the leaf sample,five pots were measured for each treatment,and measurements were taken four times for each pot.The average value was taken as the leaf hyperspectral data point for each treatment.During the measurement,a standard whiteboard calibration was performed every 30 min.
Leaf water contentImmediately after reflectance measurement,three representative winter wheat plants for each treatment were selected and sealed in self-sealing plastic bags to avoid water loss.After the stems and leaves were separated,leaf fresh weight of each sample was firstly measured,then leaf dry weight was measured after it was killed at 105°C for 0.5 h and then dried in an oven at 80°C for 48 h to a constant weight.The calculation formula of LWC is as follows:

where LFWC and LDWC represent leaf fresh weight and leaf dry weight.
2.3.Methods
The first derivative spectrumIn order to reduce the influence of field noise on the spectral data,the original spectral data were de-noised and smoothed by View Spec Pro (Analytical Spectral Devices.,USA).The first derivative spectral reflectance was calculated by the direct difference method to highlight the spectral characteristics of the target.The calculation formula of the first derivative spectrum is as follows:where,λi,wavelength,nm;ρ(λi) and ρ´(λi),original and the first derivative spectral reflectance at λiwavelength;Δλ,the interval between wavelength λi–1 and λi+1.

Red edge parametersThe red edge phenomenon is the most obvious spectral feature of green vegetation that distinguishes it from other features.For example,there is no red edge phenomenon in rocks,soil and most plant litter.The parameters describing the red edge generally include the red edge position λr,the red edge amplitude Dr and the red edge area SDr (Choet al.2008).Based on the derivative transformation,these red edge parameters can be extracted.λr is the wavelength corresponding to the maximum value of the first derivative spectrum in the red light range (680–760 nm),Dr is the maximum value of the first derivative spectrum in the red edge range,and SDr is the sum of the first derivative band values in the red light range.
Vegetation indexThe vegetation indices were constructed by combining any two bands in the range of 350–2 500 nm of the original and first derivative spectra,and compared with the conventional vegetation indices (Table 1).Ratio vegetation index (RVI (λ1,λ2)),normalized difference vegetation index (NDVI (λ1,λ2)) and difference vegetation index (DVI (λ1,λ2)) are commonly used in remote sensing monitoring.Then the relationships between these vegetation indices and the measured LWC of the winter wheat were analyzed in detail.The calculation formula is as follows:

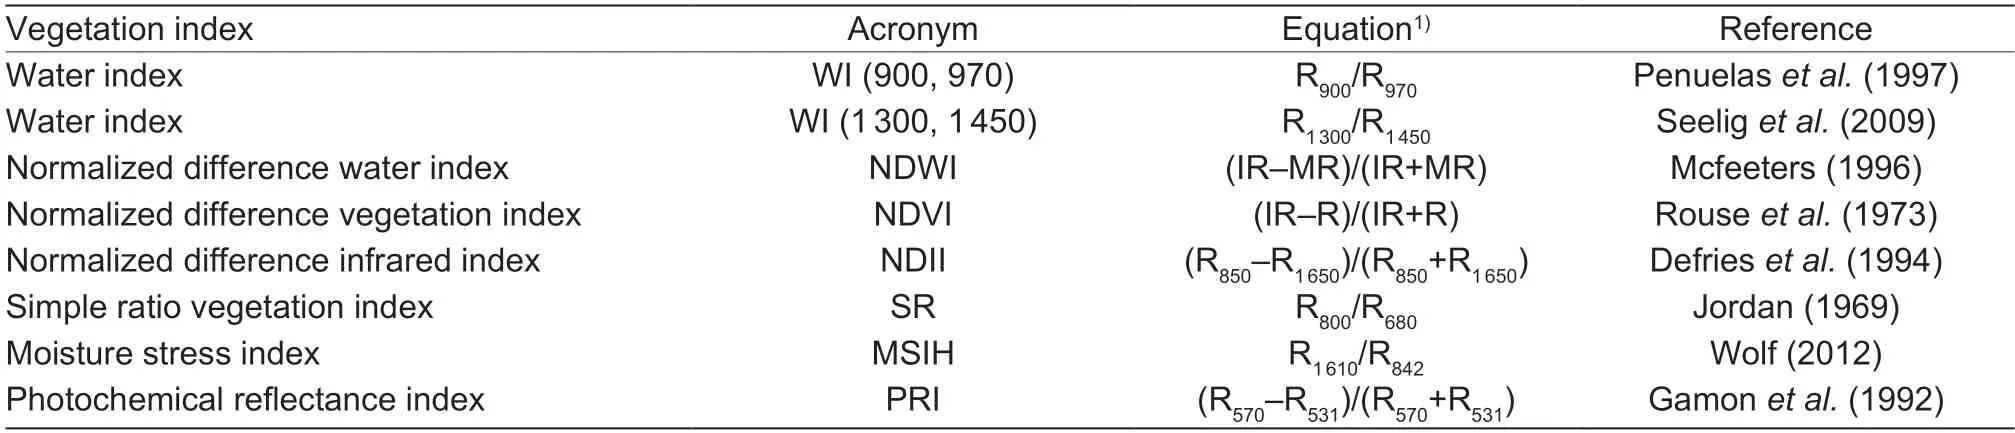
Table 1 Vegetation indices related to leaf water content (LWC)

where,λ1 and λ2,wavelength,nm;Rλ1and Rλ2,reflectance at λ1 and λ2 wavelength,λ1≠λ2.
Model building and validationUsing sample set partitioning based on jointx–ydistance (SPXY) algorithm,leaf samples of winter wheat from the jointing to milking stage (15 March–5 May) were divided into a modeling set (n=100) and a validation set (n=47).Winter wheat at the ripening stage (5 May–13 May) was not selected for analysis since the leaves turn yellow due to senescence,so it is of limited use in showing the relationship between leaf hyperspectral data and LWC.Hyperspectral parameters with high fitting accuracy were selected as independent variables,and the traditional regression models and BPNN Model were constructed.R2and RMSE were used as indicators to evaluate the learning and prediction ability of the models.Combined with the results of the modeling and validation accuracy,the best estimation model can be selected.The calculation formula is as follows (Wanget al.2008):

whereyi,measured values;yˆi,predicted value;andn,sample size.
Matlab R2017a,Excel 2013 and Origin 2017 were used for statistical analysis and plotting.
According to the research objectives and content,a flowchart of the experimental design is shown in Fig.2.
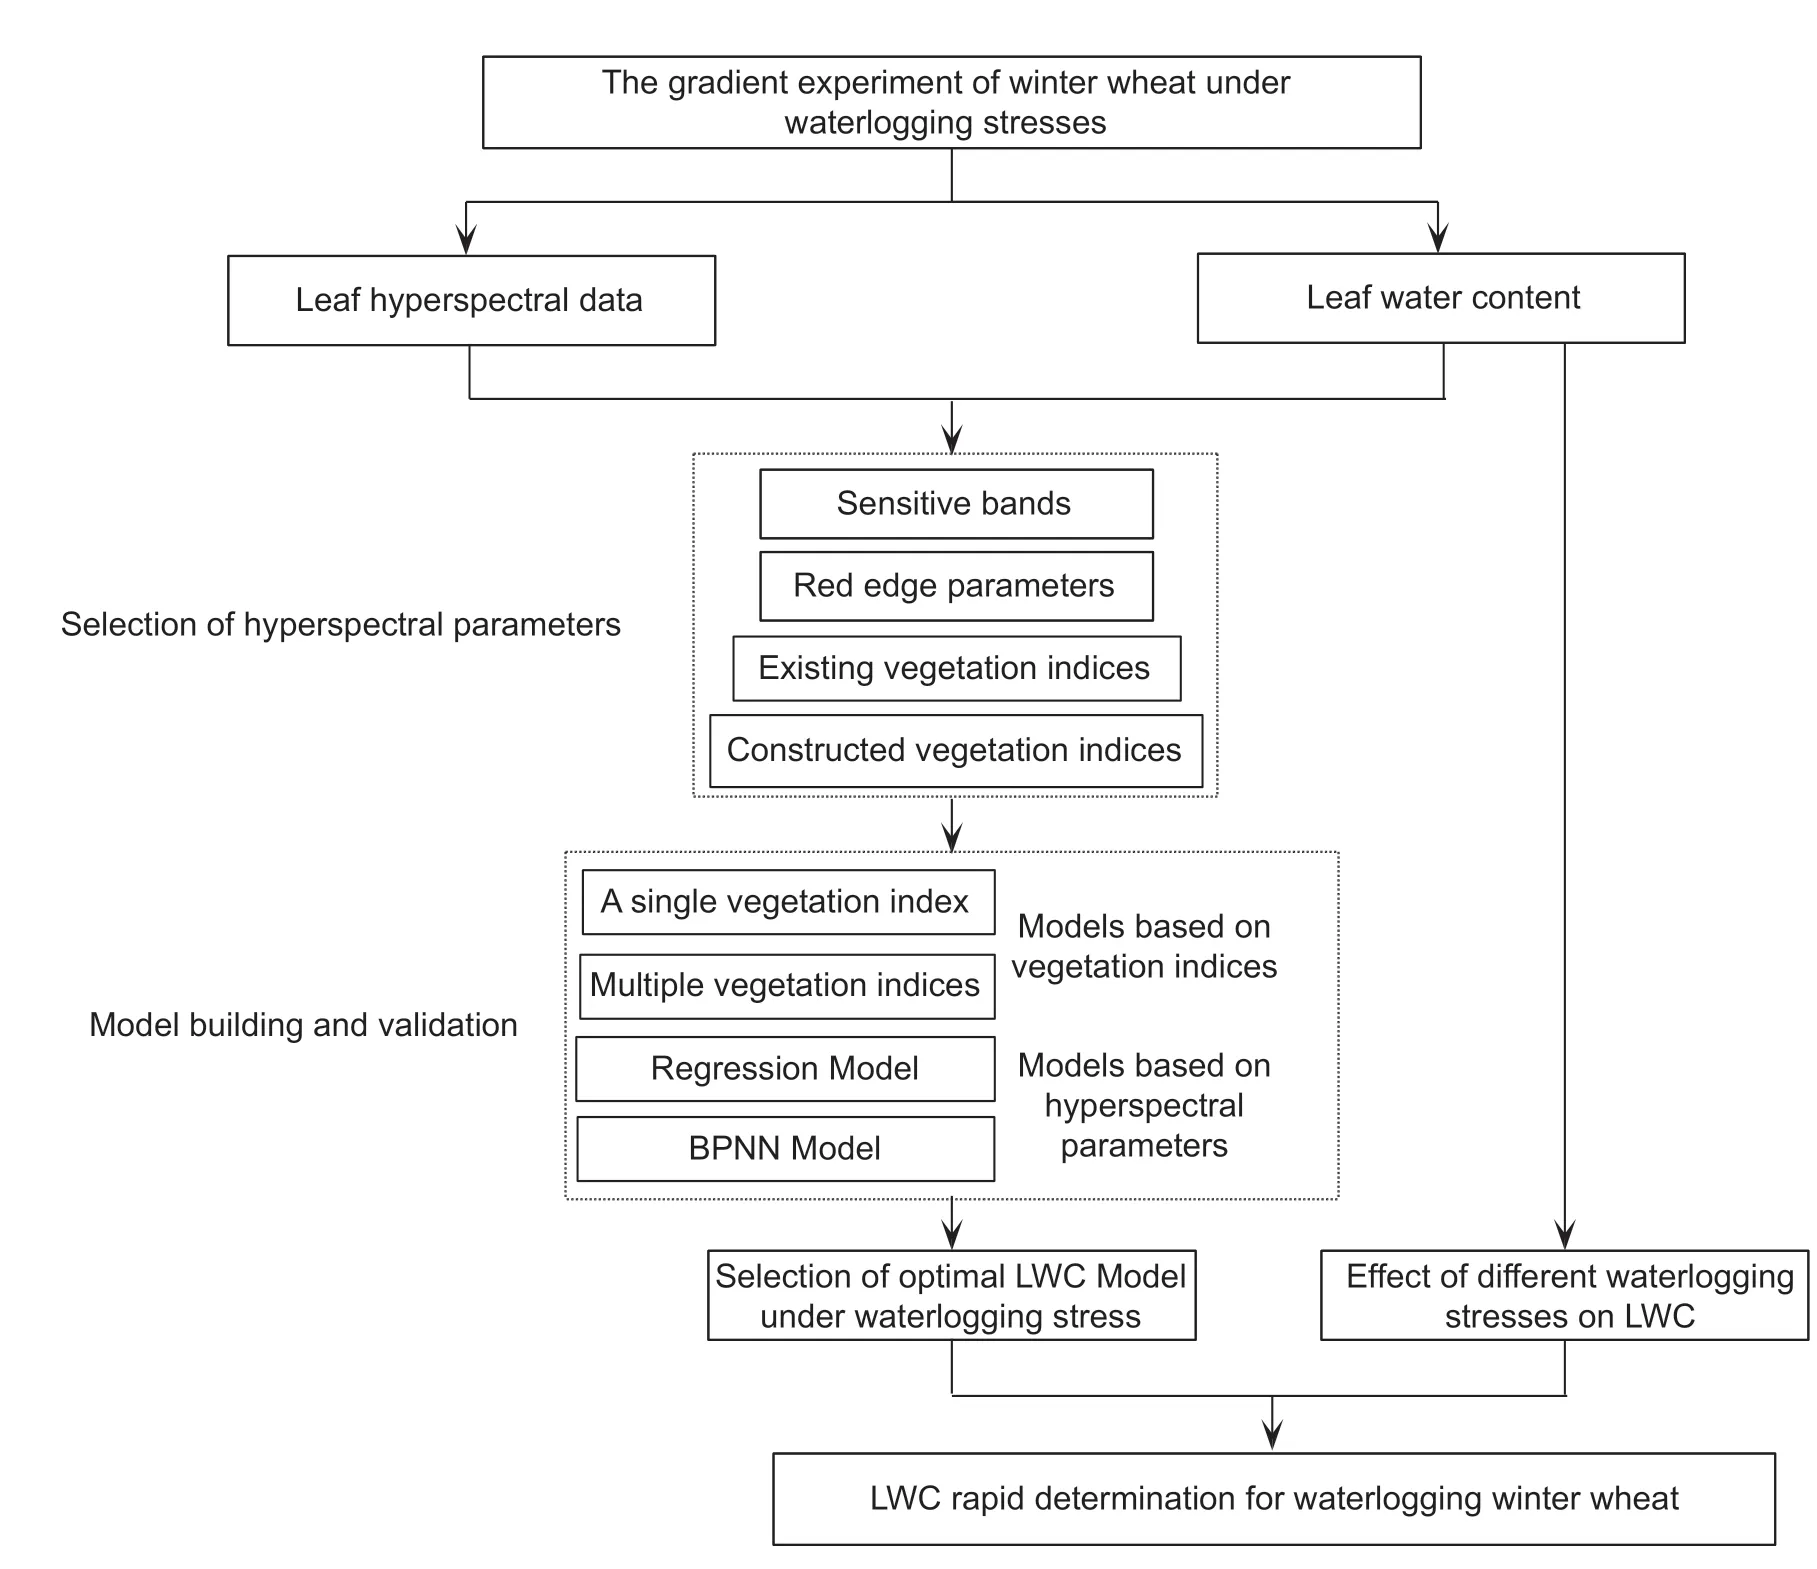
Fig.2 A flowchart of the experimental design.LWC,leaf water content.
3.Results
3.1.Effect of different waterlogging stresses on LWC
The variation trends of the three wheat varieties were basically the same,and this study aimed to find the universal rules.Differences exhibited by the individual varieties will not be described in this paper.LWC of the three varieties were averaged,and then the LWC under these seven stress levels (W1,W2D1,W2D2,W2D3,W3D1,W3D2,and W3D3)at different growth stages were compared.The results are shown in Fig.3.At the jointing stage (15 March–30 March),the difference of LWC was small,without an obvious rule.From the heading stage (30 March–8 April) to the flowering stage (8 April–16 April),LWC decreased in the order of slight stress which lasted 15 d,followed by severe stress which lasted 5,10 and 15 d.LWC under severe stress decreased rapidly at this stage.From the filling stage (16 April–24 April)to the milking stage (24 April–5 May),LWC decreased in the order of severe stress which lasted 5 and 10 d,slight stress which lasted 15 d and the severe stress which lasted 15 d.At this stage,LWC under waterlogging stress for a long time period decreased rapidly.At the ripening stage (5 May–13 May),the differences of LWC under different waterlogging stresses were small,and there is no obvious rule,which may be caused by leaf senescence.
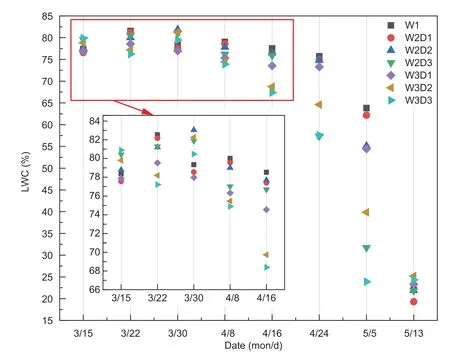
Fig.3 Effect of different waterlogging stresses on leaf water content (LWC).W1,control;W2,slight waterlogging;W3,severe waterlogging.D1–D3,5,10 and 15 d,respectively.
Overall,these results indicate four basic rules.(1) All waterlogging stress could lead to a decrease of LWC.(2)From the jointing to the maturity stage,LWC decreased gradually.(3) During the jointing stage (15 March–30 March),LWC did not change significantly between different treatments.After all treatments ended,changes began at the heading stage (30 March–8 April),which indicated the effect of waterlogging stress on LWC was hysteresis.(4)From the heading (30 March–8 April) to the flowering stage(8 April–16 April),LWC under different durations of severe stress decreased faster than that under slight stress.From the filling (16 April–24 April) to the milking stage (24 April–5 May),LWC under slight stress which lasted 15 d was lower than that under severe stress which lasted 5 or 10 d.This indicated that LWC was more sensitive to stress degree at the heading and flowering stages,and the stress duration was more important at the filling and milking stages.This may be due to the fact that at the heading and flowering stages,waterlogging stress had just ended.Soil water was supersaturated under severe waterlogging stress,and the O2content decreased faster than under slight waterlogging stress,resulting in a faster decline in LWC (Yanget al.2011).If the stress duration was long,oxygen poisoning would occur in the root system,resulting in an accumulation of toxins.Changes of LWC were more likely to be revealed at the filling and milking stages,during which time waterlogging stress had ended for some time (Liuet al.2018).
3.2.Quantitative relationships between LWC and hyperspectral parameters
Correlations between LWC and either leaf original or first derivative spectral dataCorrelation analysis is a statistical method to study the direction and degree of correlation between two or more random variables (Zhanget al.2018).Here,it was performed on LWC (n=147)from the jointing to milking stages (15 March–5 May) with corresponding leaf original and first derivative spectral data (Fig.4).The results showed a significant negative correlation between leaf original spectral reflectance and LWC in the visible (VIS,400–780 nm) and short-wave infrared (SWIR,1 400–2 500 nm) regions,but the correlation was very irrelevant in the near-infrared (NIR,780–1 100 nm)region (|r|<0.1),which was similar to previous studies (Caoet al.2015).The first derivative spectrum can effectively eliminate the influence of factors such as field noise.LWC and the first derivative spectrum showed a good correlation in all the regions other than in the NIR region.The maximum correlation coefficient wavelength of the original spectrum was at 648 nm (r=–0.68),followed by 1 980 nm (r=–0.6);while the maximum correlation coefficient wavelength of the first derivative spectrum was at 500 nm (r=–0.63) and 1 912 nm (r=0.62).These results showed that the water sensitive bands were in the VIS (400–780 nm) and SWIR(1 400–2 500 nm) regions,and the optimal sensitive bands for determining LWC were at 500,648,1 912,and 1 980 nm.
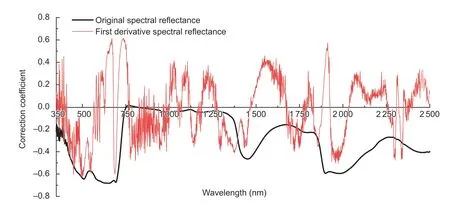
Fig.4 Correlation coefficients between leaf water content (LWC) and the leaf original and first derivative spectral data.
Correlations between LWC and red edge parametersBased on the derivative transformation,the red edge parameters could be extracted,including the red edge position λr,the red edge amplitude Dr and the red edge area SDr.The red edge is the most obvious spectral feature of green plants that distinguishes them from other surface features.It is often used as an indicative feature of crop nutrition (Fenget al.2016;Guoet al.2018),growth (Guet al.2015),moisture (Zhang and Zhou 2015),etc.Here,the correlation analysis between LWC (n=147) and the red edge parameters showed that λr was most positively related to LWC (r=0.657),while Dr and SDr had weaker correlations with LWC (r=0.103 and 0.304,respectively).
Correlations between LWC and existing vegetationindexBased on the experimental data in this study,the ability of using existing vegetation indices to monitor LWC was tested.Eight existing vegetation indices closely related to leaf water status and their correlation coefficients with LWC are listed in Table 2.The results show that the water index WI (1 300,1 450),normalized vegetation index NDVI and normalized difference water index NDWI had better correlations with LWC.The spectral bands contained in the vegetation indices,which have better correlations with LWC,were mainly concentrated in the VIS and SWIR regions.The correlation coefficients between these vegetation indices and LWC in this experiment ranged from 0.43 to 0.73,and the highest correlation coefficient was 0.727,indicating that these vegetation indices still have certain limitations for rapid LWC determination of waterlogging in winter wheat.
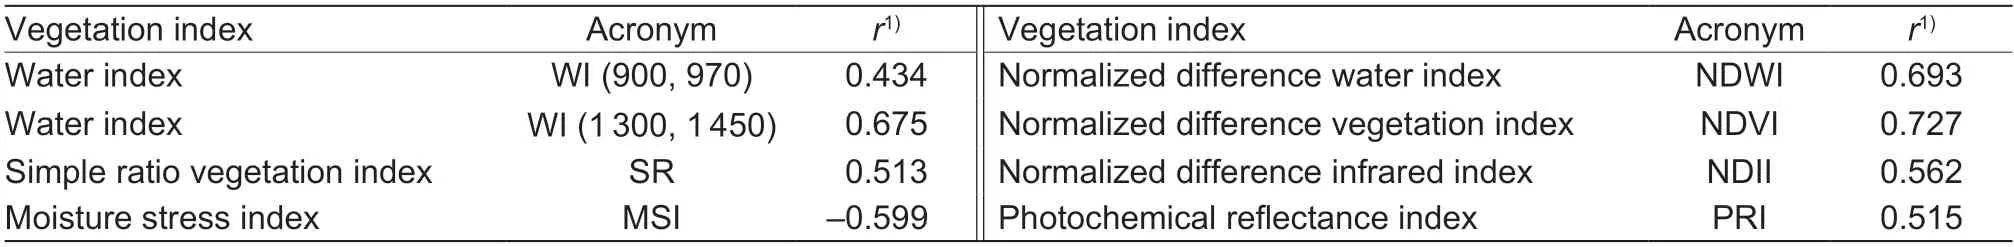
Table 2 Correlation coefficients between existing vegetation indices and leaf water content (LWC)
lnvestigating the LWC sensitivity of constructed vegetation indicesIn order to find the optimal vegetation index for determining LWC,we analyzed the correlations between LWC and constructed vegetation indices (RVI(λ1,λ2),NDVI (λ1,λ2),DVI (λ1,λ2)) systematically.The correlation coefficient was used as the criterion for evaluating the correlations (Fig.5).The best original vegetation indices to invert LWC were found to be RVI (437,466),NDVI (437,466) and DVI (444,460),with correlation coefficients of 0.782,0.783 and 0.772,respectively.The bands for constructing the three vegetation indices were all in the VIS region.The best first derivative vegetation indices were RVI´ (2 337,466),NDVI´ (747,1 956),and DVI´ (1 536,497),with correlation coefficients of 0.745,0.763 and 0.729,respectively.The bands for constructing these three vegetation indices were in the VIS (400–780 nm)and SWIR (1 400–2 500 nm) regions.The correlations of the original vegetation indices were better than the first derivative vegetation indices.

Fig.5 Correlation coefficients between leaf water content (LWC) and RVI (λ1,λ2) (A),NDVI (λ1,λ2) (B),DVI (λ1,λ2) (C),RVI´(λ1,λ2) (D),NDVI´ (λ1,λ2) (E),DVI´ (λ1,λ2) (F).RVI (λ1,λ2),NDVI (λ1,λ2) and DVI (λ1,λ2),ratio,normalized difference and difference vegetation index constructed by original spectral data;RVI´ (λ1,λ2),NDVI´ (λ1,λ2) and DVI´ (λ1,λ2),ratio,normalized difference and difference vegetation index constructed by the first derivative spectral data.r,correlation coefficient.
3.3.Model building and validation
Model based on vegetation indices(1) Regression model based on a single vegetation index.In order to use a vegetation index to estimate LWC more accurately,the absolute values ofrhigher than 0.68 were selected from the existing and constructed vegetation indices.Exponential,linear regression and polynomial models based on each individual vegetation index were then established and analyzed (Table 3).
The fitted regression models all reached a significant level(Table 3).Among existing vegetation indices,NDVI had the best performance.For vegetation indices constructed by the original spectrum,the accuracy of the models established by RVI (437,466) or NDVI (437,466) as the independent variable were higher.The highestR2values were obtained for polynomial models,0.722 and 0.721,respectively.TheR2of models established by DVI (444,460) was lower than the other two vegetation indices,which indicated that the ratio vegetation index and normalized vegetation index constructed by the original spectrum had higher sensitivity and stability for monitoring LWC.For vegetation indices constructed by the first derivative spectrum,the exponential model constructed by NDVI´ (747,1 956) as the independent variable had the highest accuracy,and itsR2was 0.721.
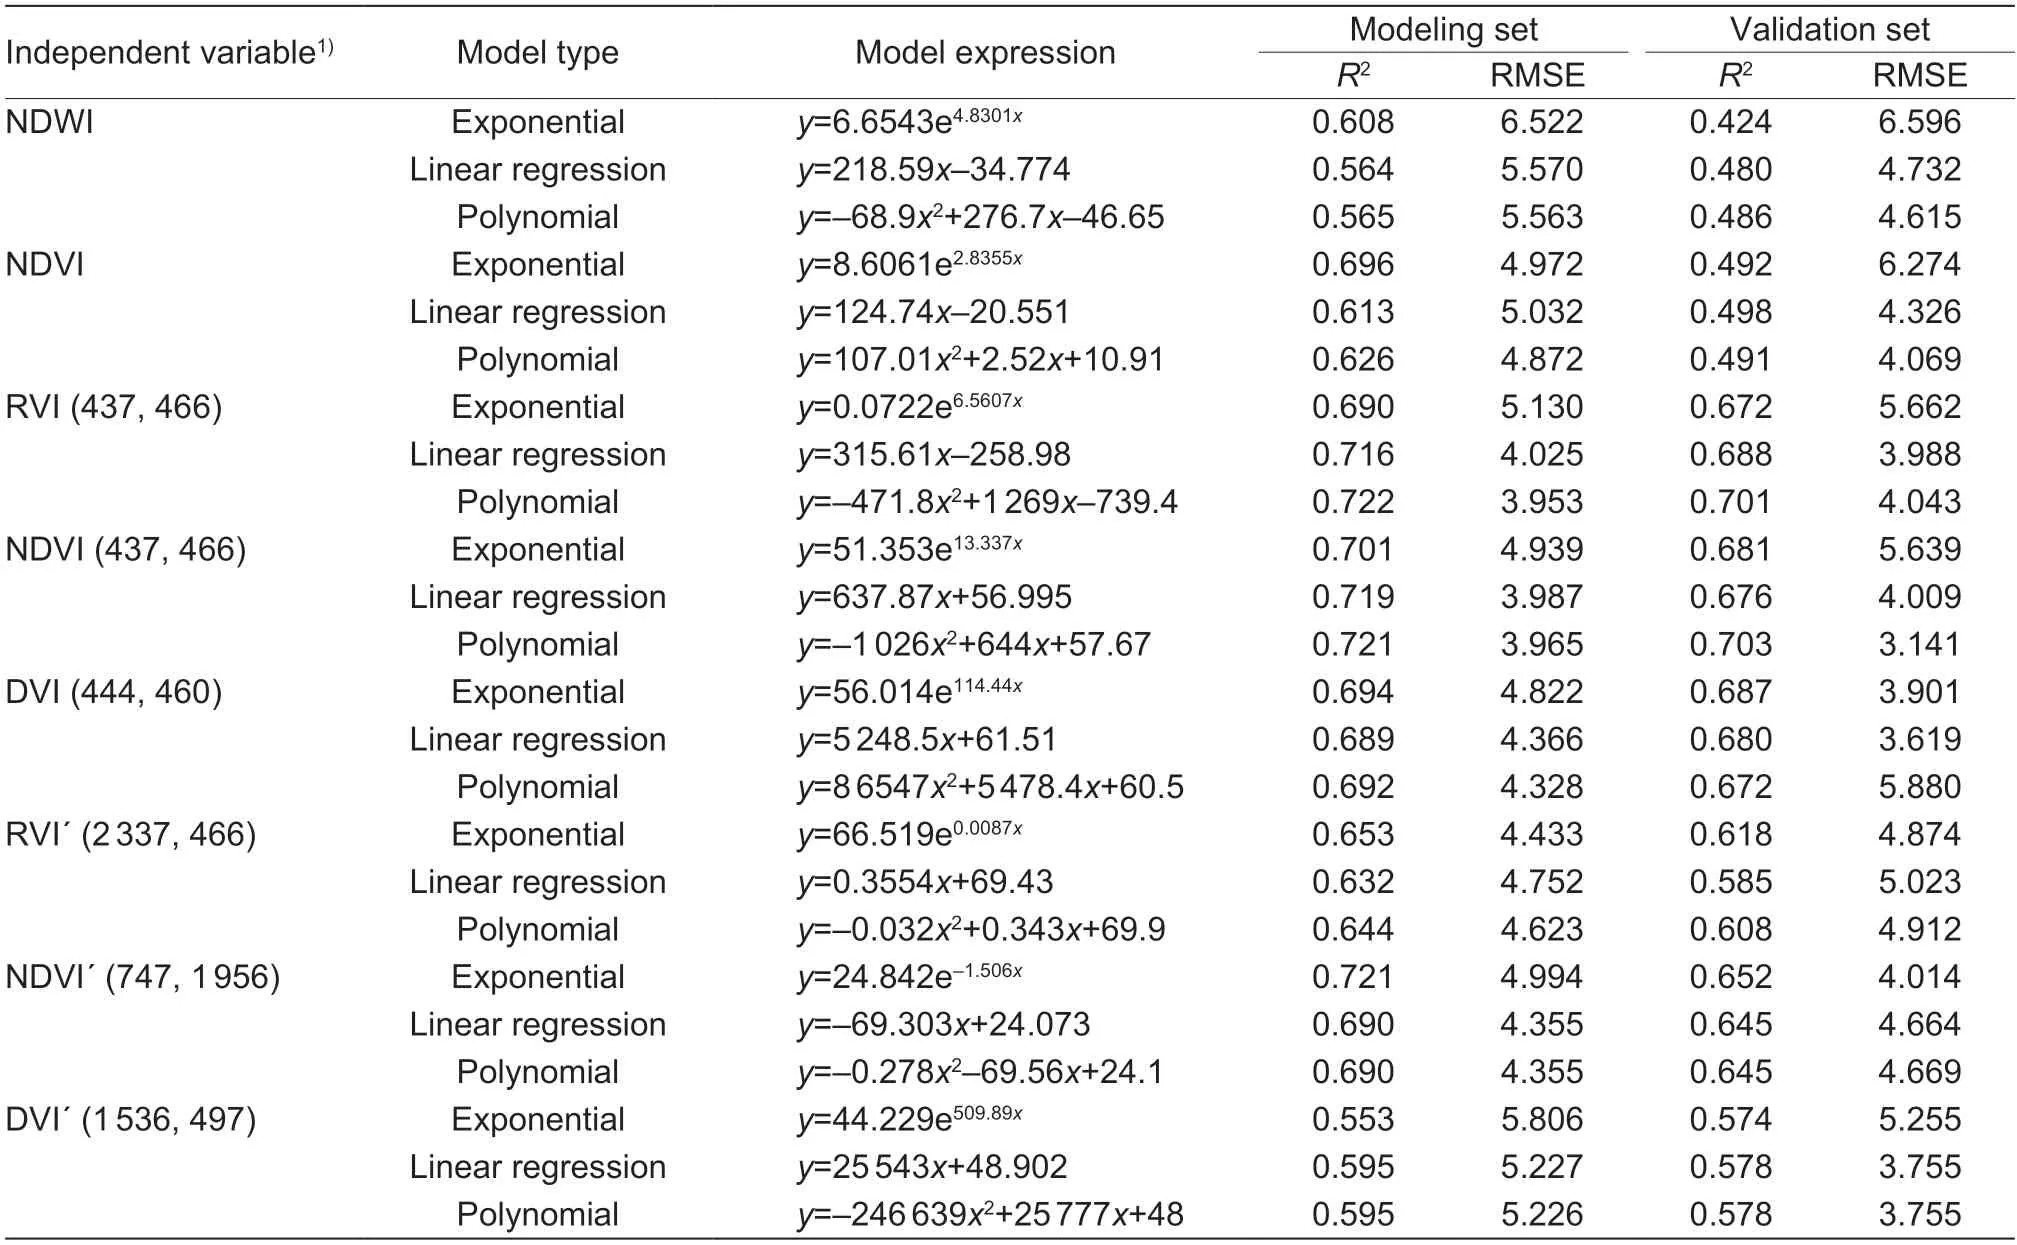
Table 3 Regression model for leaf water content (LWC) based on single vegetation index
Generally speaking,theR2values of the modelsestablished with new vegetation indices constructed by the original spectrum were between 0.690 and 0.722.The fitting accuracy of the models was the highest.TheR2values of the models established with new vegetation indices constructed by the first derivative spectrum were between 0.553 and 0.721.The gap of fitting accuracy between the models was the largest.TheR2values of the models established with existing vegetation indices were between 0.564 and 0.696.The fitting accuracy of the models was the lowest.The suitable models were chosen based on maximumR2and minimal RMSE of the modeling and validation sets.It was found that the polynomial and exponential regression models were better than the linear regression models.Regression models based on a single vegetation index RVI (437,466),NDVI (437,466) and NDVI´(747,1 956),respectively,were relatively the best among these models.
(2) Regression model based on multiple vegetation indices.Based on the results of regression models using a single vegetation index,we found that new index RVI(437,466),NDVI (437,466) and NDVI´ (747,1 956) could be used as the optimal vegetation index to invert the LWC of waterlogging in winter wheat.So the regression model based on these three indices was constructed.The model expression was as follows:y=396.925x1–431.322x2+28.834x3–353.772.Wherex1,RVI (437,466);x2,NDVI (437,466);x3,NDVI´ (747,1956);y,LWC.TheR2of the modeling set was 0.736,RMSE was 3.431;R2of the validation set was 0.721,RMSE was 3.557.These results showed the fitting accuracy of the model was a little higher than the regression model based on a single vegetation index.
Model based on hyperspectral parameters(1) Regression model based on multiple hyperspectral parameters.This analysis showed that regression models using multiple vegetation indices were better than those using a single index,so a regression model based on multiple hyperspectral parameters should be established.The parameters which had a better correlation with LWC were selected as independent variables:the constructed vegetation index RVI(437,466) (x1),NDVI (437,466) (x2),NDVI´ (747,1 956) (x3),together with the original spectral reflectance at 648 nm (x4),the first derivative spectral reflectance at 500 nm (x5) and the red edge position λr (x6).The regression model was constructed,and the expression was as follows:y=–97.16x1+724.286x2+35.985x3+63.456x4+7 689.06x5+0.092x6+58.688.TheR2of the modeling set was 0.753,RMSE was 2.421;R2of the validation set was 0.764,RMSE was 2.285.These results showed that the fitting accuracy of the model was higher than that of the regression model based on three new vegetation indices.
(2) BPNN Model based on multiple hyperspectral parameters.Matlab R2017a was used for BPNN Model training.The six hyperspectral parameters selected were used as input variables,LWC was selected as an output variable.Firstly,the input and output variables were normalized,then they were linearly compressed to the range of [–1,1] to make the network easy to converge during the training phase (Azimi-Sadjadiet al.1993).The neuron transfer function of the middle layer of the network used the S-tangent function Tansig,the transfer function of the output layer neuron used the linear function Purelin,and the training function was trainlm.Finally,a BPNN Model with a network structure of 6–8–1 was constructed.The number of input layer nodes was 6,the number of hidden layer nodes was 8 and the number of output layer nodes was 1.
TheR2between the measured and inversion values of the modeling set was 0.889,and RMSE was 0.138 (n=100;Fig.6).The measured and predicted values of the validation set were fitted and validated for accuracy.TheR2between them was 0.891,while RMSE was 0.518 (n=47;Fig.7).The fitting accuracy of this model was higher than that of the conventional models,so it could invert LWC of waterlogging in winter wheat well.
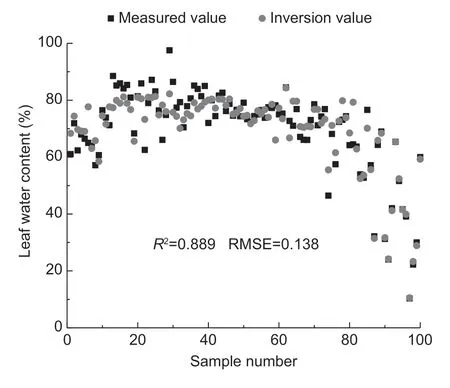
Fig.6 Comparative analysis of measured and inversion values of the modeling set.R2,determination coefficient;RMSE,root mean square error.
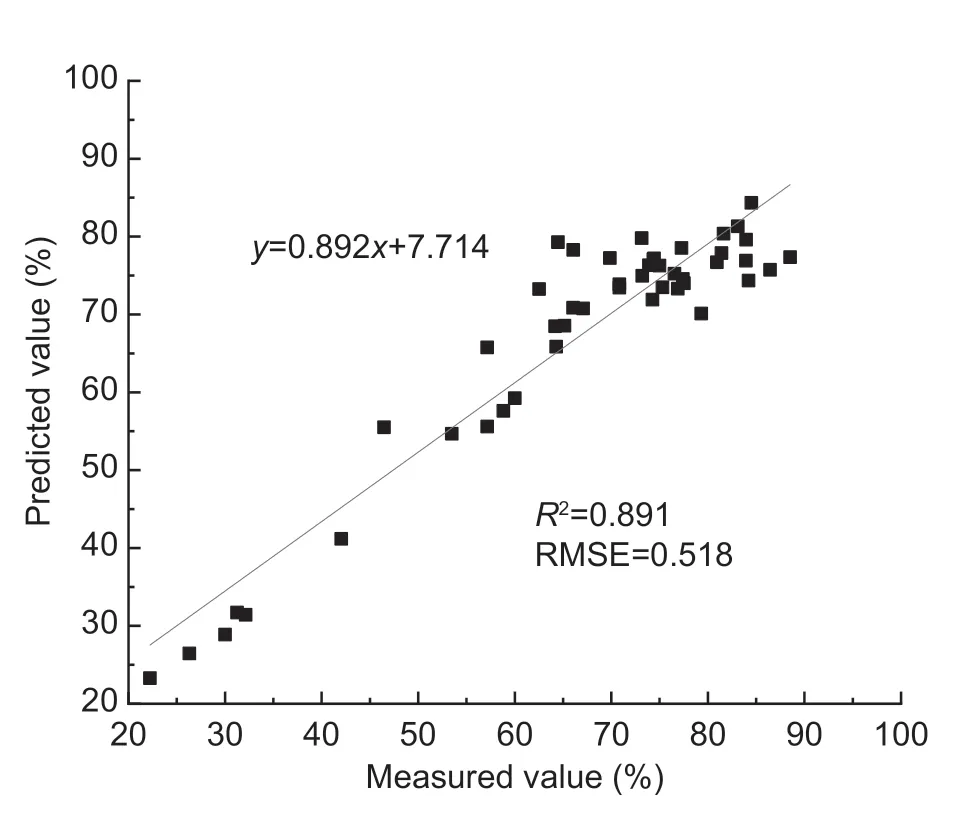
Fig.7 Comparative analysis of measured and predicted values of the validation set.R2,determination coefficient;RMSE,root mean square error.
4.Discussion
In this study,three varieties (YF4,JM31 and JM38) of winter wheat were used as the research objects.A waterlogging stress gradient experiment was performed at the jointing stage (control,slight waterlogging which lasted 5,10 and 15 d,and severe waterlogging which lasted 5,10 and 15 d).Changes of LWC at different growth stages after waterlogging stress were analyzed,the optimal correlations between hyperspectral parameters and LWC were determined,and finally,a model which was most suitable for inverting LWC of winter wheat under waterlogging stress was established.
4.1.Analysis of the LWC variation response to waterlogging stress
LWC is an important indicator for monitoring crop physiological processes and assessing waterlogging stress(Broskinskyet al.2014).The effect of waterlogging stress on LWC was lagging,and all waterlogging stress would eventually lead to a reduction in LWC of winter wheat(Fig.3).Water transport in the root system is determined by the total surface area and the hydraulic conductivity of the root system (Celedonioet al.2017).Studies have shown that waterlogging stress can inhibit photosynthesis in leaves (Celedonioet al.2017),delay root growth and reduce root water conductivity,thereby leading to a decrease in leaf moisture and stomatal conductance (Arakiet al.2012).Decreased LWC slowed the rate of photosynthetic carbon assimilation,the intrinsic photochemical efficiency and the electronic transport rate of photosystem II (PS II)strongly (Caoet al.2015),which would result in plant carbon starvation or hydraulic failure,leading to plant death(Mcdowellet al.2013;Sevantoet al.2014).The effect of severe waterlogging stress on LWC was faster than that of slight waterlogging stress,but the effect of long-term slight waterlogging on LWC was more profound than that of short-term severe waterlogging (Fig.3).Soil water was supersaturated under severe waterlogging stress,and the O2content decreased faster than that under slight waterlogging stress,resulting in a faster decline in LWC(Yanget al.2011).Prolonged waterlogging would make oxygen poisoning occur in the root system,resulting in a shortage of energy and accumulation of toxins (Liuet al.2018).
4.2.Analysis of leaf spectrum variation in response to waterlogging stress
Changes in the leaf spectrum are often caused by variation in chlorophyll,water content,internal structure,and dry matter content.This study showed that the sensitive bands of LWC were located in the VIS (400–780 nm) and SWIR(1 400–2 500 nm) regions,the optimal spectral sensitive bands were located near 500,648,1 912,and 1 980 nm(Fig.4),and the red edge position λr can also estimate LWC better,findings which were consistent with previous studies(Zhanget al.2012;Wuet al.2015).When the leaves were short of water,the pigments and nutrients will be affected.Reflectance in the VIS region is predominantly controlled by photosynthetic pigments and nutrients (Wanget al.2015),while the red-edge (670–737 nm) region can minimize the impact of the atmosphere and background (Ramoeloet al.2012,2015).Previous studies found that some indices based in the VIS could provide information on the water content of plant leaves.The photochemical reflectance index (PRI) was used to monitor water content (Suárezet al.2009),whereas indices based on the red-edge region were used to capture water stress,which induced a change in chlorophyll fluorescence (Dobrowskiet al.2005).The reflection spectrum of green plants in the 1 000–2 500 nm band is mainly controlled by liquid water and dry compounds;while 1 360–1 470 and 1 830–2 080 nm are the absorption bands of water,which had a high correlation with LWC and were not affected by the structure of the leaves (Zhanget al.2012).The bands for the identification of LWC inToona sinensiswere concentrated in 1 850–2 100 nm,and those ofLiriodendron chinensewere in 1 900–2 100 nm(Wuet al.2015).
4.3.LWC rapid determination
It is difficult to estimate the crop water status comprehensively and accurately with a single band spectral reflectance due to the strong reflection on the surface of fresh leaves,surface structure,internal structure of leaf cuticles and leaf hairs.By constructing the vegetation indices,the effective spectral information of the vegetation can be maximized,effectively reducing the single-band scattering effect,and improving its prediction accuracy (Chenget al.2011).In this paper,new vegetation indices were constructed using any two bands of 350–2 500 nm from the original and first derivative spectra.We found that the optimal vegetation indices for determining LWC were the constructed index RVI (437,466),NDVI (437,466) and NDVI´ (747,1 956).Based on the traditional regression analysis and BPNN methods,LWC was simulated.The 6–8–1 BPNN Model with the original spectrum at 648 nm,the first derivative spectrum at 500 nm,the red edge position (λr),the new vegetation index RVI(437,466),NDVI (437,466) and NDVI´ (747,1 956) as independent variables was the best model for inverting LWC of waterlogging in winter wheat (modeling set:R2=0.889,RMSE=0.138;validation set:R2=0.891,RMSE=0.518).
In this paper,leaf hyperspectral data were measured using a leaf-clamp active light source analyzer,which could effectively eliminate the effects of vegetation canopy structure,soil background,sensor attitude,and atmospheric absorption.The accuracy and stability of spectrum acquisition were high.Data used came from the waterlogging of winter wheat at the key growth stages,which had good controllability and representation.However,the constructed vegetation indices and model still had some variability.Therefore,they should be validated and improved by field experiments to improve their practicability and prediction accuracy.
5.Conclusion
In this study,we improved the accuracy of rapid LWC determination for waterlogging in winter wheat using hyperspectral parameters based on a gradient experiment.The results have important theoretical significance and practical application value for precise control of waterlogging stress.The results led to the following four major conclusions:
(1) The effect of waterlogging stress on LWC of winter wheat was lagging.All waterlogging stress could lead to the decrease of LWC.LWC decreased faster under severe stress than under slight stress,but the effect of long-term slight stress was greater than that of short-term severe stress.
(2) The sensitive bands of LWC were located in the VIS(400–780 nm) and SWIR (1 400–2 500 nm) regions,the optimal sensitive bands were located near 500,648,1 912,and 1 980 nm.The red edge position λr can also estimate LWC well.
(3) The original and first derivative spectra in the 350–2 500 nm band were compared in pairs,and ratio,difference,and normalized vegetation indices were calculated.New vegetation indices suitable for inverting LWC were constructed:RVI (437,466),NDVI (437,466) and NDVI´(747,1 956),with correlation coefficients of 0.782,0.783 and 0.763,respectively.
(4) A BPNN Model with the original spectrum at 648 nm,the first derivative spectrum at 500 nm,the red edge position(λr),the new vegetation index RVI (437,466),NDVI (437,466) and NDVI´ (747,1 956) as independent variables was the best model for inverting LWC of waterlogging in winter wheat (modeling set:R2=0.889,RMSE=0.138;validation set:R2=0.891,RMSE=0.518).
Acknowledgements
This work was supported by the National Key Research and Development Program of China (2016YFD0200600,2016YFD0200601),the Key Research and Development Program of Hebei Province,China (19227407D);the Central Public-interest Scientific Institution Basal Research Fund (JBYW-AII-2020-29,JBYW-AII-2020-30);and the Technology Innovation Project Fund of Chinese Academy of Agricultural Sciences (CAAS-ASTIP-2020-AII).The authors wish to express heartfelt thanks to Yao Zhaosheng,Zhou Ping,Sun Yunian,Yang Jun,Sun Ruilin,Wu Fengfeng and Li Qinglu for data acquisition work,and to Wu Wei,Li Rui(Yangzhou University) for their kind help.
Declaration of competing interest
The authors declare that they have no conflict of interest.
杂志排行
Journal of Integrative Agriculture的其它文章
- Assessing the impact of non-governmental organization’s extension programs on sustainable cocoa production and household income in Ghana
- Food safety inspection and the adoption of traceability in aquatic wholesale markets:A game-theoretic model and empirical evidence
- Bacterial diversity and community composition changes in paddy soils that have different parent materials and fertility levels
- lncreased ammonification,nitrogenase,soil respiration and microbial biomass N in the rhizosphere of rice plants inoculated with rhizobacteria
- Regional distribution of wheat yield and chemical fertilizer requirements in China
- Changes in organic C stability within soil aggregates under different fertilization patterns in a greenhouse vegetable field