Regional distribution of wheat yield and chemical fertilizer requirements in China
2021-08-12XUXinpengHEPingCHUANLiminLIUXiaoyanLIUYingxiaZHANGJiajiaHUANGXiaomengQIUShaojunZHAOShichengZHOUWei
XU Xin-peng ,HE Ping ,CHUAN Li-min ,LIU Xiao-yan ,LIU Ying-xia ,ZHANG Jia-jia ,HUANG Xiaomeng,,QIU Shao-jun,ZHAO Shi-cheng,ZHOU Wei
1 Key Laboratory of Plant Nutrition and Fertilizer,Ministry of Agriculture and Rural Affairs/Institute of Agricultural Resources and Regional Planning,Chinese Academy of Agricultural Sciences,Beijing 100081,P.R.China
2 Institute of Information on Science and Technology of Agriculture,Beijing Academy of Agriculture and Forestry Sciences,Beijing 100097,P.R.China
3 Faculty of Resources and Environmental Science,Hubei University,Wuhan 430062,P.R.China
Abstract Quantification of currently attainable yield and fertilizer requirements can provide detailed information for assessing the food supply capacity and offer data support for agricultural decision-making.Datasets from a total of 5 408 field experiments were collected from 2000 to 2015 across the major wheat production regions in China to analyze the spatial distribution of wheat yield,the soil nutrient supply capacity (represented by relative yield,defined as the ratio of the yield under the omission of one of nitrogen (N),phosphorus (P) and potassium (K) to the yield under the full NPK fertilizer application),and N,P and K fertilizer requirements by combining the kriging interpolation method with the Nutrient Expert Decision Support System for Wheat.The results indicated that the average attainable yield was 6.4 t ha−1,with a coefficient of variation(CV) of 24.9% across all sites.The yields in North-central China (NCC) and the northern part of the Middle and Lower reaches of the Yangtze River (MLYR) were generally higher than 7 t ha−1,whereas the yields in Southwest China (SWC),Northeast China (NEC),and the eastern part of Northwest China (NWC) were usually less than 6 t ha−1.The precentage of area having a relative yield above 0.70,0.85,and 0.85 for N,P,and K fertilizers accounted for 52.3,74.7,and 95.9%,respectively.Variation existed in N,P,and K fertilizer requirements,with a CV of 24.8,23.9,and 29.9%,respectively,across all sites.More fertilizer was needed in NCC and the northern part of the MLYR than in other regions.The average fertilizer requirement was 162,72,and 57 kg ha−1 for N,P2O5,and K2O fertilizers,respectively,across all sites.The incorporation of the spatial variation of attainable yield and fertilizer requirements into wheat production practices would benefit sustainable wheat production and environmental safety.
Keywords:wheat,attainable yield,fertilizer requirements,nutrient expert system,spatial variation
1.Introduction
Wheat (TriticumaestivumL.) yield has been improved substantially in the past two decades in China,with a yield increment of 1.6 t ha−1(FAO 2018);however,there has also been a rapid increase in fertilizer input.Excessive fertilization has become a serious phenomenon driven by farmers’ desire to achieve high or super high yield.However,excessive fertilizer application has led to soil nutrient accumulation,low fertilizer use efficiency,and environmental pollution (Maet al.2016;Yanget al.2017).For most farmers,the N fertilizer application rate exceeds 250 kg ha−1,whereas recovery efficiency is usually less than 20% in the wheat season (Chuanet al.2013;Zhanget al.2018).Some studies were conducted to increase wheat yield and improve nutrient use efficiency but they were limited to a specific field or a certain nutrient (Varinderpal-Singhet al.2012;Wanget al.2012;Sapkotaet al.2014).However,these fertilizer recommendations were not helpful in other regions because fertilizer recommendation rates vary substantially with different climates,soil types,target yields,and soil nutrient supply,among other factors (Ichamiet al.2019;Zhanget al.2019).
For each climate or rotation system,the target yield and available nutrient supply from the soil must be considered for nutrient management.For example,relative yield,the ratio of the yield obtained by omitting one of the N,P and K nutrients to the yield under the full NPK fertilizer application,is used to reflect the soil nutrient supply and has been integrated into a nutrient management approach,i.e.,the Nutrient Expert Decision Support System for Wheat,which was proved to be successful to guide site-specific nutrient requirements for wheat production (Chuanet al.2013).However,for a larger scale nutrient management,the influence of planting time,fertilizer sources,soil mineralization rate,and other agronomic practices,which showed large variation in different regions,needs to be considered in wheat nutrient management (Zhanget al.2019).Therefore,a large number of field trials over great spatial span are necessary for robust estimations of nutrient requirements (Lobellet al.2009).
Spatial patterns of crop yield and soil nutrient supply can provide crucial information to devise agricultural strategies to achieve sustainable intensification (Van Ittersumet al.2013;Zhaoet al.2021).The determination of fertilizer requirements at a regional scale is needed for government to formulate agricultural policies regarding the allocation of fertilizer resources.However,a flexible method is also needed to overcome the challenge of fertilization in the form of small-holders.Large databases from field experiments are used to formulate nutrient recommendations,and many agricultural technicians have been trained to guide farmers with respect to fertilization,e.g.,using the Nutrient Expert Decision Support System (Xuet al.2014a,b;Zhanget al.2018) and Science and Technology Backyard (Zhanget al.2016;Cuiet al.2018).
Land managers want to estimate production capacity and fertilizer requirements spatially so that they can determine where fertilizer inputs can be reduced.A combination of geostatistical analysis and fertilization recommendation systems offers a solution for regional nutrient management and will help people more thoroughly understand the behavior of agricultural economic activities and the direction of agricultural development.Spatial distribution maps can be used by government regulators and agricultural scientists to estimate the potential economic yield and provide reference materials for agronomic policy decisions (Robertsonet al.2008;Gaoet al.2011;Vasuet al.2017).
In the present study,a regional fertilizer recommendation method was proposed to map the spatial variability of fertilizer requirements by combining the kriging interpolation method of a geographic information system with the Nutrient Expert Decision Support System for Wheat across the main wheat production regions in China.The objectives of this study were to map and evaluate the spatial distribution of yield,soil nutrient supply,and fertilizer requirements across the major wheat production regions of China.
2.Materials and methods
2.1.Data collection
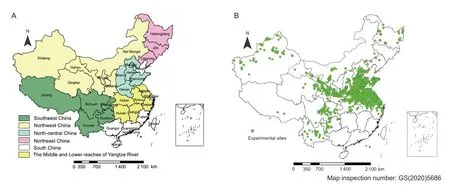
Datasets in this study were compiled from the International Plant Nutrition Institute and published journal articles in the database of China National Knowledge Infrastructure (www.cnki.net).Data from a total of 5 408 field experiments were collected from 2000 to 2015,which were conducted on a wide range of wheat farms across in China (Fig.1-B).The datasets contained various wheat varieties under optimal nutrient management,and a series of nutrient (N,P or K)omission treatments.
2.2.Study area
The study areas were located in five regions divided according to diverse geographical,climate conditions and the administrative divisions of China (Fig.1-A),i.e.,Northeast China (NEC),North-central China (NCC),Northwest China (NWC),the Middle and Lower reaches of the Yangtze River (MLYR) and Southwest China (SWC).Winter wheat is mainly planted in the NCC,MLYR and SWC.For winter wheat rotated with summer maize in the NCC under a temperate climate,the dominated soil types are mainly fluvo-aquic soil,cinnamon soil,and brown earth,with precipitation ranging from 350 to 700 mm.Winter wheat is primarily rotated with summer maize or rice in the MLYR and SWC under a temperate and subtropical humid climate.The main soil types in the MLYR are fluvo-aquic soil and paddy soil with a range of precipitation from 750 to 1 700 mm.However,red earth,yellow earth,and purplish soil are found in the SWC,with a range of precipitation from 600 to 1 400 mm.Spring wheat planted in the NEC and NWC are characterized with a mono-cropping system under cool temperature.In the NEC,soil types are mainly black soil with a range of precipitation from 450 to 1 000 mm,and in the NWC,wheat is cultivated in loessial soil and fluvo-aquic soil,with a range of precipitation from 100 to 450 mm.

Fig.1 Region division (A) and distribution of wheat experimental sites (B).
2.3.Nutrient Expert Decision Support System for Wheat
The Nutrient Expert Decision Support System for Wheat is a computer software which was developed based on a large number of field trials of wheat by analyzing the relationship among agronomic parameters,such as relative yield,agronomic efficiency,soil nutrient supply,and yield responses to N,P and K fertilizer application.The combination of site-specific nutrient management principles with 4R (right source,right rate,right time and right place)nutrient stewardships was advocated to determine the fertilizer requirement for specific fields.The Nutrient Expert Decision Support System was designed to make fertilizer recommendation by asking some simple questions,which can be answered from existing information for a field or recommendation domain by farmers or local agricultural technicians (Pampolinoet al.2012;Chuanet al.2013;Xuet al.2014a,2017).
In the Nutrient Expert Decision Support System,the determination of fertilizer N requirements was estimated by the relationship between an expected yield response and targeted agronomic efficiency which was established based on the large databases from field experiments across different climate conditions and under different agronomic practices.The yield response is the yield gap between the full NPK treatment and a series of nutrient (N,P or K)omission treatments.The determination of fertilizer P and K requirements considers internal nutrient efficiency combined with estimates of nutrient balance and yield responses to the added nutrient within specific field.The relative yield is the ratio of the yield obtained under the nutrient omission treatment to the yield obtained under the full NPK treatment;The 25th,50th,and 75th percentiles were selected to determine the soil nutrient supply,representing high,medium and low levels of yield response value,respectively,when yield response was not available from field experiments.Yield response is inversely correlated with relative yield and the soil nutrient supply capacity under specific climate and soil conditions (Pampolinoet al.2012;Chuanet al.2013).The attainable yield was estimated by the yield obtained from the full NPK fertilizer treatment in each field experiment.The formulas for determining fertilizer N,P and K requirements are as follows:

where YR is the yield increase (kg ha−1) in response to N,P,or K fertilizer application;Yais the attainable yield with the full NPK fertilizer application (kg ha−1);AENis agronomic efficiency with respect to N fertilizer application (kg kg−1),and the relationship with yield response was calculated based on the database obtained from the field experiments;RIEPand RIEKare the reciprocal internal efficiencies of P and K which are calculated as the P and K nutrient uptake,respectively,by aboveground dry matter per tonne of grain yield of wheat(kg t−1);REPand REKare the recovery efficiencies of P and K fertilizer application,respectively;HI is the nutrient harvest index based on the ratio of grain yield to above-ground dry matter;XGand XSare the proportion of nutrients from grain and straw that need to be returned to the soil to maintain the respective soil P and K balance,respectively.
2.4.Spatial analysis
This study assumed that all wheat straw was incorporated into the soil after harvest when calculating fertilizer requirements.To obtain a robust estimation and reduce errors when analyzing spatial variation,study areas with only a few or no experimental sites were removed.The wheat-growing area was identified from optical remote sensing images by analyzing land cover classification,and attainable yield,relative yield,and fertilizer requirements for each study area were calculated by an area-weighted average to reflect the actual production situation.The software of GS+5.3 (Plainwell,Michigan,USA) was adopted to determine a semi-variogram model.An exponential model was selected for analysis of attainable yield,relative yield to K fertilizer application,and NPK fertilizer requirements,and a spherical model was selected for analysis of relative yield to N and P fertilizer application.Nugget/sill and range were used to select the semi-variogram model (Table 1).ArcGIS 9.3 Software (ESRI,Redlands,USA) was adopted to map the distribution of attainable yield,relative yield and fertilizer requirements using universal kriging interpolation (Brus and Heuvelink 2007;Liet al.2015).The root mean square error and normalized root mean square error were selected for cross validation to evaluate the kriging interpolation results (Table 1).The definition used for the coefficient of variation (CV) was the ratio of the standard deviation to the mean value,which was adopted to measure the variability of attainable yield,relative yield and fertilizer requirements among and within regions.
3.Results
3.1.Spatial distribution of wheat yield
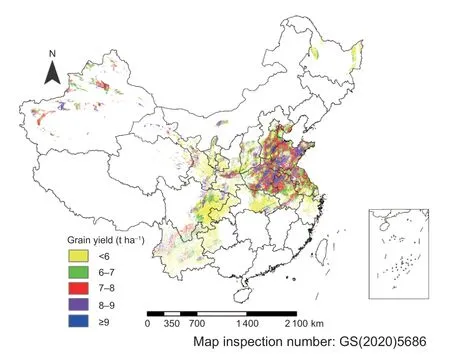
On average,the attainable yield was 6.4 t ha−1which showed clear spatial variations with a CV of 24.9% across all study sites.The attainable yield values were 5.1,6.5,7.2,5.5,and 6.4 t ha−1,with CVs of 24.4,27.4,17.3,26.8,and 22.1% for the NEC,NWC,NCC,SWC,and MLYR,respectively.High CVs were observed in the non-irrigated(NEC and NWC) and high precipitation areas (SWC).The distribution of attainable yield in the ranges of <6,6–7,7–8,8–9,and ≥9 t ha−1accounted for 38.0,24.2,23.4,10.5,and 3.9% of the study area,respectively (Fig.2).Lower yields(less than 6 t ha−1) were primarily concentrated in the NEC,eastern NWC,eastern SWC,and southern MLYR,whereas high-yield production (more than 9 t ha−1) mainly occurred in the NCC and the northern part of the MLYR,where winter wheat and summer maize were planted.

Fig.2 Spatial distribution of wheat yield.
3.2.Spatial distribution of the relative yield
The average relative yield to N application (RYN) was 0.69 with a CV of 14.7% across all sites (Table 2).The CVs of RYNwere 10.1,14.2,10.6,14.5,and 18.7% for the NEC,NWC,NCC,SWC,and MLYR,respectively.The RYNvalues within the ranges of <0.5,0.5–0.6,0.6–0.7,0.7–0.8,and 0.8–1.0 accounted for 4.8,11.1,31.8,41.8,and 10.5% of the study area,respectively (Fig.3-A).High RYNwas observed mainly in the middle and southern NCC and southern SWC,whereas low RYN(less than 0.6) was mainly observed inthe eastern MLYR (Jiangsu and Zhejiang) and northeastern SWC (Sichuan and Chongqing).

Table 1 Model selection and cross validation for attainable yield (t ha−1),relative yield,and fertilizer requirements (kg ha−1)
The distribution of relative yield to P application (RYP)showed a 5.9% variation,with an average of 0.86 across all sites (Table 2).RYPwithin the ranges of <0.75,0.75–0.80,0.80–0.85,0.85–0.90,and 0.90–1.00 accounted for 1.2,2.0,22.1,64.9,and 9.8% of the study area,respectively(Fig.3-B).An RYPless than 0.85 was mainly observed in the eastern part of the MLYR and northeastern part of SWC,whereas high RYP(above 0.90) was mainly observed in the middle part of NCC and western part of NWC.
The CV of the relative yield to K application (RYK) was only 5.4% across all sites (Table 2).There was a similar RYKamong regions,with an average of 0.89 across all of the sites.RYKwithin <0.75,0.75–0.80,0.80–0.85,0.85–0.90,and 0.90–1.00 accounted for 0.9,0.5,2.7,51.2,and 44.7% of the study area,respectively (Fig.3-C).An RYKless than 0.85 was mainly observed in the southern part of SWC and MLYR.
3.3.Spatial distribution of chemical fertilizer requirements
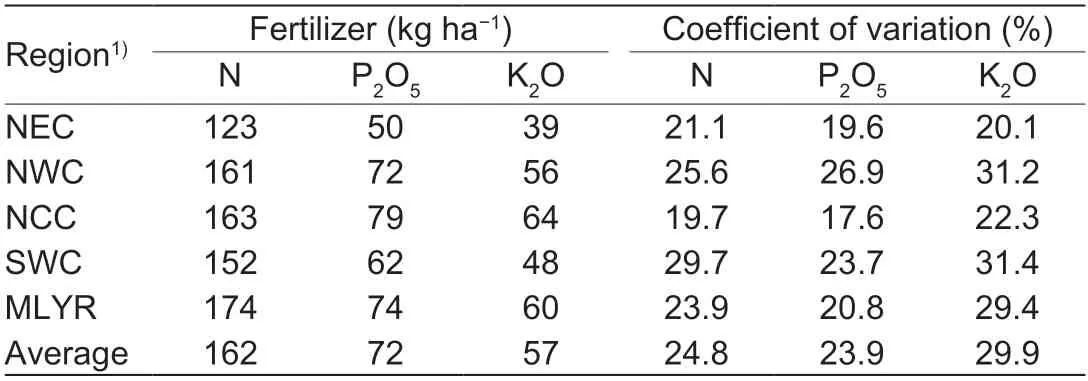
High variation existed among areas with respect to N fertilizer requirement (24.8% variation),with a mean of 162 kg ha−1across all study sites.The CVs for the NEC,NWC,NCC,SWC,and MLYR were 21.1,25.6,19.7,29.7,and 23.9%,respectively (Table 3).The highest N fertilizer requirement was found in the MLYR with a mean of 174 kg ha−1,whereas the lowest value was in the NEC,i.e.,123 kg ha−1.N fertilizer requirement in the ranges of 60–120,120–140,140–160,160–180,and ≥180 kg ha−1accounted for 13.3,14.8,24.3,21.4,and 26.2% of the study area,respectively(Fig.4-A).High N fertilizer requirements were concentrated in the NCC and northern part of MLYR.An average of 175 kg N ha−1was needed to reach a Yavalue of 8.0 t ha−1.Low N fertilizer requirements (<140 kg ha−1) were mainly observed in the NEC,eastern part of NWC,and SWC.
On average,the P fertilizer requirement (P2O5) was 72 kg ha−1,with a variation of 23.9%.A large variation was observed in the P fertilizer requirement across all sites,and CVs of 19.6,26.9,17.6,23.7,and 20.8% were obtained for the NEC,NWC,NCC,SWC,and MLYR,respectively(Table 3).P fertilizer requirements in the ranges of 35–60,60–70,70–80,80–90,and ≥90 kg ha−1accounted for 24.7,22.3,22.7,17.5,and 12.8% of the study area,respectively(Fig.4-B).A high P fertilizer requirement was concentrated in the NCC,whereas a low P fertilizer requirement (50 kg ha−1) was found in the NEC.The average P fertilizer requirement reached 94 kg ha−1when Yaexceeded 8 t ha−1.A low P fertilizer requirement (<60 kg ha−1) was mainly observed in the eastern part of NWC,eastern and southern parts of SWC,NEC,and southern part of MLYR.
The average K fertilizer requirement (K2O) was 57 kg ha−1,with a CV of 29.9% across all sites,compared with the CVs of 20.1,31.2,22.3,31.4,and 29.4% for the NEC,NWC,NCC,SWC,and MLYR,respectively (Table 3).Fertilizer K requirements in the ranges of 20–40,40–55,55–70,70–85,and ≥85 kg ha−1accounted for 14.5,32.4,33.2,15.1,and 4.8% of the study area,respectively (Fig.4-C).The sites with high K fertilizer requirements were mostly located in the high-yielding production regions,such as the NCC(64 kg ha−1) and MLYR (60 kg ha−1) (Table 3).The average K fertilizer requirement was 80 kg ha−1when Yareached 8 t ha−1.A low K fertilizer requirement (<40 kg ha−1) was mainly observed in the NEC,eastern part of NWC,and northeastern part of SWC.

Table 2 Average relative yield and coefficient of variation within five regions in China

Table 3 Average chemical fertilizer requirements and coefficient of variation within five regions in China

4.Discussion
The estimation of attainable yield using large numbers of field experiments is more representative at a regional scale than that based on specific sites to aid agricultural scientists and government policy makers.Worldwide wheat production could increase by 71%under 100% Ya(Muelleret al.2012);the global aggregated yield gap is 43% of the actual frontier global wheat production (Neumannet al.2010).Quantifying attainable yield in a consistent and transparent manner is necessary to inform on-ground actions for local farmers by analyzing the yield gap between optimal crop management and farmers’ practices (Van Ittersumet al.2013).There is room to increase wheat yield in China,as identified in the current study.The average wheat yield (6.4 t ha−1) across all areas in this study was 18.5% higher than that obtained under farmers’ current practices (5.4 t ha−1;FAO 2018).Resistant varieties,optimal nutrient management,tillage practices,and water management have been adopted to increase wheat yield (Shiet al.2016;Fanget al.2017;Yinget al.2017).In addition,other management measures,such as planting density and fertilizer sources,have been integrated into technical operations to maintain a high and sustainable yield level(Deihimfardet al.2015;Wanget al.2015).Significant variation was observed in attainable yield among areas;the highest yield,which was observed in the NCC and northern MLYR,was mainly due to a temperate climate with favorable sunlight and heat resources(Yanget al.2014;Zhanget al.2017) compared to the temperate and subtropical humid climates with high rainfall in the SWC and southern MLYR and the cool temperature climate in the NEC and NWC with spring wheat and no irrigation.
Chemical fertilizer is an indispensable part of agricultural production,and application rates have greatly increased in the past three decades.While excessive fertilizer application has led to fertilizer waste and negative environmental effects,it has also resulted in soil nutrient accumulation and low nutrient use efficiency(Liuet al.2011;Yanget al.2017).For example,in the NCC,279 kg ha−1of N and 119 kg ha−1of P2O5were applied by farmers during the wheat season (Zhanget al.2018),which resulted in N accumulation(200 kg N ha−1) at a soil depth of 0–90 cm after wheat harvesting (Xuet al.2014b),and the soil indigenous N and P2O5supplies reached 149.0 and 74.0 kg ha−1,respectively (Liuet al.2011).Yield without fertilization has gradually increased,and the yield gap with respect to attainable yield has been constantly narrowing (Xuet al.2015),which indicates that yield increase due to fertilizer application is declining.

The soil indigenous nutrient supply capacity can be expressed by relative yield.A higher relative yield indicates a higher soil indigenous nutrient supply,andvice versa(Chuanet al.2013;Xuet al.2014a).In this study,relative yield in the NEC,NCC,and northern MLYR was higher than that in the SWC and southern MLYR,mainly due to the high fertility of black soil in the NEC.Moreover,a higher fertilizer application rate led to higher soil nutrient accumulation in the NCC and northern MLYR with a winter wheat and summer maize system,while high precipitation resulted in soil nutrient losses in the SWC and southern MLYR.To eliminate the influence of attainable yield from agricultural practices on relative yield,the attainable yield under the full NPK fertilizer were adopted in each experiment to calculate relative yield and to analyze spatial heterogeneity to reflect the true soil nutrient supply capacity.
The diversity of climate and soil type brings huge nutrient management challenges for smallholder farmers in China.The Nutrient Expert Decision Support System for Wheat was adopted to calculate fertilizer requirements for each site.This method enabled users to tailor fertilization strategies based on specific fields or growing environments,and the results proved that the Nutrient Expert Decision Support System for Wheat is a promising fertilizer recommendation approach (Chuanet al.2013;Zhanget al.2018).In the current study,significant variations were observed in N,P,and K fertilizer requirements,with CVs of 24.8,23.9,and 29.9%,respectively.There was a higher N fertilizer requirement in the MLYR than in other areas due to high yield and low relative yield in Jiangsu and Anhui provinces (Figs.2 and 3-A),and greater N loss occurred in the southern than in the northern areas (Juet al.2009).Therefore,optimal nutrient management practices,such as increasing topdressing times and control-release fertilizer application,are necessary in these areas with high precipitation.The average N,P2O5,and K2O fertilizer requirements across all sites were 162,72,and 57 kg ha−1,respectively,whereas corresponding amounts of 175,94,and 80 kg ha−1were needed to achieve a Yavalue of 8 t ha−1.Some studies showed that 160–180 kg N ha−1was necessary to meet crop growth depending on yield and environmental conditions (Luet al.2015;Wanget al.2017).The amount of N and P fertilizer applied can be reduced by 30–40% based on the optimal nutrient management rather than farmers’ practices reported by Liuet al.(2011) and Zhanget al.(2018),especially in the NCC,which has the highest potential for fertilizer reduction.Although the K fertilizer rate in the current study was based on the premise that all straw was incorporated into the soil,in fact,partial or no straw was returned in some areas,such as in the NEC and NWC.K fertilizer rates would increase by 30–60% relative to the current recommended rate according to the amount of straw returned to the soil based on the Nutrient Expert Decision Support System for Wheat to ensure a sufficient soil K supply.
The Chinese government announced a National Key Research and Development Program in the 13th Five-Year Plan to control chemical fertilizer consumption and increase fertilizer use efficiency by 2020.However,technical training and extension efforts are facing another challenge due to the absence of young agricultural laborers in the countryside.Whether farmers are willing to control the fertilizer application rate largely depends on their knowledge,national policies,and market prices (Brissonet al.2010;Cuiet al.2018).Studies have shown that knowledge and training in field guidance may have a significant effect on the reduction in fertilizer use,by an average of 17% (Panet al.2017).Information on the spatial distribution of attainable yield and chemical fertilizer requirements will enable leaders and agricultural technicians to make decisions with omnidirectional and macroscopic information.More importantly,the introduction of advanced and integrated agronomic techniques is essential to promote the development of sustainable agriculture in China.Agricultural scientists have taken a series of steps to tackle the over-fertilization problem by providing optimization schemes,technical services,and more convenient fertilization methods for farmers,such as soil testing and formulated fertilization,the Nutrient Expert Decision Support System,and Science and Technology Backyard.Those measures will assist in developing modern agriculture and promote the development of a new countryside in China.
5.Conclusion
Spatial variations were observed in attainable yield and fertilizer requirements across the main wheat production regions in China.Higher yields were observed in the NCC and northern MLYR than in other areas.Relative yield was integrated into the fertilizer recommendation method.The fertilizer requirements in the NEC,NWC,NCC,SWC,and MLYR were 123,161,163,152,and 174 kg ha−1,respectively,for N,50,72,79,62,and 74 kg ha−1,respectively,for P2O5,and 39,56,64,48,and 60 kg ha−1,respectively,for K2O.There is high potential to decrease the fertilization rate,particularly in the NCC and MLYR.The strategies used to address unreasonable fertilization need to consider both regional and site-specific conditions.Information from the current study provides theoretical support for estimating the food production capacity and predicting fertilizer requirements at a regional scale for farm managers and policy makers.
Acknowledgements
This research was supported by the National Key R&D Program of China (2016YFD0200101),the National Natural Science Foundation of China (31801938).We are grateful to the local researchers for their help in this study.
Declaration of competing interest
The authors declare that they have no conflict of interest.
杂志排行
Journal of Integrative Agriculture的其它文章
- Assessing the impact of non-governmental organization’s extension programs on sustainable cocoa production and household income in Ghana
- Triple bottom-line consideration of sustainable plant disease management:From economic,sociological and ecological perspectives
- A rice geranylgeranyl reductase is essential for chloroplast development
- lmpacts of climate change on drought risk of winter wheat in the North China Plain
- Rapid determination of leaf water content for monitoring waterlogging in winter wheat based on hyperspectral parameters
- Does nitrogen application rate affect the moisture content of corn grains?
