A Positivity-preserving Conservative Semi-Lagrangian Multi-moment Global Transport Model on the Cubed Sphere
2021-07-26JieTANGChungangCHENXueshunSHENFengXIAOandXingliangLI
Jie TANG ,Chungang CHEN ,Xueshun SHEN ,Feng XIAO ,and Xingliang LI*
1National Meteorological Center/Center of Numerical Weather Predication,China Meteorological Administration,Beijing 100081,China
2State Key Laboratory for Strength and Vibration of Mechanical Structures & School of Aerospace Engineering,Xi’an Jiaotong University,Xi’an 710049,China
3Department of Mechanical Engineering,Tokyo Institute of Technology,Tokyo 152-8850,Japan
ABSTRACT A positivity-preserving conservative semi-Lagrangian transport model by multi-moment finite volume method has been developed on the cubed-sphere grid.Two kinds of moments (i.e.,point values (PV moment) at cell interfaces and volume integrated average (VIA moment) value) are defined within a single cell.The PV moment is updated by a conventional semi-Lagrangian method,while the VIA moment is cast by the flux form formulation to assure the exact numerical conservation.Different from the spatial approximation used in the CSL2 (conservative semi-Lagrangian scheme with second order polynomial function) scheme,a monotonic rational function which can effectively remove non-physical oscillations is reconstructed within a single cell by the PV moments and VIA moment.To achieve exactly positive-definite preserving,two kinds of corrections are made on the original conservative semi-Lagrangian with rational function (CSLR)scheme.The resulting scheme is inherently conservative,non-negative,and allows a Courant number larger than one.Moreover,the spatial reconstruction can be performed within a single cell,which is very efficient and economical for practical implementation.In addition,a dimension-splitting approach coupled with multi-moment finite volume scheme is adopted on cubed-sphere geometry,which benefitsthe implementation of the 1D CSLR solver with large Courant number.The proposed model is evaluated by several widely used benchmark tests on cubed-sphere geometry.Numerical results show that the proposed transport model can effectively remove nonphysical oscillations and preserve the numerical nonnegativity,and it has the potential to transport the tracers accurately in a real atmospheric model.
Key words:global transport model,cubed-sphere grid,multi-moment method,single-cell-based scheme,conservative semi-Lagrangian method
1.Introduction
Global advection transport describes the motion of various passive tracers in the atmosphere,which is a basic process in atmospheric dynamics.The advection transport model is important in developing general circulation models (GCMs).The traditional latitude-longitude grid is very easy for application but has singularities at the poles.Moreover,its nonuniform grid system would also seriously affect computational efficiency.To address these issues,quasi-uniform grid systems without singularities or with weak singularities,such as the cubed-sphere grid,Yin-Yang grid,and icosahedral grid are becoming more and more popular in developing global transport models.Among those grids,the cubed-sphere grid is usually preferred due to its computational merits,such as locally structured grid and quasi-uniform grid.Recently,many transport models have been developed on the cubed-sphere grid,such as the discontinuous Galerkin transport models (Nair et al.,2005;Guo et al.,2014,2016),the conservative semi-Lagrangian multitracer (CSLAM) model (Lauritzen et al.,2010),the finite volume transport model (Norman and Nair,2018),and the multi-moment transport models (Chen et al.,2011;Tang et al.,2018).In this study,the cubed-sphere grid with gnomonic projection is adopted for our transport model.
The semi-Lagrangian method is a popular choice for developing a global transport model,since it allows a large time step without reducing accuracy.The traditional semi-Lagrangian method defines a set of parcels that arrive at the Euler computational grid at every time step,and then these parcels are traced back to find their departure locations at the previous time step.A review of the semi-Lagrangian method can be seen inStaniforth and Côté (1991).However,the traditional semi-Lagrangian method has a serious shortcoming regarding mass conservation.To deal with this,many efforts have been made to develop the conservative semi-Lagrangian method.The finite-volume semi-Lagrangian (FVSL) method is a popular one which can be probably separated into two categories (departure volume based and flux form based).The departure volume based FVSL method initially finds the departure volume and then remaps the departure volume from the given Euler computational grid.Examples of using this method can be seen inNair and Machenhauer (2002),Nair et al.(2002),Zerroukat et al.(2002),andLauritzen et al.(2010).The flux form based FVSL method calculates the flux traveling across the interfaces of a cell and uses a flux form formulation to update.Lin and Rood (1996)is a typical example of this kind.
Nakamura et al.(2001)proposed a flux-form FVSL method based on their previous Constrained Interpolation Profile (CIP) scheme (Yabe and Aoki,1991),calling it CIPCSL.In their method,the point values at cell boundaries and the cell-averaged value are used to reconstruct the piecewise interpolation profile.The point values are updated by the semi-Lagrangian approach,while the cell-average or volume-average values are calculated by the flux-form formulation.The semi-Lagrangian approach permits a large time step,and the flux-form formulation of updating cell-average values makes the scheme inherently conservative in terms of cell-integrated average values.Xiao and Yabe(2001)introduced a slope limiter in the CIP-CSL scheme to suppress oscillations around discontinuities,but the stencil for spatial reconstruction extended from one cell to three cells.Instead of the cubic polynomial function used in CIPCSL2,Xiao et al.(2002)utilized a rational interpolation as an alternative,calling it the CSLR scheme,which used only one cell as stencil to reconstruct the interpolation function and could remove nonphysical oscillations simultaneously.However,this scheme can’t completely preserve positivity.In this paper,we make some modifications on the CSLR scheme to make it non-negative and extend it to the cubedsphere grid to develop a global transport model.
The paper is organized as follows.In section 2,we introduce the algorithm of the CSLR method and its modifications on the Cartesian geometry.In section 3,we extend this formula to the cubed-sphere grid.Section 4 presents several kinds of benchmark tests to evaluate the performance of the proposed global transport model.And a brief summary is given in section 5.
2.CSLR methods on Cartesian geometry
2.1.CSLR method in one dimension
2.1.1.Spatial reconstruction
To reconstruct the spatial approximation profile,two kinds of moments are introduced in each cell,as illustrated inFig.1.Point value (PV) moments at cell boundaries and the volume integrated average (VIA) moment in Ci(i=1,2,...,N) are defined as:
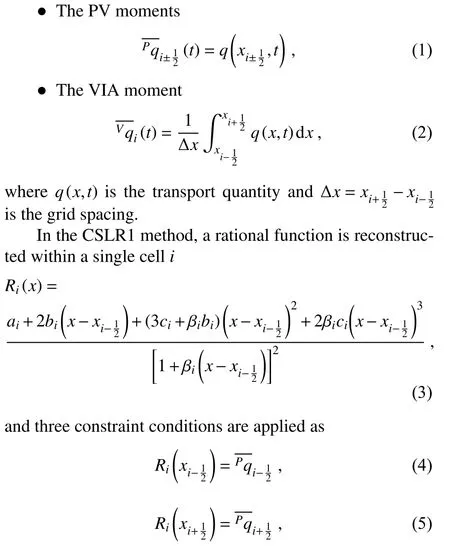
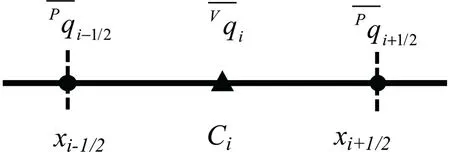
Fig.1.Illustration of moments in one dimension.

after which the coefficients can be determined as

where βiis predetermined in Eq.(3) [seeXiao et al.(2002)for details],γi=1+βi∆x,and ε is a very small number,such as ε=1×10⁻²⁰,for avoiding a zero denominator in Eq.(10).
2.1.2.Moments updating
Consider the following one-dimensional transport equation,

whereuis the velocity.
● Updating the PV moments:
The PV moments are updated by the traditional semi-Lagrangian approach.Rewriting Eq.(11) in an advection form gives

and it can be viewed as an advection equation plus a source term,−q∂u/∂x.The advection part is calculated by the semi-Lagrangian concept
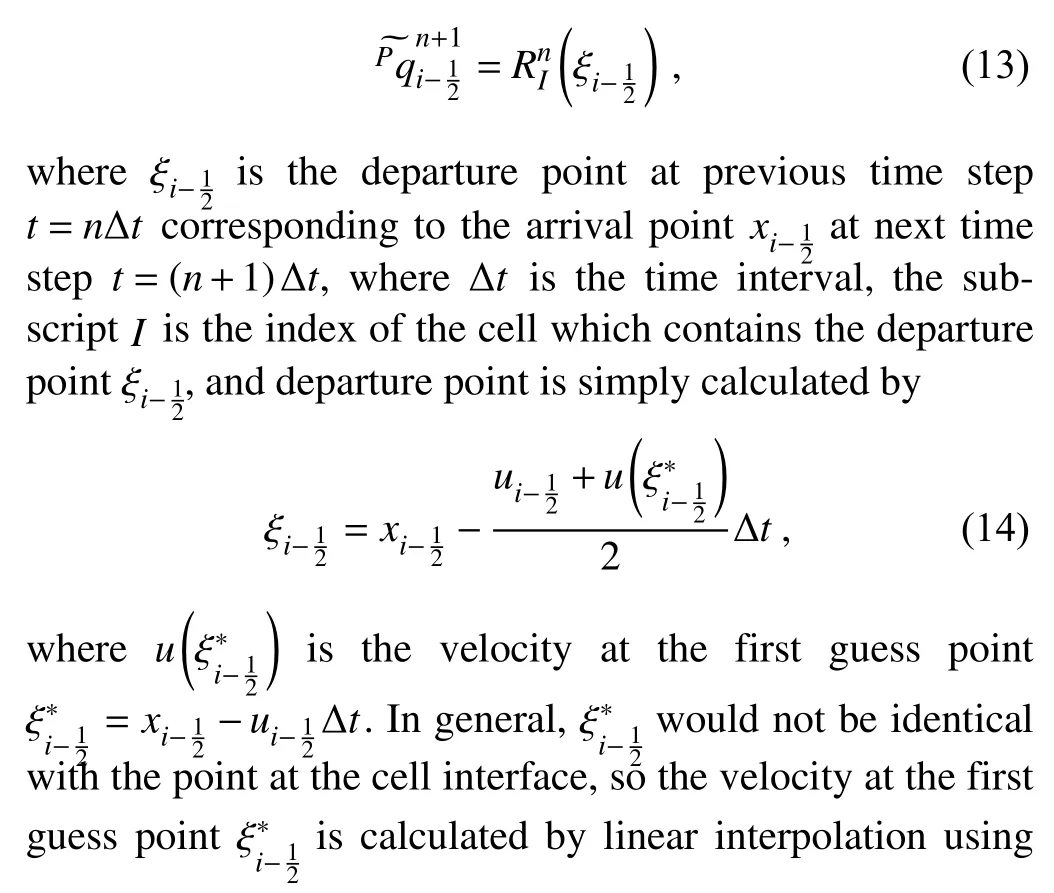

2.1.3.Modifications for positivity preserving
Preserving the positivity of certain physical quantities requires that the minimum valueqminshould not be less than zero.However,the point values calculated by Eq.(15) may produce negative values.Since the conservation of the PV moment is not required in the context of the multi-moment finite volume scheme,an easy and effective modification for the PV moments is used:

Despite this modification,in the specific case when a“valley” shape near the lower boundary is transported,the negative values may still appear.As illustrated inFig.2,if the PV moments at the cell boundary are bigger than the VIA moment,the reconstructed rational function would produce “undershoots”.Thus,a further modification of the approximation profile is needed:

Fig.2.Illustration of the rational reconstruction when a“valley” is advected.

whereqmaxis the maximum value of transport quantity and ε is a small parameter,such as ε=10−3.It should be noted that the modification of Eq.(19) can guarantee the spatial approximation profile is above zero,and by using the fluxform formula of VIA moment we can obtain an absolutely positive result.Therefore,after utilizing these two modifications the numerical result can strictly preserve positivity.
In this paper,the scheme using Eq.(3) for spatial reconstruction is called CSLR1,and the scheme with two-step modifications is called CSLR1-M hereafter.When β=0 in Eq.(3),the scheme reduces to CSL2 (Yabe et al.,2001).
Given the known PVs and VIAs at the previous time step,the CSLR1-M algorithm updating procedure can be summarized as follows:
1) Using Eq.(3) and the modification of Eq.(19),the reconstructed profile within each cell can be determined.
2) Point values are updated by Eq.(13) and Eq.(15).
3) Cell-averaged values are updated by Eq.(16).
4) Modifying the PV moments by Eq.(18) ensures positive PV moments at next time step.
It is noted that given the monotonicity of rational function and the PVs at cell boundaries as predicted variables,the CSLR1-M scheme can easily facilitate a positive-preserving property,as shown in this paper.
2.2.CSLR methods in two dimensions
A second order Strang dimension-splitting time-stepping (Strang,1968) technique is adopted to extend the 1D algorithm to the two-dimensional Cartesian case.For the sake of simplicity,we collectively define the 1D CSLR1 and CSLR1-M algorithm as
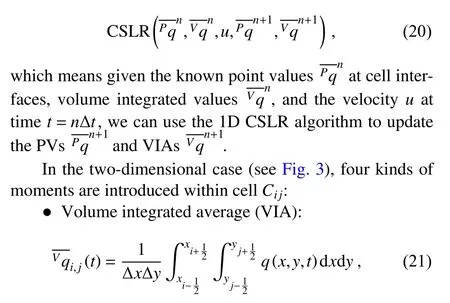
where ∆xand ∆yare grid spacing in thex- andy-directions,respectively.
● Point value (PV):four point-values located at vertices

● Line-integrated average values along-direction

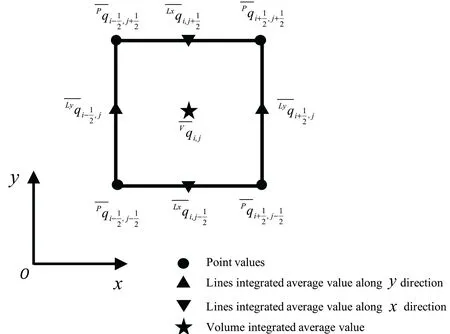
Fig.3.Illustration of moments defined in a two-dimensional case.
● Line-integrated average value alongy-direction

Consider the two-dimensional transport equation in the Cartesian coordinates:

whereuandvare the velocity in thex- andy-directions,respectively.
By using the dimension-splitting technique,the transport Eq.(25) is split into two 1D equations:


3.Extension to the cubed-sphere grid
In this section,we extend the proposed scheme to the cubed-sphere grid to develop a global transport model.The quasi-uniform cubed-sphere grid (Sadourny,1972) with equiangular central projection is adopted in this paper,as shown inFig.4,which has six identical cube faces with local coordinate (α,β)=[−π/4,π/4].It is worth mentioning that the conventional tropic-belt arrangement (Nair et al.,2005) is used in this paper although the staircase arrangement (Chen,2021) is a good interlock pattern which has better symmetry for patch information exchange.The two-dimensional transport equation in local coordinates can be written as

As shown inFig.5,we divided the cubed-sphere grid into three directions (ξ,η,ζ),and Eq.(28) is split into three sequential 1D equations along three directions (Guo et al.,2014):


Fig.4.Schematic of a cubed-sphere grid with 1 2×12×6 meshes.
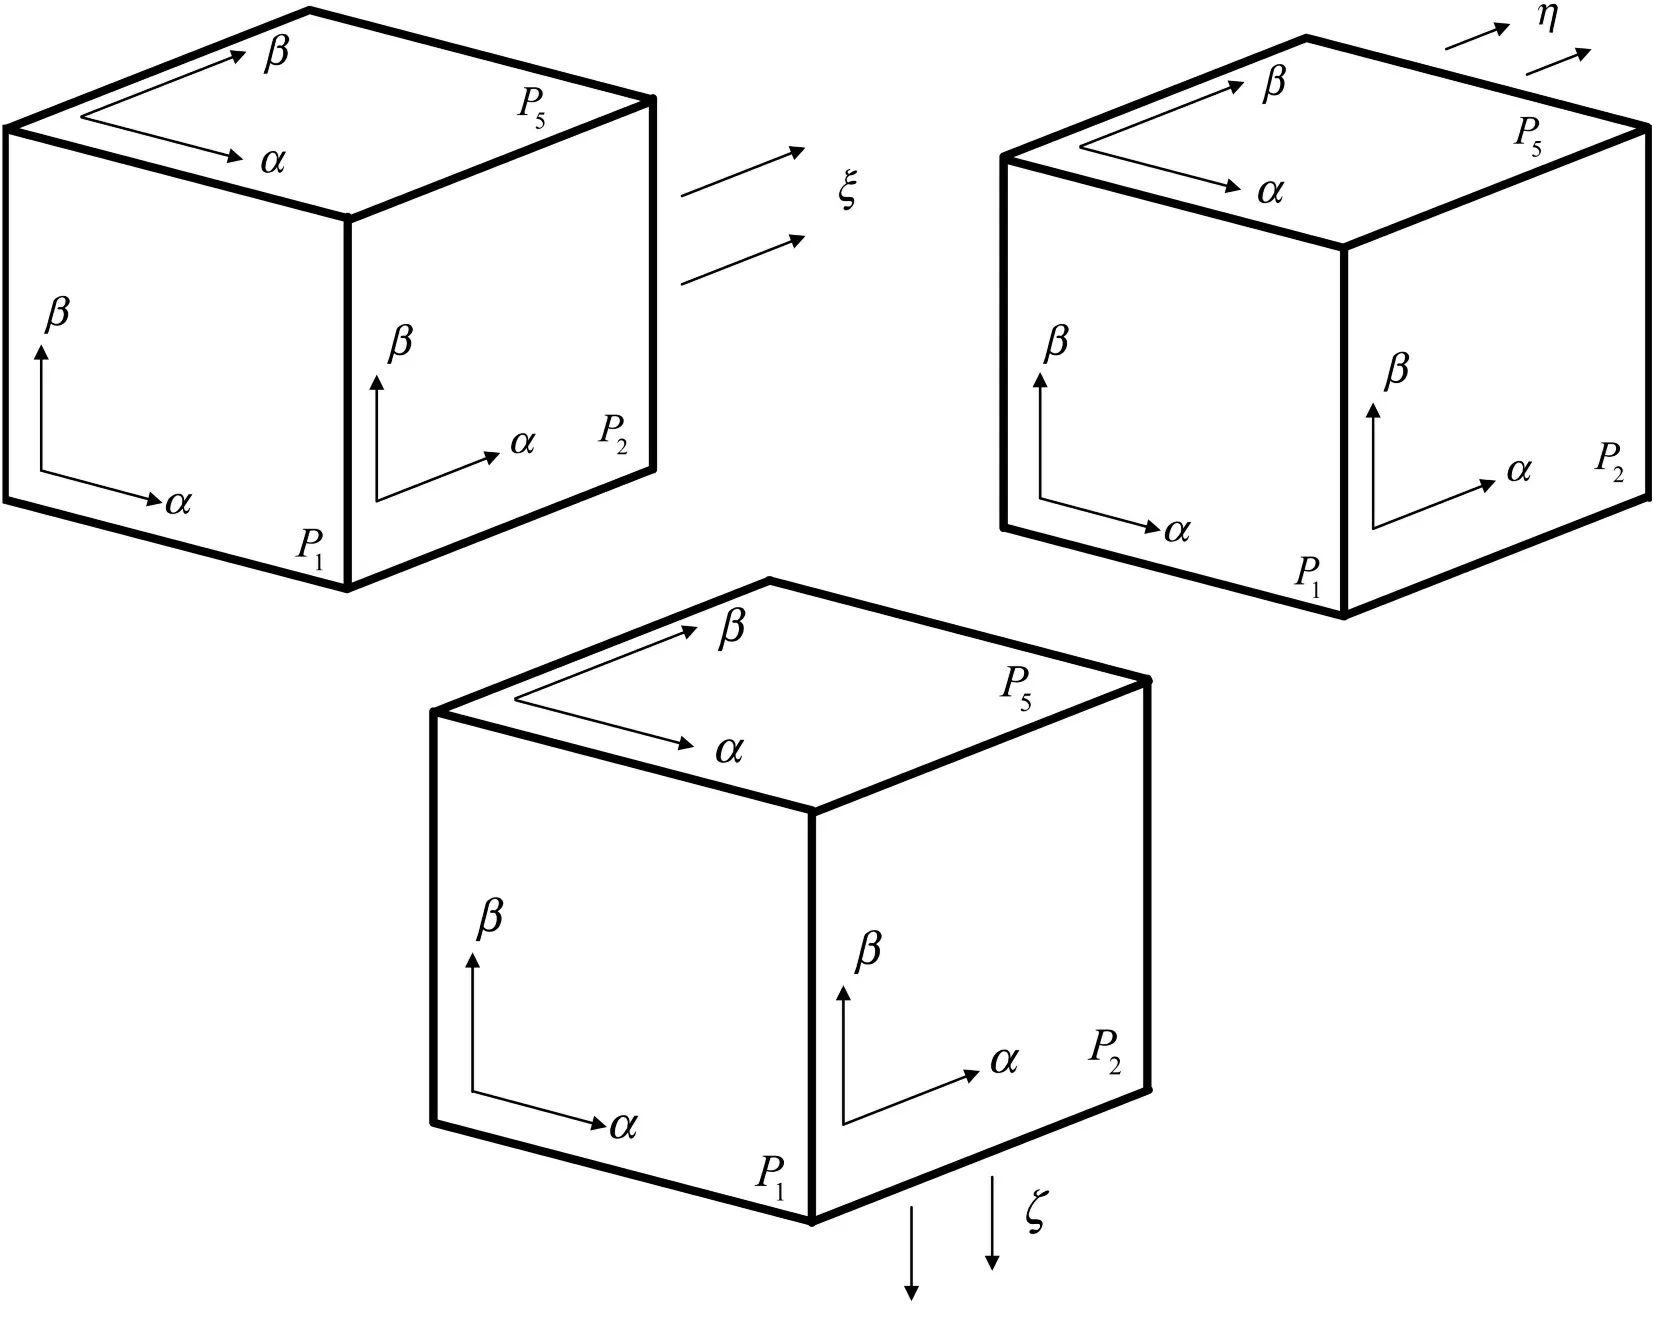
Fig.5.Schematic for three directions on the cubed-sphere grid.Top left is the ξ-direction along the αdirection on Patch 1,Patch 2,Patch 3,and Patch 4;Top right is the η-direction along the β-direction on Patch 1,Patch 3,Patch 5,and Patch 6;bottom is the ζ-direction along the β-direction on Patch 2 and Patch 4 and along the α-direction on Patch 5 and Patch 6.

whereUξ,Uη,andUζare the velocity along ξ -,η-,and ζ-directions,respectively.
Then,the numerical solutions are updated by the splitting algorithm.In each direction,the moments are updated by the one-dimensional algorithm,similar to the case in the two-dimensional Cartesian geometry.Given the known point values,line-integrated values,and cell-integrated values,the final updating procedures on a sphere for a time step ∆tare summarized as follows:
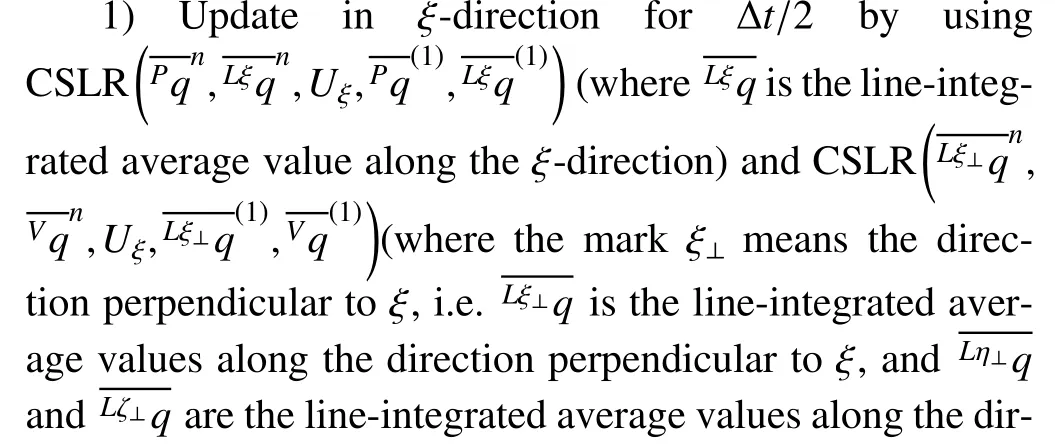
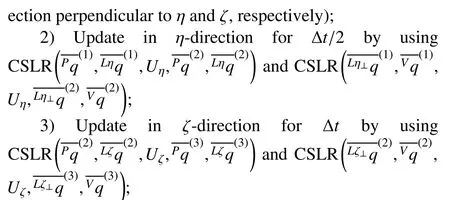
4) Update in η-direction for another ∆t/2 as in step 2;
5) Update in ξ-direction for ∆t/2 as in step 1.
Note that the cubed-sphere grid is not continuous across the cube patch boundaries,and some special treatments are needed.In Eq.(14),if the first guess pointmoves across the cube patch boundary,we first calculate the time that the arrival point reaches the cube patch boundary:

wherexbis the coordinate of cube patch boundary.Then,the departure point is calculated by:

whereubis the velocity atxb.At cube patch boundaries,the‘source term’ is calculated by one-side difference instead of the central difference in Eq.(15).
We should note that the flux across the cube patch boundaries is calculated only once in this study.As shown inFig.6,A is the arrival point on a patch boundary and Adis the corresponding departure point on Patch 4.The point value of point A is calculated on Patch 4,and the flux across A is calculated by integrating the spatial approximation profile on Patch 4 along the Ad−A line segment.If Adis on Patch 1,the same process is executed for Patch 1,and so on for each patch boundary.
4.Numerical simulations
To verify the performance of the proposed transport model,several widely used benchmark tests,including solid body rotation,moving vortices,and deformational flow tests are performed on the spherical mesh.
The normalized errors proposed byWilliamson et al.(1992)are used:
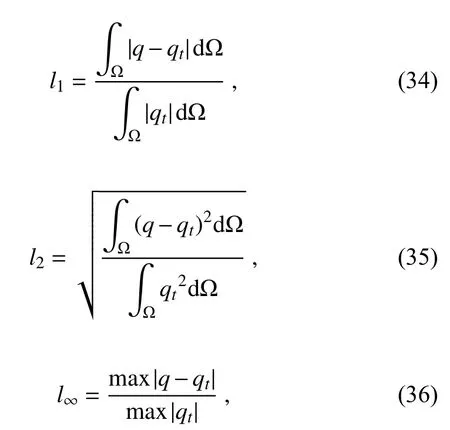
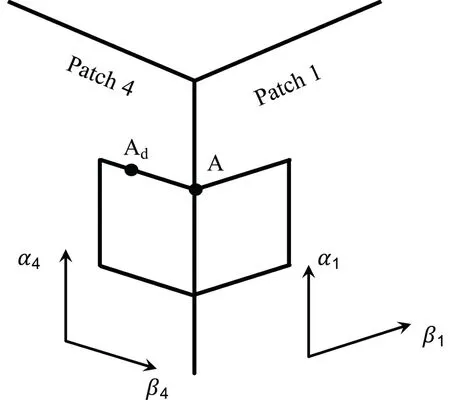
Fig.6.Illustration of departure points along patch boundary.
where Ω is the whole computational domain andqandqtrefer to numerical solutions (volume-integrated average in our paper) and exact solutions,respectively.
4.1.Solid-body rotation tests
The solid-body rotation test (Williamson et al.,1992) is widely used in two-dimensional spherical transport modeling to evaluate the performance of a transport model.The wind components in the latitude-longitude coordinates (λ,θ)are defined as:

where (us,vs) is the velocity vector,u0=2πR/1036800(1036800 s equals 12 days),which means it takes 12 days to complete a full revolution on the sphere,R is the radius of the sphere,and α is a parameter which controls the rotation angle.In this test,two kinds of initial conditions are used,including a cosine bell and a step cylinder.
4.1.1.Solid body rotation of a cosine bell
The initial condition of a cosine bell test is specified as:

whererdis the great circle distance between ( λ,θ) and the center of the cosine bell,located at ( 3π/2,0),r0=7πR/64 is the radius of the cosine bell,andh0=1.
The normalized errors on 32×32×6 meshes and with 256 time steps compared with other existing published semi-Lagrangian schemes,the PPM-M scheme (Zerroukat et al.,2007) and CSLAM-M (Lauritzen et al.,2010),are presented inTable 1.The result shows that CSLR1 and CSLR1-M get almost the same result.And our scheme is com-parable to the PPM-M scheme,and the result in the nearpole flow direction (α =π/2 and α=π/2−0.05) is better than the CSLAM-M scheme.
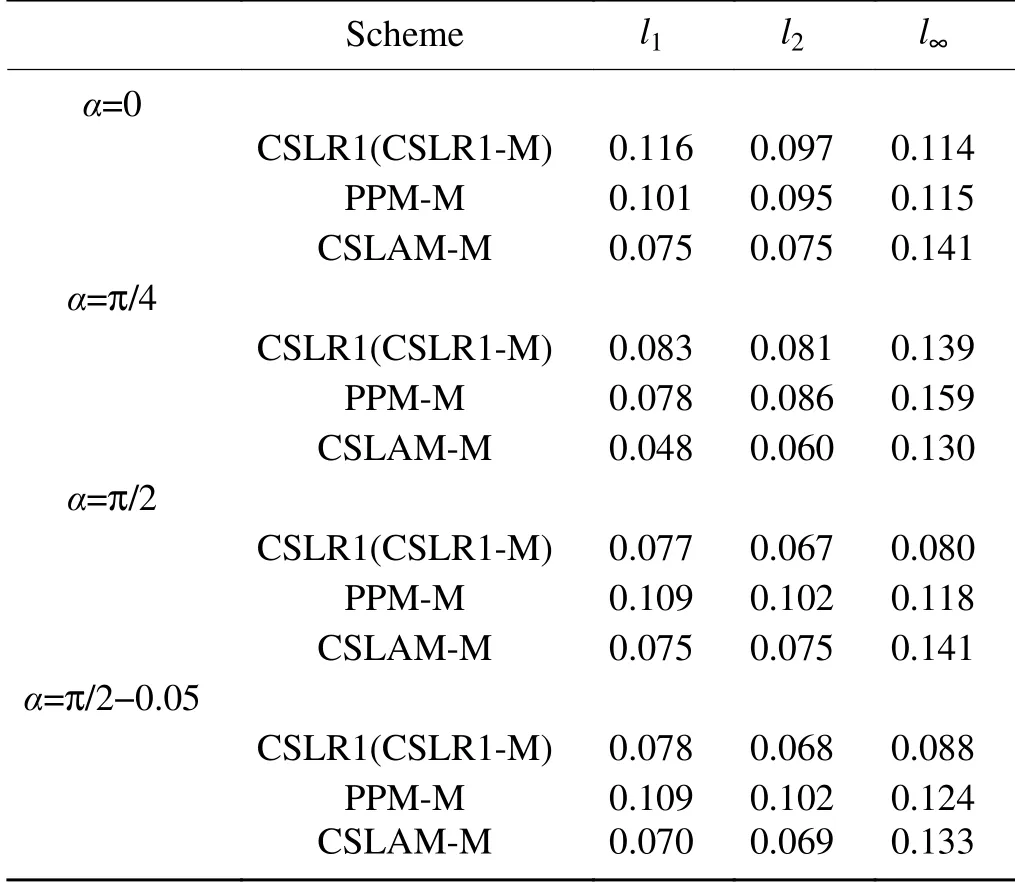
Table 1.Comparison of the normalized errors of rotation of a cosine bell after one revolution with other published schemes.
To check the influence of the weak singularities at the eight vertices of the cubed-sphere gird,this test is conducted with α=π/4 to pass through four vertices.The history of normalized errors (CSLR1 and CSLR1-M are almost the same,so we only present the result of CSLR1-M here) are shown inFig.7.We can see that the normalized errors have little fluctuations (except thel∞errors at around day 4 and day 10) when the flow passes four weak singularities.
To demonstrate the ability of the CSLR1-M scheme using a large Courant number to transport,we use 72 time steps (local maximum Courant number is about 1.78) with rotation angle α=π/2 to complete one revolution.The normalized errors arel1=0.052,l2=0.046,andl∞=0.061.
4.1.2.Solid body rotation of a step cylinder

Fig.7.History of normalized errors of the solid body rotation of a cosine bell for one revolution on grid N=32 (number of cells in one direction on each cell),256 time steps and with α =π/4.
A non-smooth step cylinder is calculated to evaluate the non-oscillatory property.The initial distribution is specified as

whererdis the great circle distance between (λ,θ) and(3π/2,0),which is the center of the step cylinder,r1=2/3Randr2=1/3R.
In this test,we set α=π/4,which is the most challenging case of the rotation test where the step cylinder moves through four vertices and along two boundary edges of the cubed-sphere grid to complete a full revolution.Here,we use 90×90×6 meshes and 720 time steps to conduct this test.The numerical results after 12 days are shown inFig.8,and we can see that the CSL2 scheme will generate obvious oscillations around the discontinuities.By using the CLSR1 and CSLR1-M approaches,these nonphysical oscillations are effectively removed.The maximum and minimum value of CSL2 areqmax=1034.23 andqmin=−2.45,and for CLSR1 and CSLR1-M they areqmax=1001.85 andqmin=0.The history of relative mass errors is given inFig.9,which shows that the relative mass errors are up to the tolerance of machine precision,therefore the proposed global transport model is exactly mass conservative during the simulation procedure.
4.2.Moving vortices on the sphere
The second benchmark test we used is the moving vortices test proposed byNair and Jablonowski (2008).The wind component of this test is a combination of the solid body rotation test and two vortices,and it is much more complicated than the solid body rotation test.The velocity fields on the sphere are specified as:

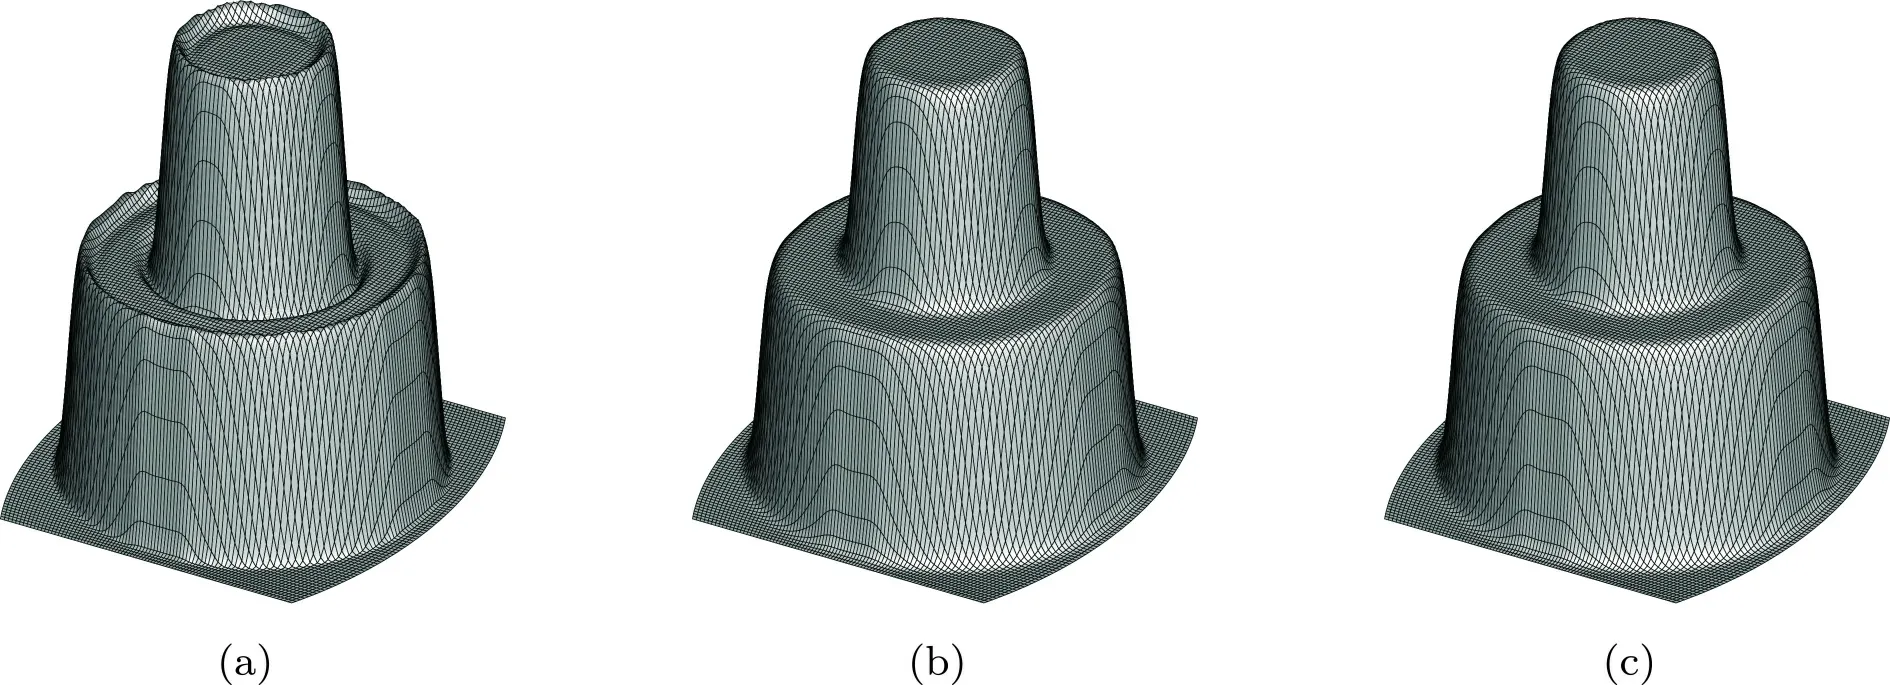
Fig.8.Numerical results of solid body rotation of the step cylinder after one revolution (12 days).(a) is the result of CSL2,(b) is the result of CSLR1,and (c) is the result of CSLR1-M.

Fig.9.The time history of relative mass error for solid body rotation of the step cylinder test case by the CSLR1-M scheme.
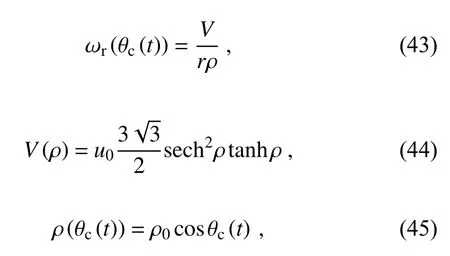
whereusandvsare calculated by Eqs.(37) and (38),and the rotation angle of this test is set to be α=π/4.ρ0=3,λc(t)and θc(t) are the center of the moving vortex at timet,and the calculation procedure of λc(t) and θc(t) can be found in(Nair and Jablonowski,2008).
The tracer field is defined as:

where γ is a parameter to control the smoothness of the tracer field,(λ′,θ′) is the rotated spherical coordinates,which can be calculated by:

This test is conducted on 80 × 80 × 6 meshes and uses 400 time steps to move forward 12 days.The contour plots inFig.10show that compared with the exact solution,our proposed scheme can simulate this complicated procedure well.The plot along the equator is presented inFig.11,and it shows that there are no obvious oscillations around large gradients.The normalized errors of CSLR1 and CSLR1-M are almost the same,beingl1=5.295×10⁻²,l2=0.1295,andl∞=0.5667,respectively.The histories of minimum values are shown inFig.12,where we can see that the CSLR1 scheme would produce negative values during the simulation procedure,while the minimum values of CSLR1-M can completely preserve positivity (the minimum values are within the machine precision).
4.3.Deformational flow test
The last benchmark test used in our paper is the deformational flow test proposed byNair and Lauritzen (2010),which is the most challenging test case.The nondivergent and time-dependent flow fields are defined as:

where κ =2,T=5,and λ′=λ−(2πt/T).
Two kinds of initial conditions are checked here,including the twin slotted cylinders case to evaluate the positivity preserving property and correlated cosine bells to evaluate the nonlinear correlations between tracers (Lauritzen and Thuburn,2012).By the given flow fields,the initial distributions will be deformed into thin bars during the first half period,then return to its initial state during the second half period.
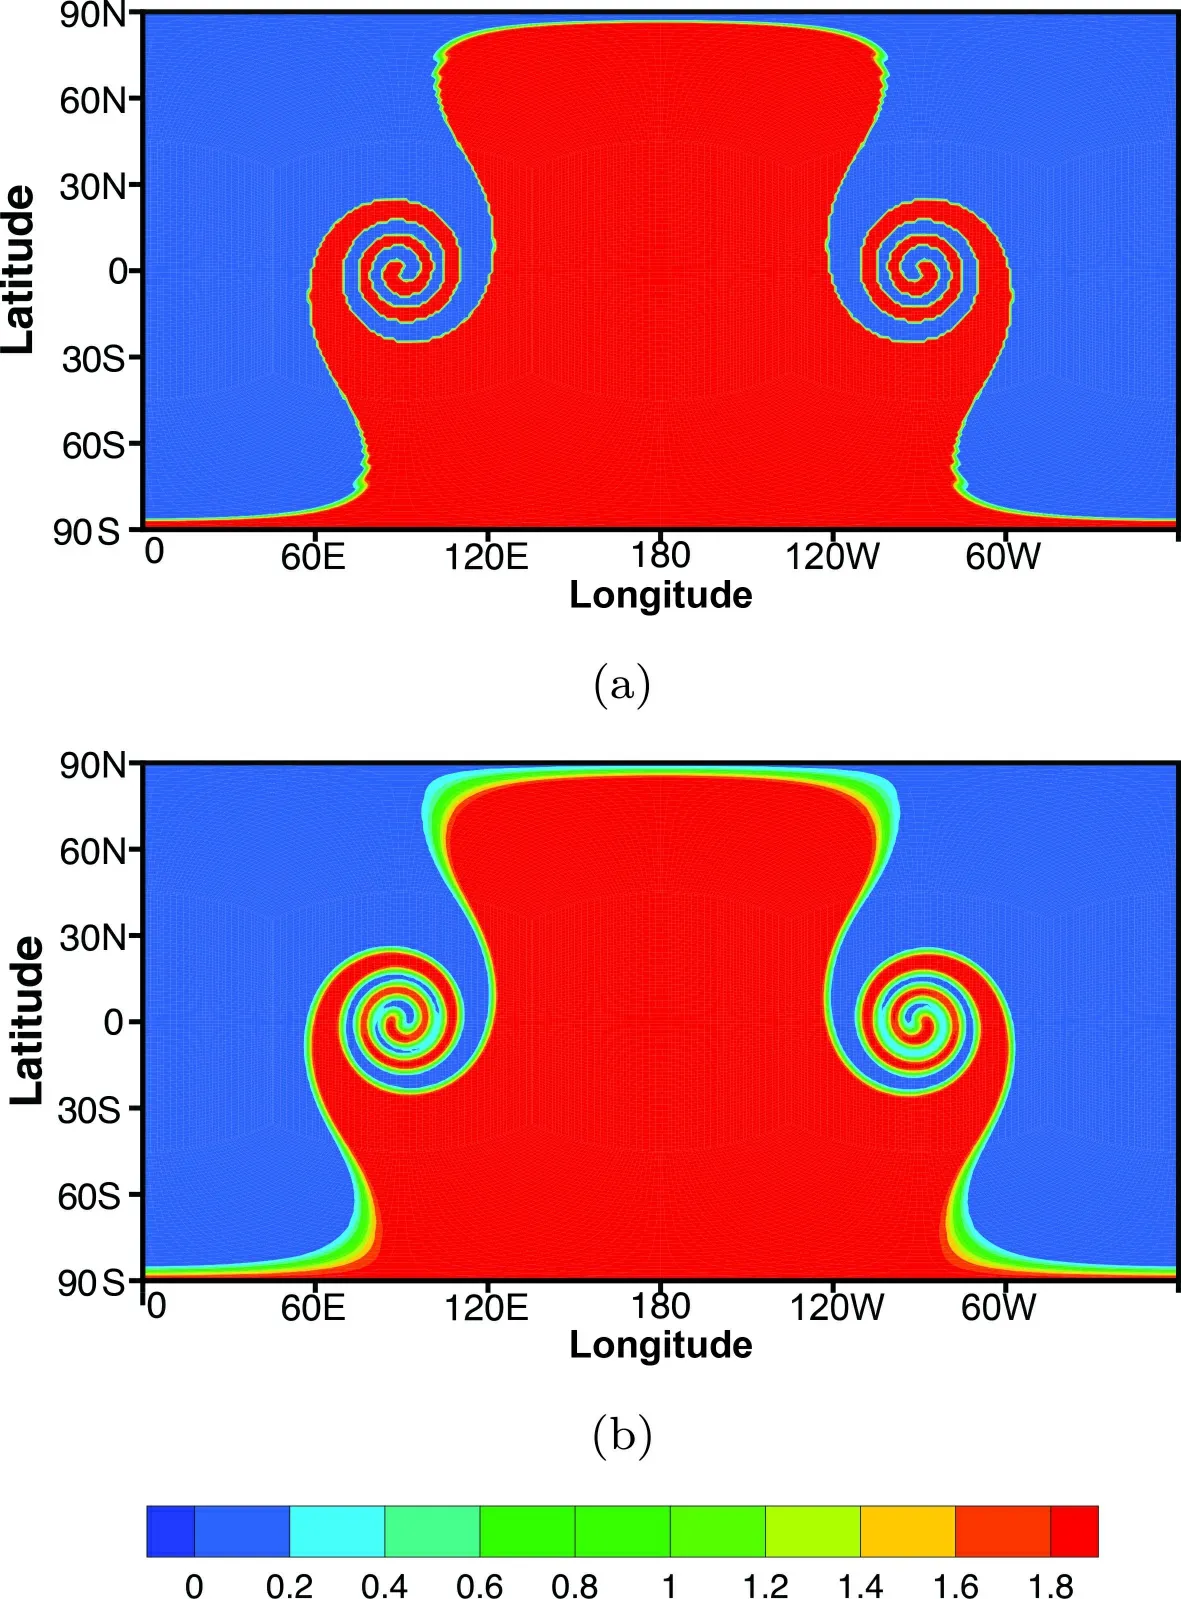
Fig.10.Contour plot of moving vortices after 12 days.(a) is the exact solution,(b) is the result of the CSLR1-M scheme.
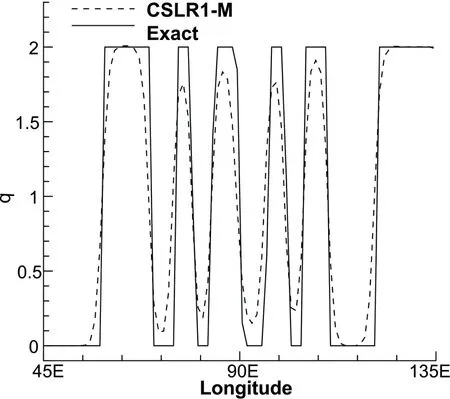
Fig.11.Plot along the equator for the moving vortices test at 12 days.
4.3.1.Deformation of twin slotted cylinders
The initial condition is defined as:

wherer0=0.5 andri(i=1,2) represent the great circle distances between the center of the two slotted cylinders and a given point.The centers of the two slotted cylinders are located at (λ1,θ1)=(5π/6,0) and (λ2,θ2)=(7π/6,0),respectively.

Fig.12.The histories of minimum values qmin of the moving vortices test.(a) is the result of the CSLR1 scheme,(b) is the result of the CSLR1-M scheme.
The numerical results of deformational flow of the CSLR1-M scheme with 90 × 90 × 6 meshes and with 390 time steps (local maximum Courant number is about 3) are shown inFig.13.As shown inFig.13b,the two slotted cylinders are deformed into two thin filaments by the background flow field during the first half period.Figure 13 cgives the counters of the slotted cylinders at the final time,and it is indicated that the proposed scheme can correctly reproduce this complicated deformational flow and does not produce oscillations.The histories of minimum values are shown inFig.14,which indicates that the CSLR1 scheme would produce negative values,while the CSLR1-M scheme keeps minimum values within the tolerance of machine precision,which can be viewed as non-negativity.The Normalized errors arel1=0.3287,l2=0.3321,andl∞=0.9415 for both the CSLR1 and CSLR1-M schemes.
4.3.2.Deformation of correlated cosine bells
To check the ability of preserving nonlinearly correlated relations between two tracers,we used two kinds of tracers.One is the quasi-smooth twin cosine bells:

The other one is the correlated cosine bells:

where ψ (q)=−0.8q2+0.9.
This test is conducted on 90×90×6 meshes with 1800 time steps.The scatter plot of numerical result att=T/2 is shown inFig.15.The solution of cosine bells is in the x-direction,and the correlated cosine bells is in the y-direction.The mixing diagnostics arelr=1.05×10⁻³,lu=2.40×10⁻⁵,andl0=5.57×10⁻⁴,respectively (seeLauritzen and Thuburn,2012) for the detail definition of these three parameters).The CSLR1-M scheme is built using a monotone rational polynomial with modest accuracy,which always overly flattens the maximum and minimum values,as shown in the bottom-right corner ofFig.15.In the whole,the scattering points of the CSLR1-M scheme are almost located inside the convex hull which means that the CSLR1-M scheme can preserve nonlinearly correlated relations between tracers well.
5.Summary
In this paper,a non-negativity and conservative semi-Lagrangian transport scheme based on a multi-moment finite volume method has been developed on the cubed-sphere grid.By using the PV moment and VIA moment,a rational function is constructed as a spatial approximation function within a single cell instead of the non-monotonic CSL2 scheme to suppress the numerical oscillations and keep the monotonicity.In terms of multi-moment concepts,the VIA moment is cast by utilizing the flux form formulation to guarantee the exact numerical conservation.In the CSLR1 scheme,the semi-Lagrangian method is adopted to update the PV moments,which keeps good properties of the semi-Lagrangian scheme.To simplify the implementation in curvilinear (cubed-sphere) geometry,a dimension-splitting time stepping strategy is combined with the multi-moment finite volume method.In the case of a valley of the transported field,two kinds of modifications are conducted on the original CSLR1 scheme for exactly positive-definite preservation.Note that the improved CSLR1-M scheme dose not degrade the accuracy of the original CSLR1 scheme.The numerical results show that the CSLR1-M scheme is nonoscillatory and can preserve the non-linear correlations between tracers.In addition,the semi-Lagrangian approach permits a large time step,which can greatly improve computational efficiency.The quality of the present transport modelling has been demonstrated by the widely used benchmark tests on a cubed-sphere grid.The results reveal that the developed transport modelling not only can effectively remove nonphysical oscillations,but it can also preserve the non-negativity of numerical solutions,which indicates that it has the potential to simulate the various tracers accurately for real applications.When the mass sources such as evaporation,condensation,etc.are involved in real simulation,they can be added to each PV variable through a fractional step in the multi-moment model after the tracers are advected by the CSLR scheme.Furthermore,a positivity constraint is also imposed on the source terms.
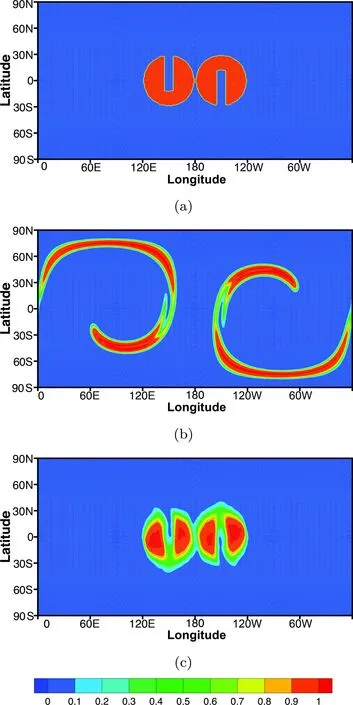
Fig.13.Numerical result of deformational flow of slotted cylinder after one period by the CSLR1-M scheme.(a) is the exact solution,(b) is the numerical solution at half cycle,(c) is the numerical solution after one cycle.
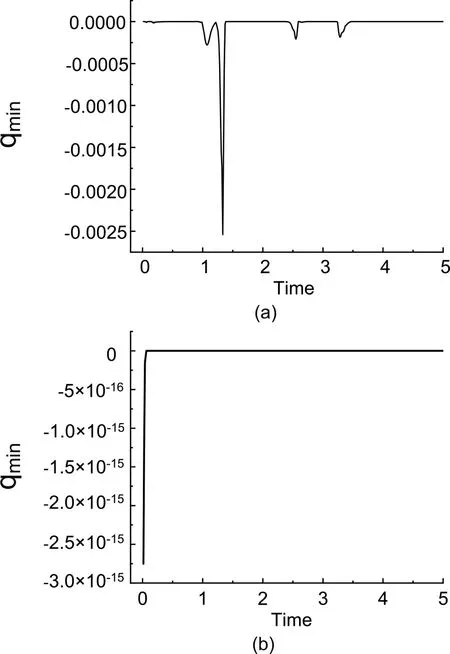
Fig.14.Histories of minimum values qmin of deformation of the twin slotted cylinder test case.(a) is the result of the CSLR1 scheme,(b) is the result of the modified CSLR1-M scheme.

Fig.15.Scatter plot of nonlinearly correlated cosine bell at t=T/2.
Acknowledgments.This work was supported by the National Key Research and Development Program of China (Grant Nos.2017YFC1501901 and 2017YFA0603901) and the Beijing Natural Science Foundation (Grant No.JQ18001).
Open AccessThis article is distributed under the terms of the Creative Commons Attribution License which permits any use,distribution,and reproduction in any medium,provided the original author(s) and the source are credited.This article is distributed under the terms of the Creative Commons Attribution 4.0 International License (http://creativecommons.org/licenses/by/4.0/),which permits unrestricted use,distribution,and reproduction in any medium,provided you give appropriate credit to the original author(s) and the source,provide a link to the Creative Commons license,and indicate if changes were made.
杂志排行
Advances in Atmospheric Sciences的其它文章
- The First Global Carbon Dioxide Flux Map Derived from TanSat Measurements
- A Deep Learning Method for Bias Correction of ECMWF 24–240 h Forecasts
- Thinner Sea Ice Contribution to the Remarkable Polynya Formation North of Greenland in August 2018
- Application of Backward Nonlinear Local Lyapunov Exponent Method to Assessing the Relative Impacts of Initial Condition and Model Errors on Local Backward Predictability
- Estimation and Long-term Trend Analysis of Surface Solar Radiation in Antarctica:A Case Study of Zhongshan Station
- Variational Quality Control of Non-Gaussian Innovations in the GRAPES m3DVAR System:Mass Field Evaluation of Assimilation Experiments
