Application of machine learning models for predicting acute kidney injury following donation after cardiac death liver transplantation
2021-07-24ZengLeiHeJunBinZhouZhiKunLiuSiYiDongYunToZhngTinShenShuSenZhengXioXu
Zeng-Lei He ,b,Jun-Bin Zhou ,b,Zhi-Kun Liu ,b,Si-Yi Dong ,b,Yun-To Zhng ,b,Tin Shen ,b,Shu-Sen Zheng ,b,Xio Xu ,b,∗
a Division of Hepatobiliary and Pancreatic Surgery, the First Affiliated Hospital, Zhejiang University School of Medicine, Hangzhou 310 0 03, China
b Key Laboratory of Combined Multi-organ Transplantation, Ministry of Public Health, the First Affiliated Hospital, Zhejiang University School of Medicine,Hangzhou 310 0 03, China
Keywords:Artificial intelligence algorithm Random forest Acute kidney injury Liver transplantation
ABSTRACT Background:Acute kidney injury (AKI) is a common complication after liver transplantation (LT) and is an indicator of poor prognosis.The establishment of a more accurate preoperative prediction model of AKI could help to improve the prognosis of LT.Machine learning algorithms provide a potentially effective approach.Methods:A total of 493 patients with donation after cardiac death LT (DCDLT) were enrolled.AKI was defined according to the clinical practice guidelines of kidney disease: improving global outcomes (KDIGO).The clinical data of patients with AKI (AKI group) and without AKI (non-AKI group) were compared.With logistic regression analysis as a conventional model,four predictive machine learning models were developed using the following algorithms: random forest,support vector machine,classical decision tree,and conditional inference tree.The predictive power of these models was then evaluated using the area under the receiver operating characteristic curve (AUC).Results:The incidence of AKI was 35.7% (176/493) during the follow-up period.Compared with the non-AKI group,the AKI group showed a remarkably lower survival rate ( P < 0.001).The random forest model demonstrated the highest prediction accuracy of 0.79 with AUC of 0.850 [95% confidence interval (CI):0.794–0.905],which was significantly higher than the AUCs of the other machine learning algorithms and logistic regression models ( P < 0.001).Conclusions:The random forest model based on machine learning algorithms for predicting AKI occurring after DCDLT demonstrated stronger predictive power than other models in our study.This suggests that machine learning methods may provide feasible tools for forecasting AKI after DCDLT.
Introduction
Liver transplantation (LT) is a life-saving therapy for patients with end-stage liver disease.Acute kidney injury (AKI) is one of the most common complications experienced by patients who have undergone LT during the immediate postoperative period.The incidence of postoperative AKI ranges from 17% to 95% [1-3].AKI after LT is associated with an increased rate of graft failure and poor survival [4,5].
Several risk factors for AKI post-LT have been reported,including preoperative calculated score of model for end-stage liver disease (MELD),donor or recipient body mass index (BMI),long operative duration,and female sex [6-8].Based on these risk factors,various models have been developed using logistic regression for predicting AKI after LT [7,9-11].However,because several of these models address postoperative parameters,their utility in predictive modeling appears to be of questionable relevance [12].
Algorithms based on artificial intelligence (AI)/machine learning (ML) have been shown to perform better than logistic regression for predicting AKI in different patients,such as intensive care unit (ICU) patients,burn patients,or patients undergoing coronary angiography [13-15].However,although the implementation of ML algorithms in various predictive models is well-known,few studies have evaluated these methods for predicting AKI following donation after cardiac death (DCD) LT [16-19].
Therefore,it is important to develop more reliable prognostic tools for AKI risk assessment and to improve patient outcomes.This study was conducted with the objective of using preoperative and intraoperative data from our center to compare the performance of ML algorithms to that of a logistic regression model for predicting AKI after LT.
Methods
Patients
All adult patients (>18 years old) undergoing DCDLT between January 2015 and December 2018 at the First Affiliated Hospital,Zhejiang University School of Medicine were enrolled in this retrospective study.Patients who preoperatively suffered from acute or chronic kidney injury,hepatorenal syndrome,or heart disease were excluded.All patients were routinely observed at the outpatient clinic.The perioperative data of recipients and donors were retrospectively reviewed using the hospital’s electronic medical records system.The MELD score was used to stratify the patients on the waiting list and allocate donor organs.Informed consent was obtained from all donors or their relatives and recipients before transplantation.All transplantations were performed with organs from voluntary donations made by deceased donors.Each organ donation or transplant in our center followed the guidelines of the Organ Transplant Committee of Zhejiang Province.Our study protocol was approved by the Clinical Ethics Review Board of the First Affiliated Hospital,Zhejiang University School of Medicine.
Data collection
Data related to demographic or perioperative variables were collected in accordance with the procedure described in previous studies [20-23].The following perioperative clinical variables were recorded for the study: patient demographics,medical history,medication history,baseline laboratory finding,information about the donor and graft liver,operative time,intraoperative fluid and colloid administration,and intraoperative transfusion amount.The pre-transplant data were collected within 24 h before transplantation.The post-transplant data were recorded throughout the first post-transplant week.
The primary outcome variable was postoperative AKI defined according to kidney diseases: improving global outcomes (KDIGO)2012 [24].AKI is defined as one of the following: serum creatinine (SCr) increased to ≥26.5μmol/L within 48 h or SCr increased to ≥1.5 times of the baseline level,which is known or presumed to have occurred within the prior 7 days; or urine volume<0.5 mL/kg/h for 6 h.KDIGO categorizes AKI to three stages of renal dysfunction: AKI stages 1,2,and 3 (Table S1).
Statistical analysis
Quantitative variables were expressed as mean ± standard deviation (SD) or median and interquartile range (IQR),and were compared using Student’sttest or Wilcoxon’s rank-sum test.Categorical variables were presented as values and percentages,and were compared using Chi-square test.Kaplan-Meier method and log-rank test were used for survival analysis.All the variables were detected by univariate analysis,and aPvalue<0.05 was considered statistically significant.The variable with aPvalue<0.1 in the univariate analysis was used in a forward stepwise multivariate logistic regression analysis.SPSS version 19.0 for Windows(SPSS Inc.,Chicago,IL,USA) was used for the analyses.R software version 3.6.2 (http://www.r-project.org/) was used for the establishment and comparison of models based on ML.The following R packages were used for ML approaches: AER package for logistic regression; rpart,rpart.plot,and party packages for the classical decision tree model and conditional inference tree; randomForest package for random forest; e1071,UBL,and kernlab packages for support vector machine; PROC and ROCR packages for receiver operating characteristic (ROC) curve analysis (Table S2).The arguments of the hyperparameters can be obtained by Bayesian hyperparameters tuning.
Nomogram was formulated based on the results of the multivariate logistic regression analysis,proportionally converting each regression coefficient in multivariate logistic regression on a 0- to 100-point scale.The points were added across independent variables to derive total points,which were then converted to predicted probabilities.
All factors were used as predictive parameters in Table 1 for ML.Our sample was randomly divided into respective training and test sets with a ratio of 0.7:0.3.The coefficients of the ML algorithms were trained with the training set and tested with the test set.The established model was used to determine the probability of AKI occurrence for each individual in the test set.When the probability of AKI occurrence was greater than 50%,AKI was deemed to occur.To evaluate and compare the predictive accuracy for the ML algorithms and the logistic regression model,we calculated the area under the ROC curve (AUC) and compared the AUCs of all models using DeLong’s method [25,26].
Results
Incidence and prognosis of AKI after LT
Among the 493 patients (404 males and 89 females),the median age was 51.5 (43.3–57.9) years.The median follow-up period was 20.4 (11.4–35.5) months.Demographic and clinical characteristics are summarized in Table 1.Baseline SCr values of the recipients showed no significant difference between the AKI and non-AKI groups.

Table 1 Patient baseline characteristics.
The incidence of AKI was 35.7% (176/493; stage 1,n= 64,13.0%; stage 2,n= 72,14.6%; stage 3,n= 40,8.1%).Compared with the non-AKI group,the AKI group showed a significantly lower survival rate (1-,2-,3-year overall survival: 68.4% vs.85.6%,64.7% vs.77.5%,61.8% vs.74.0%,P<0.001) ( Fig.1 ).
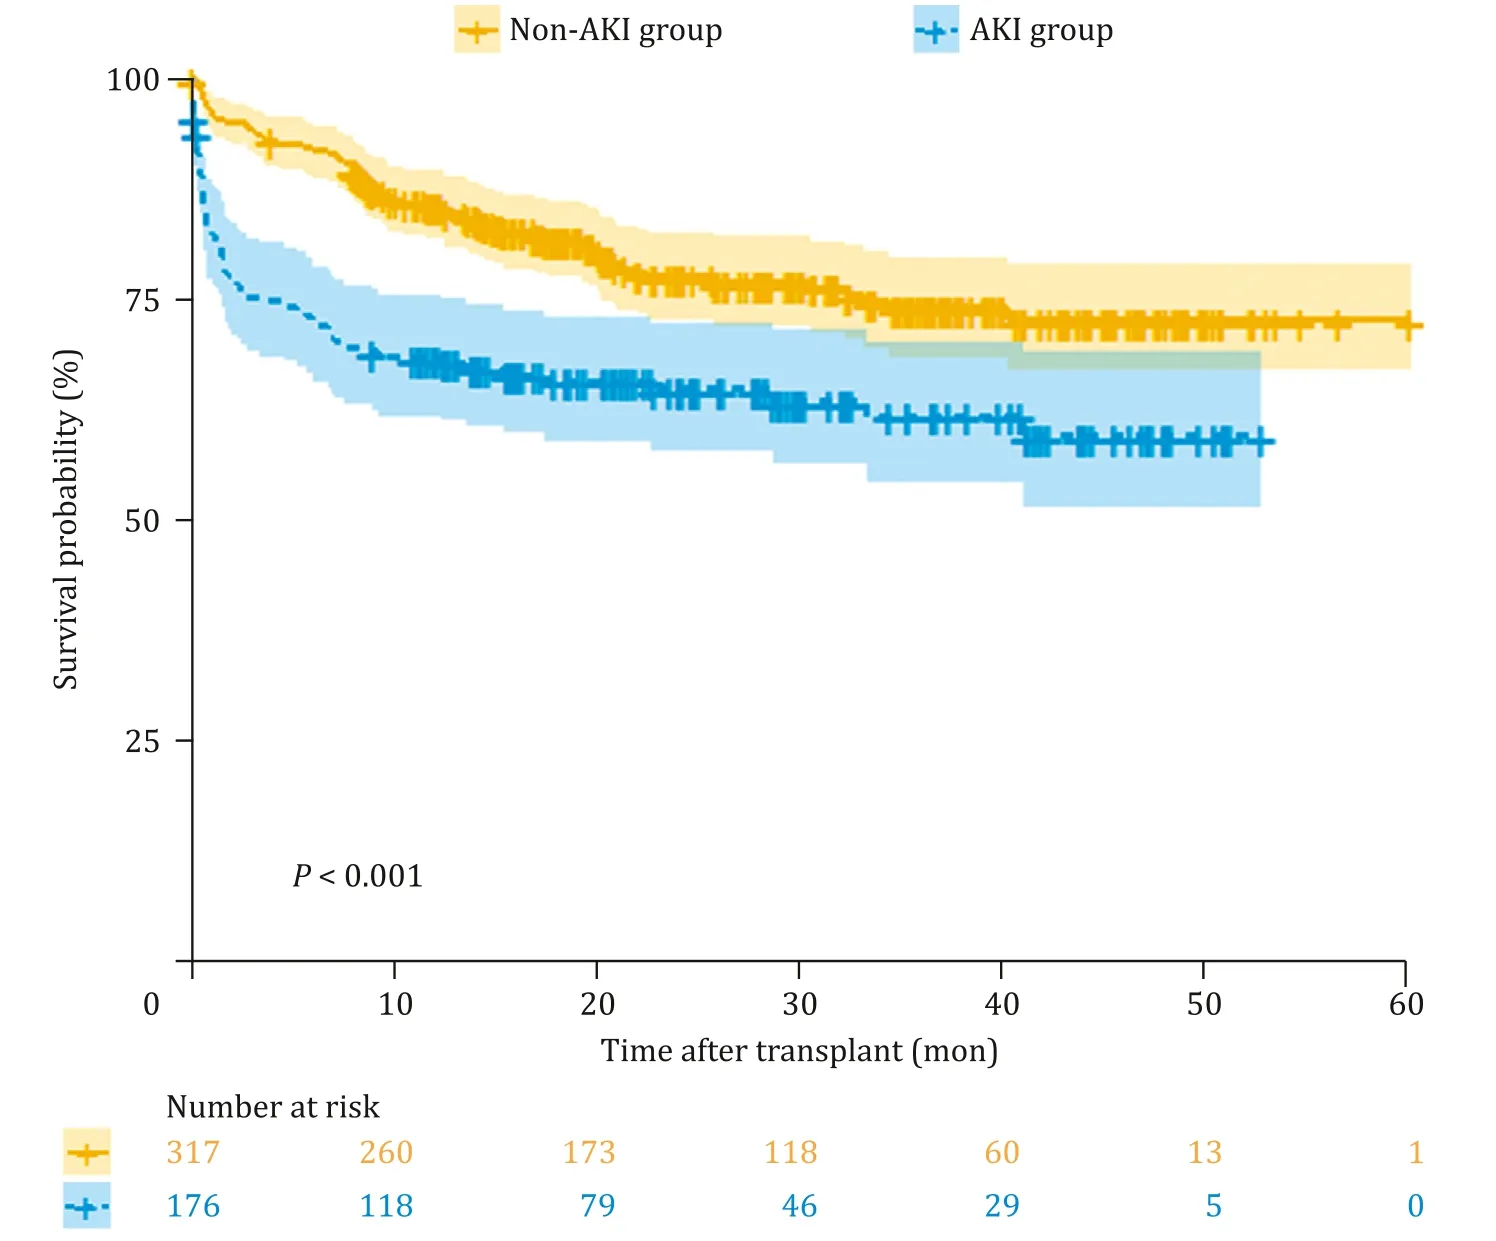
Fig.1.Comparison of cumulative patient survival between the acute kidney injury (AKI) group and non-AKI group.
Logistic regression
According to logistic regression analysis,the independent risk factors of AKI were hepatic encephalopathy before transplantation [odds ratio (OR) = 2.056,95% confidence interval (CI):1.295-3.265,P= 0.002],graft liver weight (OR = 2.374,95%CI: 1.157-4.870,P= 0.018),serum total bilirubin of the donor(OR = 1.021,95% CI: 1.007-1.035,P= 0.003),intraoperative blood loss (OR = 1.407,95% CI: 1.127-1.756,P= 0.003),and operative duration (OR = 1.250,95% CI: 1.045-1.495,P= 0.014)( Table 2 ).
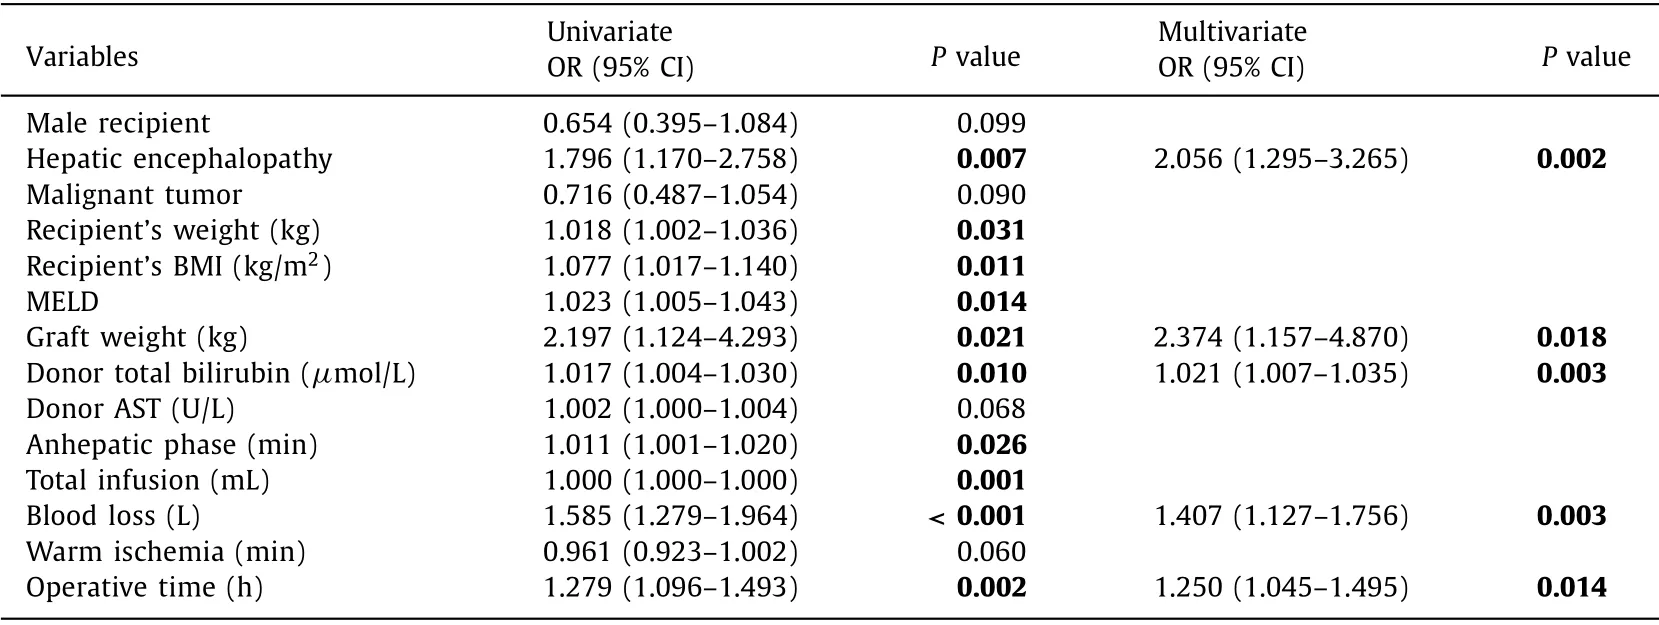
Table 2 The influencing factors of post-transplantation AKI.
Nomogram construction
We developed a preprocedural nomogram for predicting AKI after LT ( Fig.2 ).According to the results of the final multivariate logistic regression,the equation was as follows: ln[P/(1-P)]= 0.721 × encephalopathy + 0.020 × total bilirubin of the donor (μmol/L) + 0.223 × operative duration (h) + 0.341 × blood loss (L) during the operation + 0.864 × graft liver weight (kg) -4.002.In the equation,P represents the probability of AKI after LT.
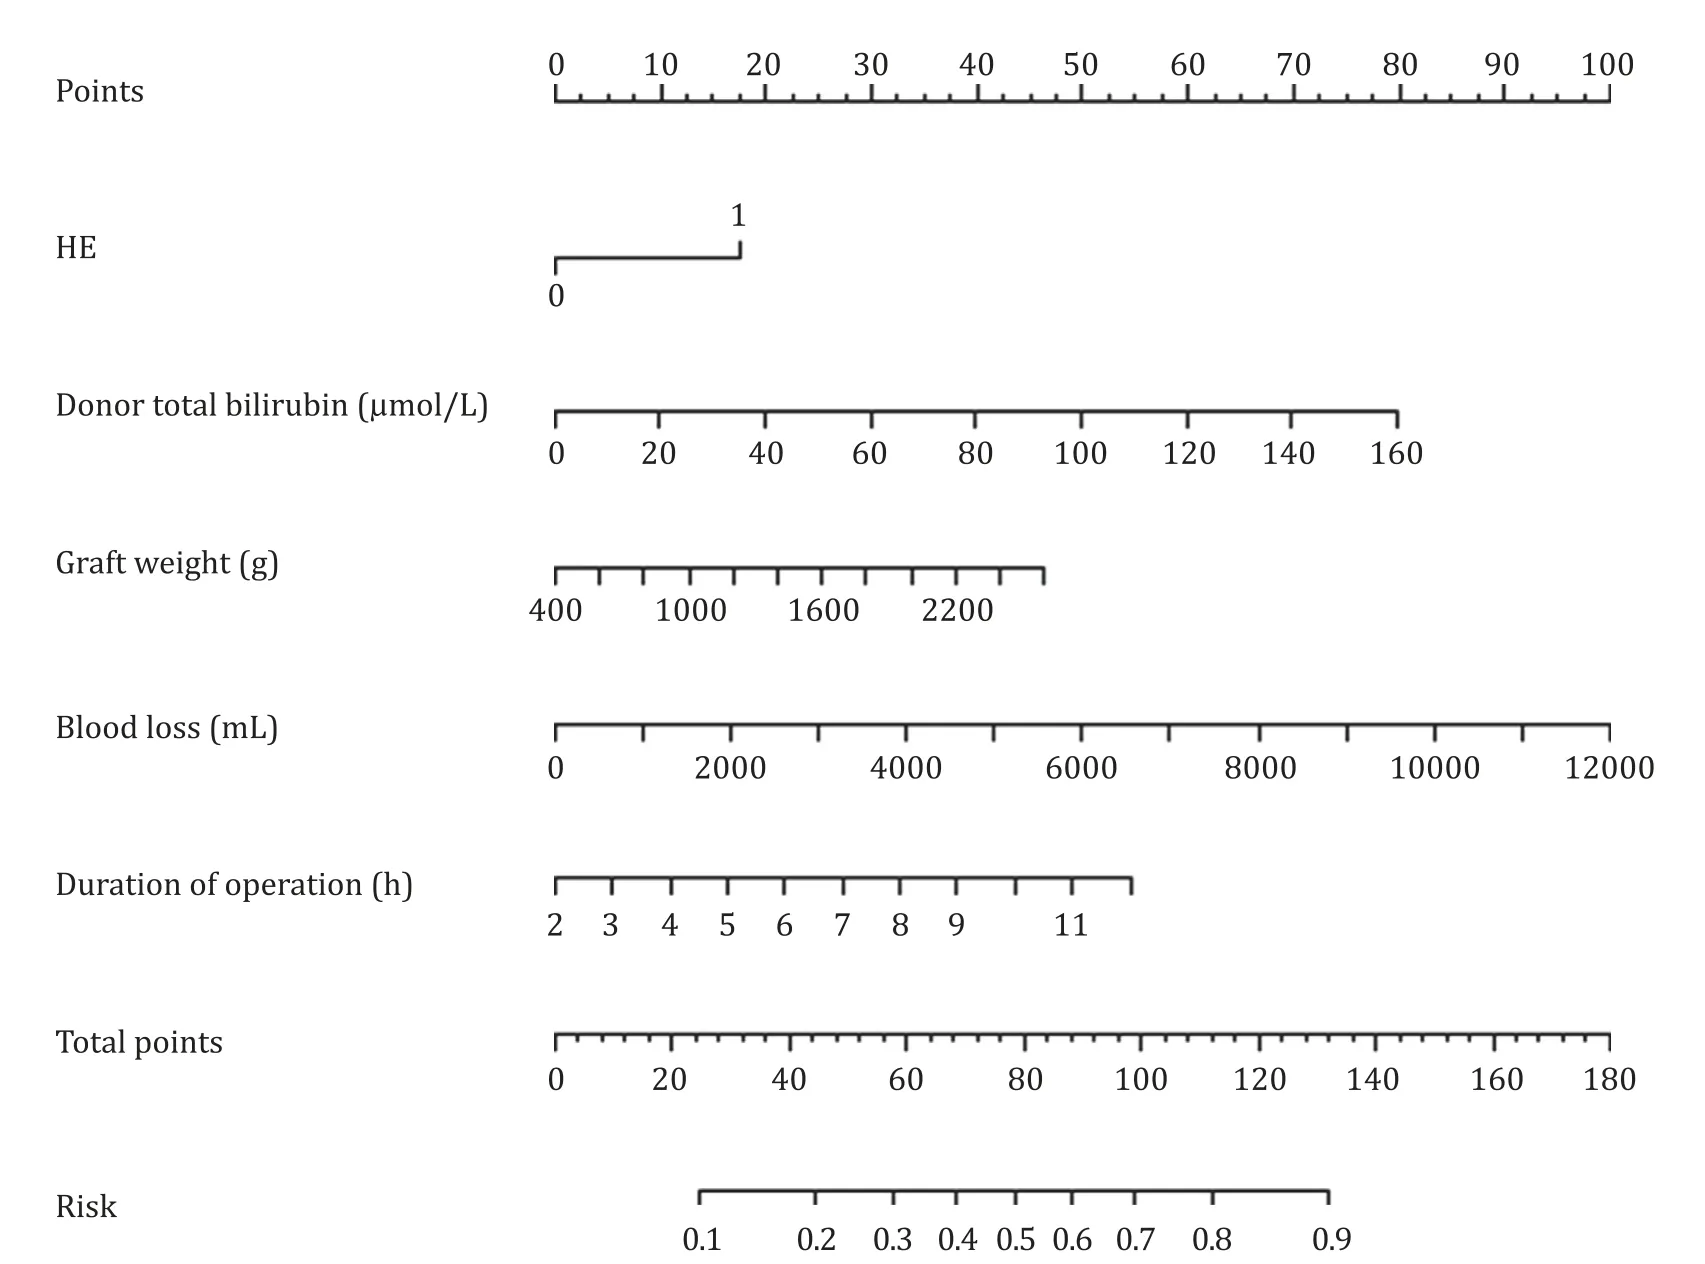
Fig.2.AKI prediction nomogram integrated with predictors selected by logistic regression.The nomogram had discriminative power with a C-statistic of 0.658.AKI: acute kidney injury; HE: hepatic encephalopathy.
As shown in the nomogram,patients with encephalopathy,high total bilirubin of the donor,excessive graft liver weight,more blood loss during the operation,and long operative duration were more likely to develop AKI.By summing the total score and locating the score on the total point scale,the development of AKI can be predicted for individuals during the surgery.
Decision tree and conditional inference tree
The results showed that the optimal tree had five terminal nodes (i.e.,four segmentations).Thus,we chose a depth of four.The classical decision tree model with a depth of four is shown in Fig.3.In our study,the minimum cross-validation error was 0.926,the standard error was 0.059,and optimal tree was one with crossvalidation in the range 0.866–0.985.We found that with intraoperative blood loss greater than 850 mL and graft weight greater than 1864 g,the incidence of AKI was as high as 92%.In another case,when intraoperative blood loss was greater than 4500 mL and graft weight was less than 1864 g,the incidence of AKI was as high as 90%.
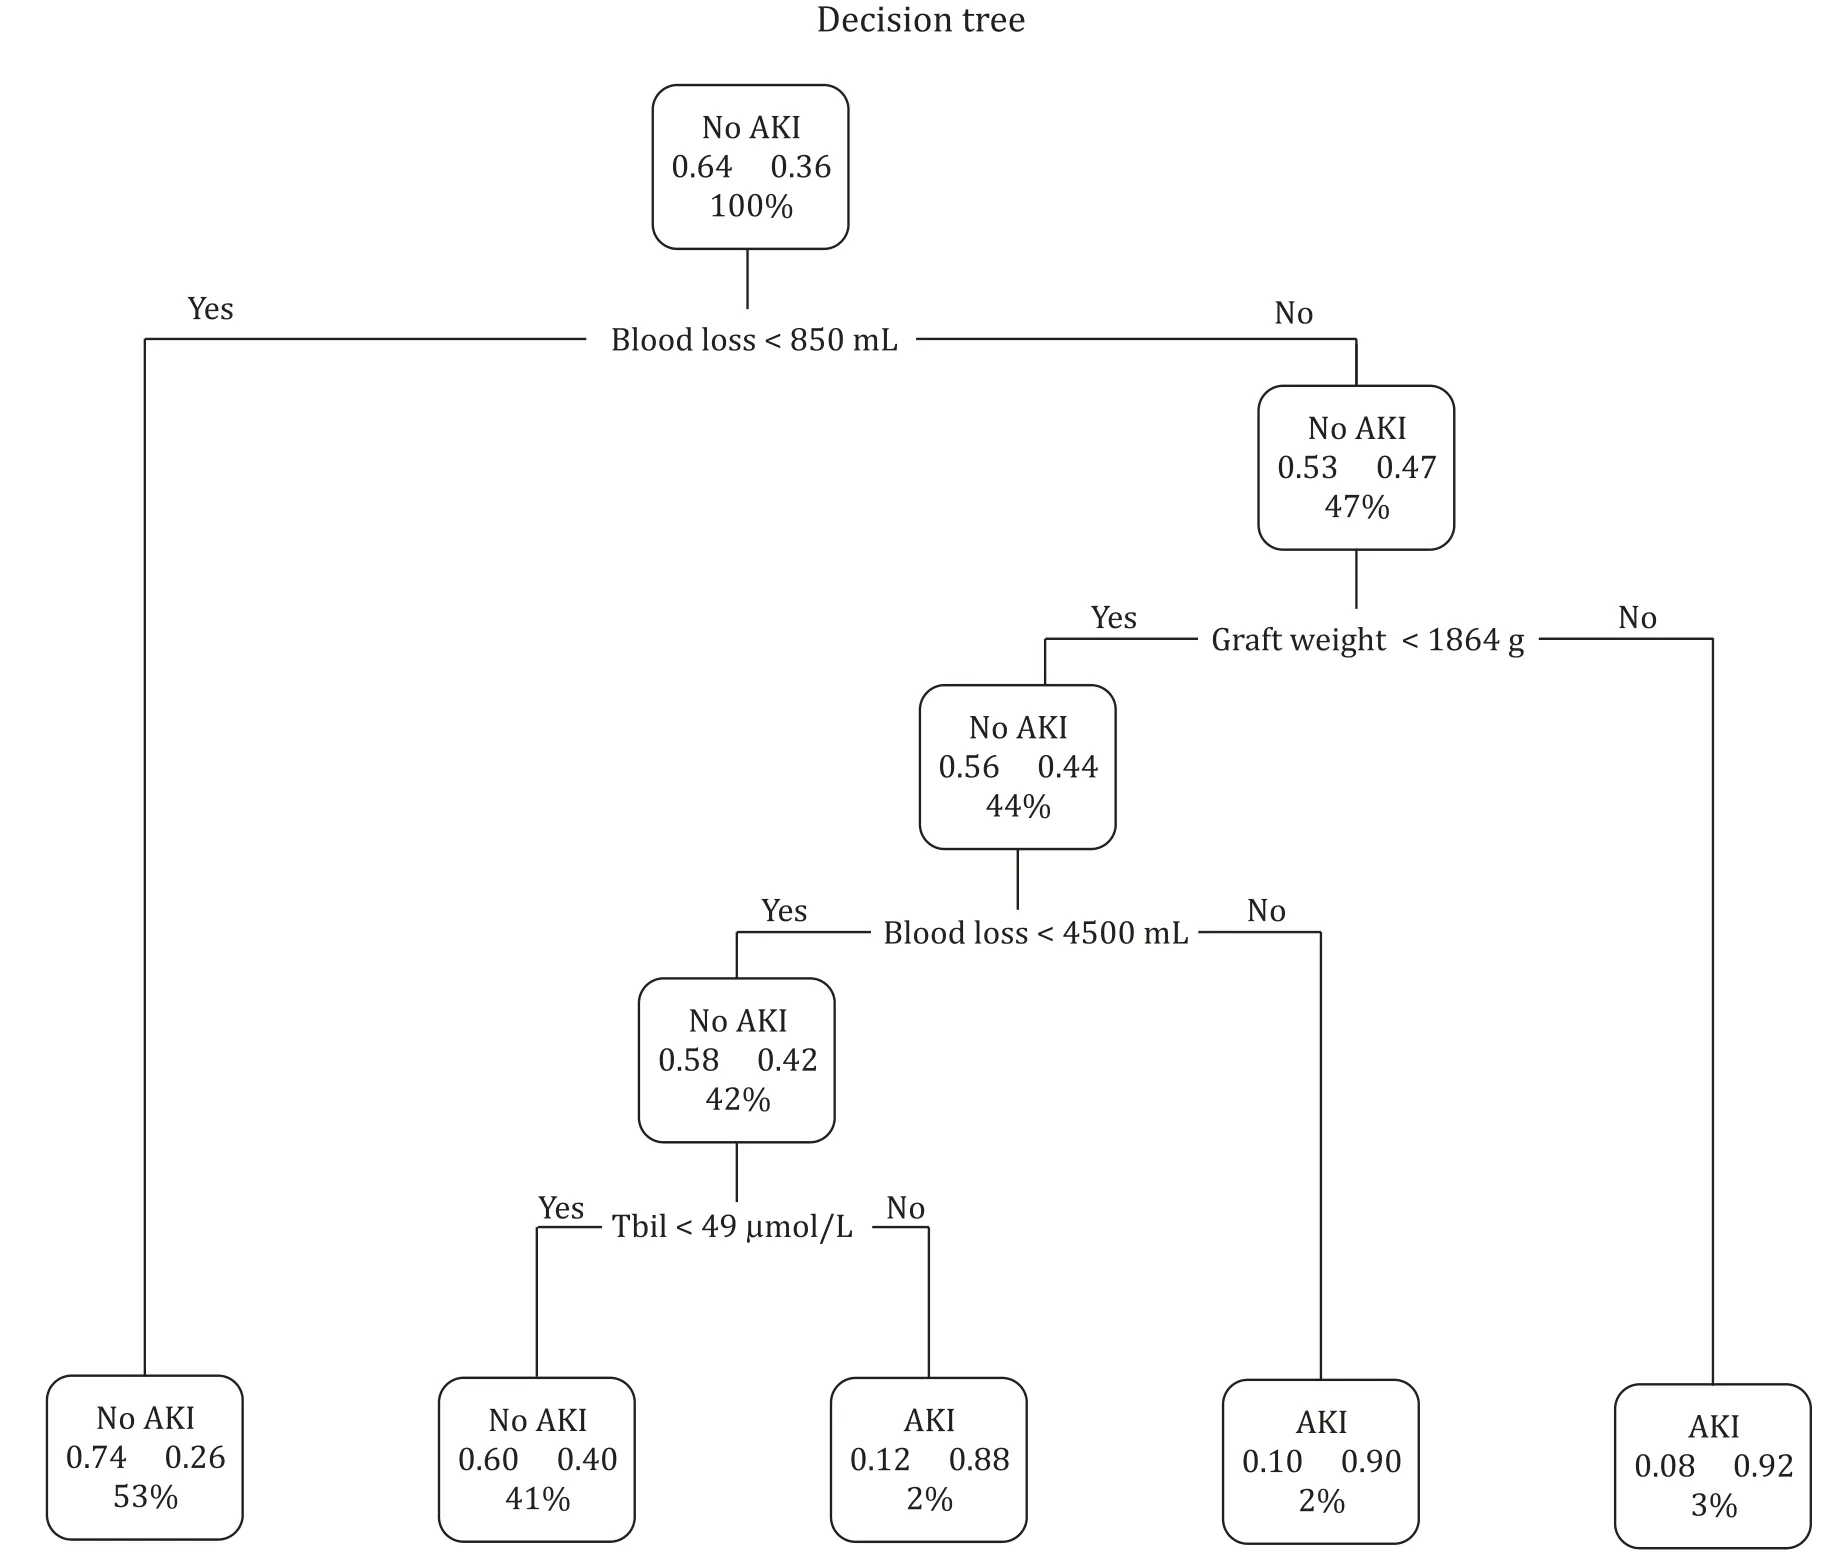
Fig.3.Simple decision tree model showing the classification of patients with and without acute kidney injury (AKI).The two decimal numbers in each cell signify the probability of developing non-AKI or AKI in each classification tree.The non-AKI or AKI becomes dense when it is more likely to develop acute kidney injury or not.The percentage in the box denotes the percentage of patients with each discriminating variable from analysis.TBil: total bilirubin.
The stepwise binary classification criterion of the best decision tree,which is also called conditional inference tree with a depth of three,is shown in Fig.4.This model revealed that when intraoperative blood loss was greater than 4000 mL,the incidence of AKI was a bit higher than 90%.In contrast,when hemorrhage was lessthan 800 mL and no hepatic encephalopathy was observed before operation,the incidence of AKI was only about 20%.

Fig.4.Conditional inference tree for the training dataset for predicting AKI.For each node,the Bonferroni-adjusted P values are given and the fraction of patients with AKI is displayed for each terminal node.In the terminal nodes,black shading indicates the probability of AKI for a specific subgroup of patients.A multiple testing-adjusted P value is given,which describes the strength of the statistical association between the early predictor characteristic (blood loss and hepatic encephalopathy) and the outcome(AKI).The four plots at the bottom show the sample size and the distribution of the clinical endpoint (AKI) for each subgroup.AKI: acute kidney injury.
Random forest
In this predictive model,the five most important factors were as follows: recipient’s BMI,operative duration,serum total bilirubin of the donor,anhepatic phase,and recipient’s body weight.The five least important factors were as follows: glucocorticoid usage,donor’s comorbidity of diabetes mellitus,peritonitis,ABO blood group incompatibility,and recipient’s hepatitis B infection.The importance of factors judged by the random forest based on the Gini coefficient is shown in Fig.5.Higher Gini coefficient represented a stronger predictive value.
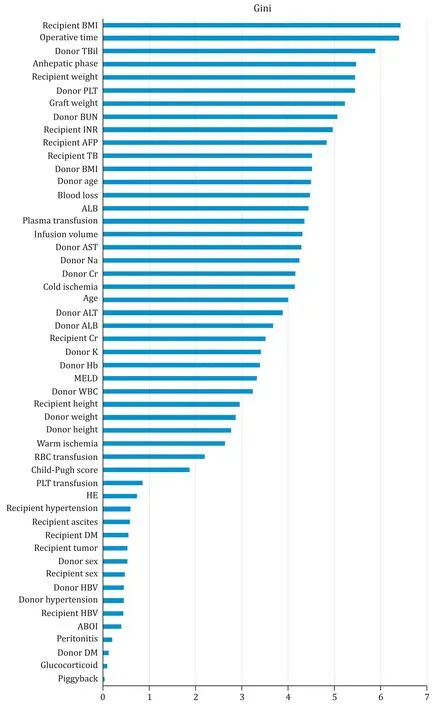
Fig.5.Important indicators plot of the random forest.BMI: body mass index; TBil: total bilirubin; PLT: platelet count; BUN: blood urea nitrogen; INR: international normalized ratio; AFP: alpha-fetoprotein; ALB: albumin; AST: aspartate transaminase; Na: sodium; Cr: creatinine; ALT: alanine aminotransferase; K: potassium ion; Hb: hemoglobin;MELD: model for end-stage liver disease; WBC: white blood cell count; HE: hepatic encephalopathy; DM: diabetes mellitus; HBV: hepatitis B infection; ABOI: ABO blood group incompatibility.
Comparing models based on different ML algorithms
The AUCs and accuracies of all ML algorithms and logistic regression models to predict AKI in the test dataset are compared in Table 3 and Fig.6.The random forest model demonstrated the highest prediction accuracy of 0.79 with the AUC at 0.850 (95%CI: 0.794–0.905),which was significantly greater than the AUCs of the other ML algorithms (P<0.001).The support vector machine model presented a moderate prediction accuracy of 0.68 with AUC at 0.727 (95% CI: 0.650–0.804).The model based on conditional inference tree showed a prediction accuracy of 0.64 with AUC at 0.621 (95% CI: 0.551–0.692).The classical decision tree showed the smallest AUC (0.500) with accuracy of 0.68 among all the ML algorithms,which was even worse than the logistic regression model with prediction accuracy of 0.63 and an AUC of 0.650 (95% CI:0.569–0.732).

Table 3 Comparison of area under receiver operating characteristic curve among the different models.

Fig.6.Comparison of AUCs among the different machine learning models and logistic regression model.RF: random forest; SVM: support vector machine; LR: logistic regression; CDT: classical decision tree; CID: conditional inference tree; AUC: area under the receiver operating characteristic curve.
Discussion
To the best of our knowledge,this is the first attempt to utilize ML-based methods in constructing predictive models for AKI following DCDLT.Our study demonstrated the development of AKI post-DCDLT with relatively high incidences and confirmed previous findings that the development of post-LT AKI is related to poor prognosis.
The supervised ML domain uses several methods for classification,such as classical decision trees,conditional inference trees,random forests,and support vector machines.We compared the predictive accuracy and AUC of the prediction models for AKI post-DCDLT between the ML algorithms and the traditional statistical approach.These results indicated that the random forest model for predicting AKI occurring after DCDLT has stronger predictive power than other models.
Random forest is an extension of traditional decision tree classifiers with an ensemble technique [27].Random forests can minimize the overfitting problem by taking the mode of decisions of a large number of these randomly generated trees [28-31].Studies have shown that,compared with other models,random forest can better predict the probability of AKI in ICU patients [32].In a study of AKI in inpatients,the random forest maintained calibration across the probability range,performing better than the regression model [33].Over time,the overprediction amplitude of the random forest model remained stable [33].Random forest showed the best predictive ability in our analysis,and may therefore result in significant improvement in the prediction of AKI after LT.All factors were used as predictive parameters in Table 1 to construct the random forest.It is much more effective when more variables are used for learning.
The importance of each variable in the dataset can be indicated by the characteristic importance measure,which can improve the transparency of the algorithm [30].Fig.5 demonstrates all the important indicators in our study.Recipient’s BMI,operative duration,and donor total bilirubin are considered the most important variables to classify the development of AKI by random forest.Overweight or obesity is one of the risk factors for AKI in critically ill trauma patients,cardiac postoperative patients,and patients undergoing other types of surgery [34-38].Obesityperseis associated with a chronic hyper-inflammatory status [39].Additionally,obese patients may have longer operative time due to the increased difficulty of surgery.It was confirmed by a long-term,clinically relevant model that obese swine undergoing the surgical procedure presented with attenuated kidney dysfunction and tissue apoptosis [40].Long operative duration might cause prolonged ischemia and hypoxia of the kidney during surgery,which impacts the kidney function [36].During the anhepatic phase of liver transplantation,the renal venous circuits are blocked,and kidneys are severely congested.This is consistent with the result of our random forest model that the anhepatic phase may play an important role.
The total bilirubin of the donor reflects the quality of the graft from some aspects.Donor total bilirubin was one of the independent risk factors in our logistic regression model,which indicates that donor liver function may affect the development of AKI.Although the graft function within seven days after transplantation was not included in the analysis,owing to the study design,the delayed recovery of the graft due to the preoperative graft functional defects may increase the incidence of AKI.
Logistic regression as a traditional statistical approach is widely used to model binary classification results [41-43].It is important to note that parameters that do not pass the significance test are not typically included in the logistic regression model from a predictive perspective.When there are too many variables without relevant information,they can be directly identified as noise in the model.Several studies have reported that the performance of logistic regression is not inferior to that of ML algorithms [14,15,44-46].However,our study demonstrated that the AUCs of random forest and support vector machine could be significantly greater than that of logistic regression in predicting AKI.This result is consistent with that of a study that included both deceased donor liver transplantation (DDLT) and living donor liver transplantation (LDLT) patients [47].
Decision tree,which includes classical decision tree and conditional inference tree analyses,did not perform well in our study.A decision tree is a hierarchical model.It recursively classifies independent variables into several smaller groups based on the Gini impurity measure or entropy [48,49].Decision trees can clearly and visually display the judgment process of results; however,they do not consider the clinical condition,and the value of the variable cut-off given by the decision tree is often difficult to explain.Additionally,decision tree models may not be useful if they include too many variables.Our study used 51 factors as predictive parameters,most of which had no statistical differences between the two groups.This may be one of the reasons why the decision tree model showed poor predictive value.
Our study has several limitations.First,it is an observational study from a single center with limited cases.Second,a primary limitation of ML algorithms is that they are best suited to predicting outcomes in the environment from which they are derived.This means that the capacity of ML algorithms might be diverse when they are applied to different institutions with a different distribution of covariates.Conversely,this limitation also has an advantage in that it is highly specific to the characteristics of a particular transplant center,enabling each transplant to make the best decision.The incidence of AKI after DCDLT is higher than that of donation after brain death (DBD) LT [3].The nomogram model based on logistic regression is quite common.Visualization,interpretability,and individualized prediction of the model are its main advantages,while weakness in processing high-dimensional data is its disadvantage.ML models,on the other hand,have the main advantage of processing large amounts of high-dimensional data,while their disadvantage is weak interpretability [50].The random forest model in our study provided some important variables,such as recipient’s BMI,operative duration,serum total bilirubin of the donor,anhepatic phase,and recipient’s body weight.A further prospective trial should evaluate whether the improvement of these variables could reduce the incidence of AKI after DCDLT.
In conclusion,the incidence of AKI after DCDLT is relatively high,and once AKI occurs,the survival rate of the patient decreases.Our study found that random forest can better predict the probability of AKI occurrence after DCDLT,providing a potentially useful tool for early clinical intervention of AKI to improve patient survival.More prospective studies are needed to validate our results.
Acknowledgments
We thank Dr.Hai-Jun Guo,Chao Wang,Min Zhang,Yan Shen,and Jian Wu from the Division of Hepatobiliary and Pancreatic Surgery,the First Affiliated Hospital,Zhejiang University School of Medicine,and Dr.Li-Na Shao from Nephrology Department of Zhejiang Provincial People’s Hospital for their invaluable contributions to this work.
CRediTauthorshipcontributionstatement
Zeng-LeiHe:Data curation,Formal analysis,Validation,Writing - original draft.Jun-BinZhou:Data curation,Project administration,Resources,Writing - original draft.Zhi-KunLiu:Methodology,Writing - original draft.Si-YiDong:Software,Writing - original draft.Yun-TaoZhang:Data curation,Project administration.TianShen:Methodology,Writing - original draft.Shu-SenZheng:Supervision,Writing - review & editing.Xiao Xu:Conceptualization,Funding acquisition,Supervision,Writing -review & editing.
Funding
This study was supported by grants from the National Science Fund for Distinguished Young Scholars (81625003),the National Natural Science Foundation of China ( 81930016),and the National Science and Technology Major Project (2017ZX10203205).
Ethicalapproval
Ethical clearance and approval were obtained from the Clinical Ethics Review Board of The First Affiliated Hospital,Zhejiang University School of Medicine.Informed consent was obtained from all donors or their relatives and recipients before transplantation.All liver transplantations were performed with organs from voluntary donations made by deceased donors.
Competinginterest
No benefits in any form have been received or will be received from a commercial party related directly or indirectly to the subject of this article.
Supplementarymaterials
Supplementary material associated with this article can be found,in the online version,at doi:10.1016/j.hbpd.2021.02.001.
杂志排行

Hepatobiliary & Pancreatic Diseases International的其它文章
- Cross-talk between hepatic stellate cells and T lymphocytes in liver fibrosis
- Diabetes mellitus is a risk factor of acute kidney injury in liver transplantation patients✩
- Hepatobiliary&Pancreatic Diseases International
- Postoperative adjuvant transcatheter arterial chemoembolization improves the prognosis of patients with huge hepatocellular carcinoma
- The effects of stereotactic body radiotherapy on peripheral natural killer and CD3 + CD56 + NKT-like cells in patients with hepatocellular carcinoma
- ATP-citrate lyase regulates stemness and metastasis in hepatocellular carcinoma via the Wnt/ β-catenin signaling pathway