Comparison of distance visual acuity measurement between dynamic optotype and LogMAR E charts
2021-07-16,
,
School of Optometry,The Hong Kong Polytechnic University,Centre for Eye and Vision Research,Hong Kong 810005,China
[Abstract] Objective To investigate if the dynamic optotype is comparable with conventional logarithm of the minimum angle of resolution(LogMAR)optotype. Methods This is a cross-sectional study investigating visual acuity measurement with two methods.The study lasted for 6 months from May to November 2017.One hundred and fifty subjects(150 right eyes)with age(58.7±14.3)years were recruited in the Optometry Clinics of the School of Optometry,The Hong Kong Polytechnic University.Habitual distance visual acuity of each eye was measured with a 3-meter LogMAR E chart and a Dyop® acuity chart displayed on a monitor placed at 6 meters,respectively.Subjects were asked to comment on the Dyop® system regarding the overall speed and ease of understanding the test using a 5-point Likert scale.The agreement between the two charts was assessed.This study was approved by an Ethics Committee of The Hong Kong Polytechnic University(No.HSEARS20170215006)in accordance with the Declaration of Helsinki,and written information consent was obtained from all the subjects prior to any ocular examination. Results The mean difference between the LogMAR E chart and Dyop® system was(0.05±0.07)LogMAR units,and the 95% limits of agreement was-0.09 to 0.19.The intra-class correlation coefficient of the two methods was 0.957.In general,70%(105/150)of the subjects considered the Dyop® system fast and 81%(121/150)easy to understand. Conclusions Visual acuity measured by the Dyop® system is comparable to the traditional LogMAR E chart.
[Key words] Visual acuity;Optotype;Dynamic acuity test;Consistency
Vision impairment is one of the important public health issues,and 285 million people suffer from vision impairment globally,with a prevalence ranging from 5.2% to 26.5% across countries[1].Early detection and management of vision impairment is necessary to prevent avoidable visual loss,and vision-related and health-related quality of life[2-5].Visual acuity measurement investigates visual function and monitors changes in central vision from time to time.Visual acuity measurement needs to be efficient and easy to understand,especially in the underserved areas where resources are insufficient.There are a number of standard visual acuity charts available using optotypes that include letters,numbers,Tumbling E and Landolt C.Logarithm of the minimum angle of resolution(LogMAR)acuity chart has overcome the limitation of the Snellen chart that the progression in letter size of each line is standardized.It is frequently used in clinical trials and clinical practices where precise documentation of visual acuity is necessary.However,conventional methods of visual acuity measurement are sometimes difficult for individuals who are illiterate.
Hytowitz designed a new dynamic optotype called the “Dyop®”,which is a rotating and segmented visual stimulus to measure visual acuity.Visual acuity can be measured by varying the diameter and contrast of the targets.Image diameter is adjusted by angular arc width and calibrated with the viewing distance to measure the acuity threshold.The acuity endpoint is determined by the minimum stimulus area which the Dyop®segment motion can be perceived.When the threshold is reached,the respondent should perceive a non-moving target.The Dyop®system can be used to measure distant and near visual acuities by varying the working distance and screen size of projection.It can be used in conjunction with either a computer monitor or a smartphone.Dyop®may be an alternative to measure visual acuity which is independent of culture,literacy,and language,if the acuity measured is comparable with the conventional methods.Harrisetal[6-7]performed pilot studies to validate visual acuity measurements with the Dyop®system.They found it was comparable to measurement with Sloan letters,though the comparison was between dynamic and static acuity.The purpose of this study was to compare visual acuity measurement with Dyop®and the LogMAR E chart and see if Harris's finding is repeatable.
1 Materials and Methods
1.1 General information
Across-sectional study was performed in this study.One hundred and fifty healthy subjects aged 18 or above were recruited in the Optometry Clinics of the School of Optometry,The Hong Kong Polytechnic University from May to November 2017,including 72 males and 78 females,with an average age of(58.7±14.3)years.All the right eyes of the subjects went through comprehensive eye examinations performed by optometrists.Those with Parkinson's disease and/or Alzheimer's disease were excluded as these respondents may have difficulties in motion perception[8-9].This study adhered to the Declaration of Helsinki.The study protocol was approved by an Ethics Committee of The Hong Kong Polytechnic University(No.HSEARS20170215006).Information sheets were given to all subjects explaining the purpose of the study and written informed consents were obtained.
1.2 Methods
During the data collection,habitual distance visual acuity of the right eye was measured with a 3-meter LogMAR E chart[10]and a Dyop®system(Figures 1 and 2)displayed on a monitor placed at 6 meters away from each subject.The visual acuity data were presented in LogMAR units with E chart and arc minutes with Dyop®.A high contrast black and white Dyop®target was used with the rotating figure appearing on a 50% grey background.Dyop®acuity was collected in arc minutes,representing the visual angle of the outer diameter of the circular optotype.To convert Dyop®in arc minutes to LogMAR unit,a graph was plotted by using the data provided by the Dyop®system and an equation(LogMAR acuity=0.767 4×In[Dyop®arc minute]-1.560 2).Subjects were asked about their comments to Dyop®regarding the overall speed and ease of understanding the test using a 5-point Likert scale.
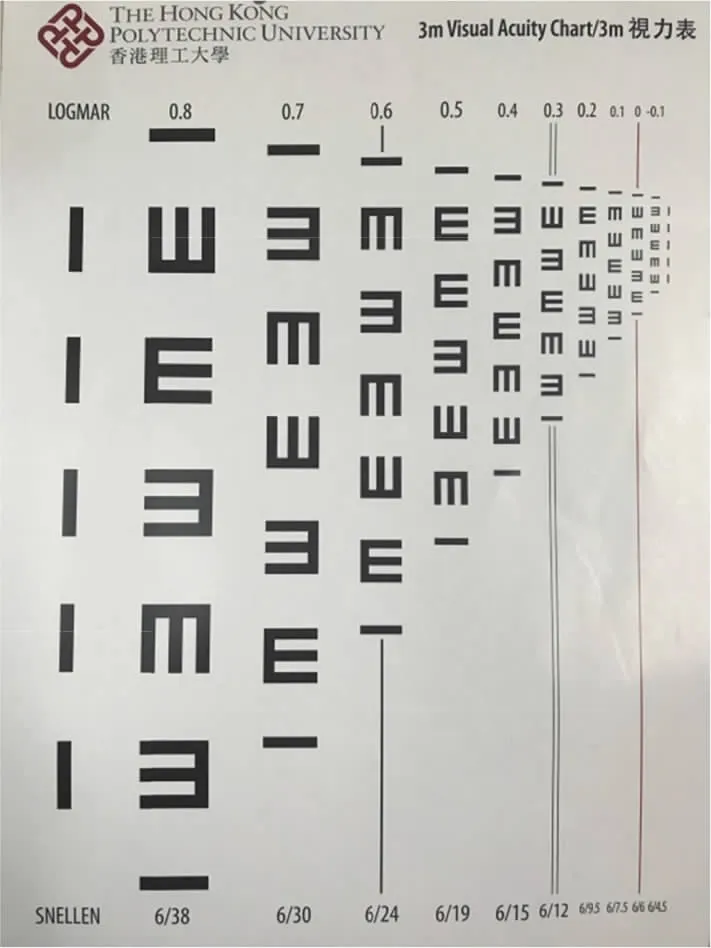
Figure 1 LogMAR E chart
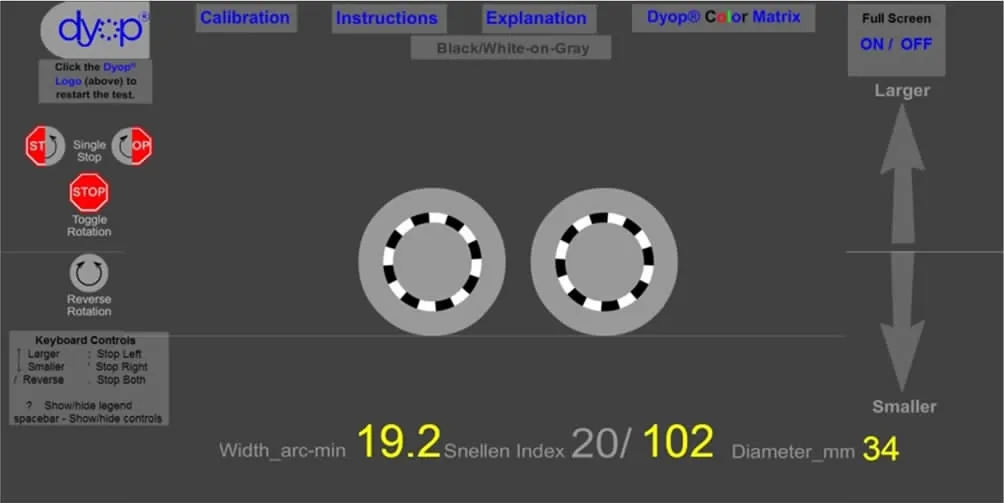
Figure 2 Dyop® acuity chart
1.3 Statistical analysis
Data were analyzed using IBM SPSS Statistics version 23.0 software.Intra-class correlation and Bland-Altman plots were used to assess the association and determine the 95% limits of agreement between LogMAR E chart and Dyop®acuity chart.The association between age and preference of acuity chart was tested by an independent samplettest.Rankings to Dyop®system were presented by descriptive analysis.APvalue<0.05 was considered statistically significant.
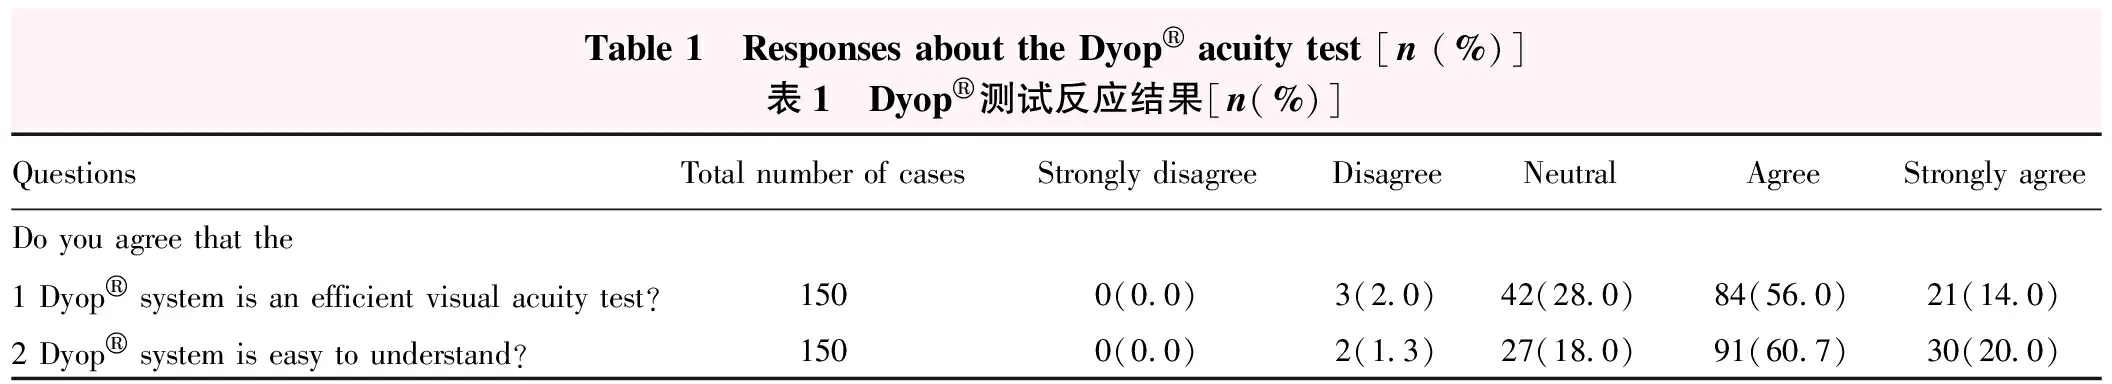
Table 1 Responses about the Dyop® acuity test [n (%)]表1 Dyop®测试反应结果[n(%)]QuestionsTotal number of casesStrongly disagreeDisagreeNeutralAgreeStrongly agreeDo you agree that the1 Dyop® system is an efficient visual acuity test?1500(0.0)3(2.0)42(28.0)84(56.0)21(14.0)2 Dyop® system is easy to understand?1500(0.0)2(1.3)27(18.0)91(60.7)30(20.0)
2 Results
2.1 Agreement of these two acuity charts
All subjects completed the comprehensive eye examinations and visual acuity tests with Dyop®acuity test.The mean visual acuity measured with LogMAR E chart was 0.11±0.18(-0.14 to 0.80).The mean visual acuity measured with Dyop®system was 0.16±0.16(-0.02 to 0.93).The mean difference between the LogMAR E chart and Dyop®system was(0.05±0.07)LogMAR,and the 95% limits of agreement was-0.09 to 0.19(Figure 3).The intra-class correlation coefficient of the two measurements was 0.957.Despite the few outliers,Bland-Altman plots showed the visual acuity difference was within 95% limits of agreement across visual acuity measured.There was larger variation when mean visual acuity was around 0.00 LogMAR.
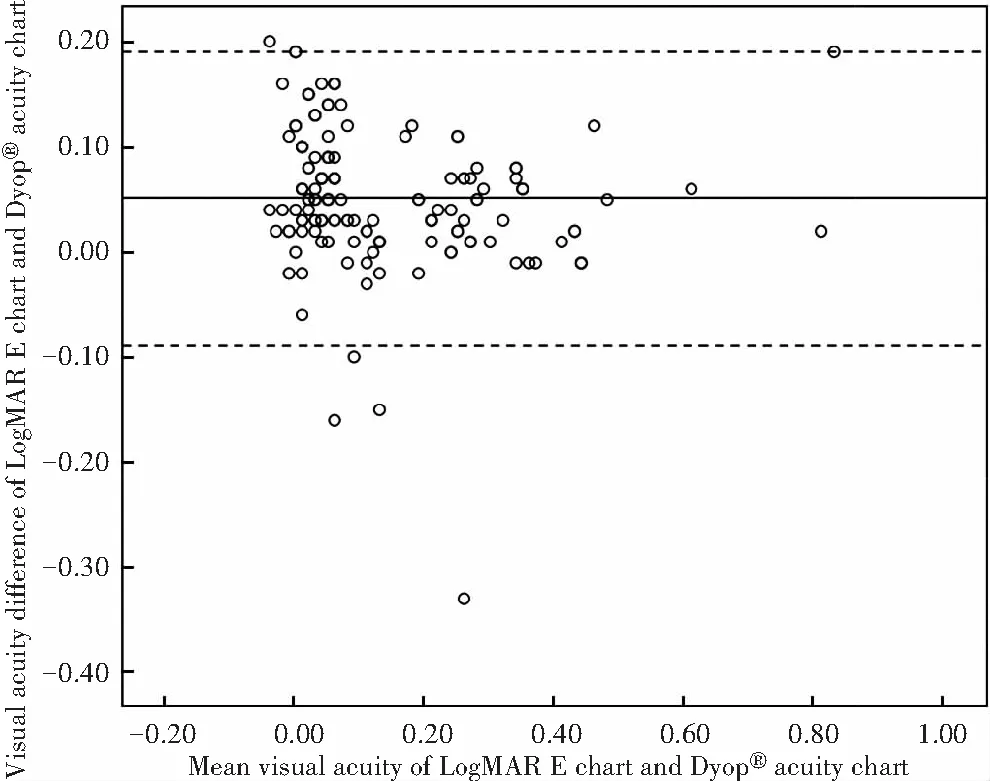
Figure 3 The agreement of LogMAR E chart and Dyop® system(Bland-Altman plot,n=75) The 95% limits of agreement was-0.09 to 0.19,with 91%(68/75)plots within 95% limits of agreement
2.2 Preference to the chart
In general,39%(59/150)of subjects preferred Dyop®to LogMAR E chart.They responded the Dyop®system was fast(93%,55/59)and easy to understand(97%,57/59).And 39%(58/150)of subjects preferred LogMAR E chart instead,while 22%(33/150)did not have a specific preference.There was a significant difference in age of subjects choosing either the Dyop®system or the LogMAR E chart,with a significant difference between them(56.0±14.8vs.63.9±12.7;t=-3.10,P<0.01).In general,70%(105/150)of all the subjects considered the Dyop®system fast and 81%(121/150)easy to understand(Table 1).
3 Discussion
Visual acuity measurement is a fundamental procedure of eye examinations performed by eye care professionals and trained healthcare workers.The measurement needs to be efficient,easy to understand and precise.The results should be comparable with other visual acuity tests.The results of this study showed strong correlation of visual acuity between Dyop®system and LogMAR E chart.The difference of results was similar across the range of visual acuity measured as shown in Bland-Altman plots.Since the LogMAR E chart used in this study correlates with Sloan letters[10],our findings of Dyop®system can therefore be said to correlate well with Sloan letters.Harrisetal[6-7]presented comparison of Dyop®optotype to Sloan letters.They assessed the visual acuity changes while inducing blur with different power of positive lenses.Dyop®system was found to achieve a higher level of accuracy with increased blur than Sloan letters according to Harris[7].There were 19% of subjects who had equal or better visual acuity with increased blur in the Sloan test,while there were only 2% in the Dyop®test.Apart from visual acuity measurement,Dyop®could also be used for subjective refraction measurement.Determination of refractive error using the Dyop system and the conventional Snellen letter chart respectively yielded comparable results[11].
Regarding the preference of visual acuity tests from the subjects,one-third of the subjects preferred the Dyop®test though some of them did not have a specific preference.Subjects in the older age group preferred the LogMAR E chart.Some subjects found it was difficult with the Dyop®test to differentiate if the circular target was twinkling or rotating when approaching the threshold.The same subjects reported that more concentration was required in the Dyop®test when compared with LogMAR E chart.However,in general,most of the subjects appreciated the fast measurement with the Dyop®system.
Although our study is comparing visual acuity measurement between dynamic and static acuity tests,it is useful to know that the results are comparable.Further research is needed to investigate the underlying mechanism in motion perception and compare the variation of measurement results with different levels of visual acuity.
Visual acuity measured by theDyop®system was comparable to the traditional LogMAR E chart.The measurement with the Dyop®system is generally faster and easier to understand.It can be considered as an alternative method in visual acuity measurement.
Conflictsofinterest:All authors declare that there is no conflict of interest
Acknowledgement:We thank A.Hytowitz for providing us the Dyop®acuity programme