Individual-tree diameter growth model for Korean pine plantations based on optimized interpolation of meteorological variables
2021-07-15ManWangYinghuiZhaoZhenZhenXingjiJin
Man Wang·Yinghui Zhao·Zhen Zhen·Xingji Jin
Abstract To explore the influence of meteorological variables on the growth of Korean pine (Pinus koraiensis Sieb.et Zucc.) plantations and provide a scientific reference for the production and management of Korean pine,three approaches to interpolate meteorological variables during the growing season (i.e.,May–September) were compared in Heilongjiang Province,China.Optimized meteorological variable interpolation results were then combined with stand and individual tree variables,based on data from 56 sample plots and 2886 sample trees from Korean pine plantations in two regions of the province to develop an individualtree diameter growth model (Model I) and an individualtree diameter growth model with meteorological variables(Model II) using a stepwise regression method.Moreover,an individual-tree diameter growth model with regional effects(Model III) was developed using dummy variables in the regression,and the significance of introducing these dummy variables was verified with an F-test statistical analysis.The models were validated using an independent data set,and the predictive performance of the three models was assessed via the adjusted coefficient of determination () and root mean square error (RMSE).The results suggest that the growth increment in tree diameter of Korean pine plantations was significantly correlated with the natural logarithm of initial diameter (ln D),stand basal area (BAS),logarithmic deformation of the stand density index (ln SDI),ratio of basal area of trees larger than the subject tree to their initial diameter at breast height (DBH) (BAL/ D),and the maximum growingseason precipitation (Pgmax).The individual-tree diameter growth models of Korean pine plantations developed in this study will provide a good basis for estimating and predicting growth increments of Korean pine forests over larger areas.
Keywords Mixed interpolation·Korean pine plantations·Individual-tree diameter growth model·Regional effects
Introduction
Korean pine (Pinus koraiensisSieb.et Zucc.) is widely distributed in the Korean Peninsula,the Russian Far East,and in Northeast China (Li et al.2020).China has been planting Korean pine for more than 80 years.As one of three major coniferous trees in Northeast China,Korean pine is a commercial and landscape species for industrial utilization that promotes sustainable development of the forestry economy(Jin et al.2017).In Heilongjiang Province of China,the plantation area with Korean pine is around 172,400 ha,which is 63.3% of the total area of Korean pine plantations in Northeast China (State Forestry Administration 2014).Therefore,sustainable and precise forest management plans are needed for Korean pine in Heilongjiang Province.Since the growth of forest stands is a complex,long-term process,growth and yield models are needed as a basic approach to understand and predict forest growth and change,which then helps forest managers to develop reasonable and sustainable management programs (Fabbio et al.2018).
Individual-tree growth models (Lawrence and Davis 2005) are based on individual trees to simulate tree growth,i.e.,diameter at breast height (DBH) and height (Vanclay 1994),essential inputs for growth and yield models.Unlike tree-level models,individual-tree models do not include increasing detail on crown structure and branching characteristics (Mitchell 1988;Vanclay 1988).The growth information and patterns for individual trees are of great significance to forest management.The research on the individual-tree growth rules in forest stands can help forest manager to select the species for logging or protection to better set the logging cycle and formulate a silvicultural treatment scheme (Adame et al.2008).Compared with other growth and yield models,individual-tree growth models are usually more accurate for short-term predictions (Burkhart 2003).Furthermore,individual-tree growth models contain some statistical prediction variables for individual trees,which are more complex and have a higher level of detail (Mabvurira and Miina 2002;Campos and Leite 2006).Accordingly,growth potential and various influencing variables on the growth of individual trees can be predicted and evaluated.Consequently,individual-tree growth models of Korean pine that precisely master the growth rules and improve the yield of Korean pine plantations would be of great value.
Over recent decades,the considerable efforts to develop individual-tree growth models have focused on comparing different modeling methods and selecting either modeldependent variables or independent variables.Regression analysis,the most common method for estimating individual-tree growth,relates easily measured variables to other structural and functional characteristics (Liu et al.2014;Ma et al.2015).In general,compared with the measurement of other field inventory variables,the measurement of DBH is more direct and accurate.Therefore,the availability of information on diameter incremental growth and growth patterns for individual trees is an important asset in sustainable forest management,which allows the selection of tree species for logging or protection as well as the estimation of cutting cycles and the prescription of silvicultural treatments (Adame et al.2008).The growth of tree diameter or tree trunk area is usually used to represent the dependent variable in individual-tree diameter growth models (Wykoff1990;Zhao et al.2004).Furthermore,variables for modeling diameter growth are often measured several times for the same experimental procedure and repeatedly correlated with observations (Fox et al.2001).Considering that the diameter growth increment (DGI) should be ≥ 0,and avoiding the incalculability of ln (DGI=0) as well as negative values of ln DGI (Calama and Montero 2005;Li 2012) before the number transformation,the logarithmic value of the square root growth amount of 1,i.e.,ln (DGI+1),is used as the dependent variable in the model.The DGI of individual trees is generally affected by three groups of variables:size variables for individual trees,site variables,and competitive variables (Zhao et al.2013).
Traditionally,meteorological variables are not included in diameter growth models.As a result,predictions based on such models are insensitive to climate change.In recent years,an increasing number of researchers have realized that climate change will affect seedling establishment (Daniels and Veblen 2004),tree growth (Brooks et al.1998;Gordon and Will 2012),and mortality (McDowell et al.2011),as well as tree species distribution and competition among species (Hamann and Wang 2006).Information concerning the climate-growth relationship can provide valuable insight to forest managers for formulating forest management strategies for sustainability (Worbes 1999) or adapting to climate change (Littell et al.2011).Consequently,it is essential to broaden our understanding of the relationships between climate change and tree growth;in particular,the spatial heterogeneity of meteorological variables caused by changing environmental patterns and the factors affecting forest growth and their sensitivity to climatic variables (Aber et al.2001;Deslauriers et al.2003;Crookston et al.2010).Meteorological variables are restricted by both planetary wind and barometric pressure belts on a large scale and by natural environment and human activities on a small scale,which is typical for regional variables (Yue et al.2005).To obtain data for meteorological variables on the regional scale,however,it is crucial for the interpolation method that the meteorological variable data originate from discretely distributed meteorological stations,a requirement that is currently constrained by economic and technical limitations.Furthermore,interpolation results are also affected by factors such as spatial variability,density,and spatial correlation of sampling points.Researchers have investigated many methods for improving the traditional interpolation method and the accuracy of the interpolation results.Improvements to the interpolation method mainly include upgrading interpolation models (Nalder and Wein 1998),optimizing or transforming modeling data (Genton and Furrer 1998),and adding influential variables to the interpolation model(Daly 2006).In addition,some researchers have combined traditional statistics with geostatistics to explore a new,comprehensively mixed interpolation method (Joly et al.2011;Zhao et al.2018),an approach that has developed rapidly in recent years.Consequently,this comprehensive method improves the interpolation by explaining the hidden information contained in the residual results of traditional statistical methods.
In addition to the drawbacks associated with geographical and environmental variations,different study areas will introduce regional effects into the models (Li and Hong 2012).Use of traditional methods,little consideration of data correlation,and inadequate consideration of differences among regions,sample plots,or even sample trees will result in large prediction deviations (Chen et al.2017).Over the last decade,the dummy variable model has become popular for efficiently dealing with regional effects on models (Chen et al.2017;Zhang et al.2017).To verify the necessity of referencing dummy variables,theF-test statistic is used to analyze the difference between dummy variable models and basic models (Zeng et al.2017).Although the introduction of dummy variables can make linear regression models more complicated,the problem description is more concise,and the development of regional compatibility models is closer to reality.Accordingly,dummy variables based on regional characteristics should further improve the accuracy of individual-tree diameter growth models (Zhang et al.2017).
In this study,we compared the interpolation effects of three interpolation methods–ordinary kriging (OK),multivariate linear regression (MLR),and regression kriging(RK)–on meteorological variables of the Korean pinegrowing season (May–September) in Heilongjiang Province.The optimized interpolation results were then used and combined with digital elevation model (DEM) data and data for 56 sample plots of Korean pine plantations from Mengjiagang Forest Farm,Jiamusi City,and Liangshui National Nature Reserve in Heilongjiang Province during two periods.Development of the individual-tree diameter growth model included four groups of variables:individual tree size variables,site variables,competitive variables,and meteorological variables.Moreover,a dummy variable model with regional effects was developed,and theF-test statistic was utilized to validate the predictor differences in the two study areas.Our objectives were (1) to compare the efficacy of the three interpolation methods,(2) to explore the influence of meteorological variables on growth of Korean pine plantations,and (3) to provide a scientific reference for the production and management of Korean pine in Heilongjiang Province.
Materials and methods
Study area
We developed individual-tree diameter growth models of Korean pine plantations for two study areas in Heilongjiang Province:the Liangshui National Nature Reserve and Mengjiagang Forest Farm (Fig.1).Both study areas are typical forests in Northeast China (Zhen et al.2013).
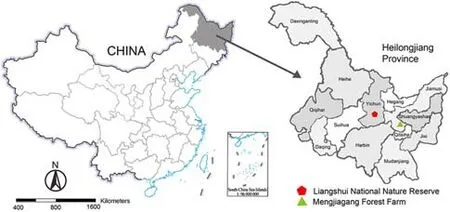
Fig.1 Locations of study areas in Northeast China
Liangshui National Nature Reserve is located between 47°6′49″N and 47°16′10″N,128°47′8″E and 128°57′19″E in Dailing District,Yichun,Heilongjiang Province,China.The total area of the nature reserve is 121.33 km2,with 98%forest coverage.It is known as the home of Korean pine(P.koraiensis).In addition to Korean pine,Korean spruce(Picea koraiensis),larch (Larix gmelinii),fir (Abies nephrolepis),the main tree species comprise more than 20 temperate broadleaf tree species such as white birch (Betula platyphylla),and Ussuri poplar (Populus ussuriensis).
Mengjiagang Forest Farm is located between 46°20′16″N and 46°30′50″N,130°32′42″E and 130°52′36″E in Jiamusi,Heilongjiang Province,China.The total area of Mengjiagang Forest Farm is 162.74 km2,with a total forest volume of 0.64 million m3.Mengjiagang Forest Farm has the main stand of Korean pine (P.koraiensis) in Northeast China and is codominant with larch (L.gmelinii) and Mongolian Scots pine (Pinus sylvestrisvar.mongolica Litv.),all of which account for 80% of the forest area in this study area.
Field inventory data
In this study,56 sample plots of Korean pine plantations from the field inventory of Mengjiagang Forest Farm (39 sample plots) were used in 2014 and 2017 and from Liangshui Nature Reserve (17 sample plots) in 2014 and 2018.The area of each plot was 0.06 hm2(20 m × 30 m),and 2886 trees from the 56 plots were measured for tree height (m)and DBH (cm),and the species,number of trees,and tree state were recorded.Additionally,mean DBH (cm),mean height (m),mean age (year),site class index (SCI) (m),stand density index (SDI),stand basal area (BAS) (m2ha‒1),and basal area of trees larger than the subject tree (BAL) (cm2)were calculated for each plot.The descriptive statistics of the main variables are listed in Table 1.The 2886 trees were randomly divided into 75% and 25% of their total number,i.e.,2165 trees were used for the model fitting data and 721 trees for the model validation data.

Table 1 Descriptive statistics of the variables used in this study
Digital elevation model data
Digital elevation model (DEM) data were acquired from a DEM product with global 30-m resolution shared by the Geospatial Data Cloud (https://www.gsclo ud.cn/).The elevation(m),slope (°),and aspect (°) of each plot were then extracted by applying the spatial analyst tool in the ArcGIS 10.3 software (Esri,Redlands,CA,USA).Due to the large area of Heilongjiang Province,the Albers projection was used.The descriptive statistics for the main variables used in this study are listed in Table 1.
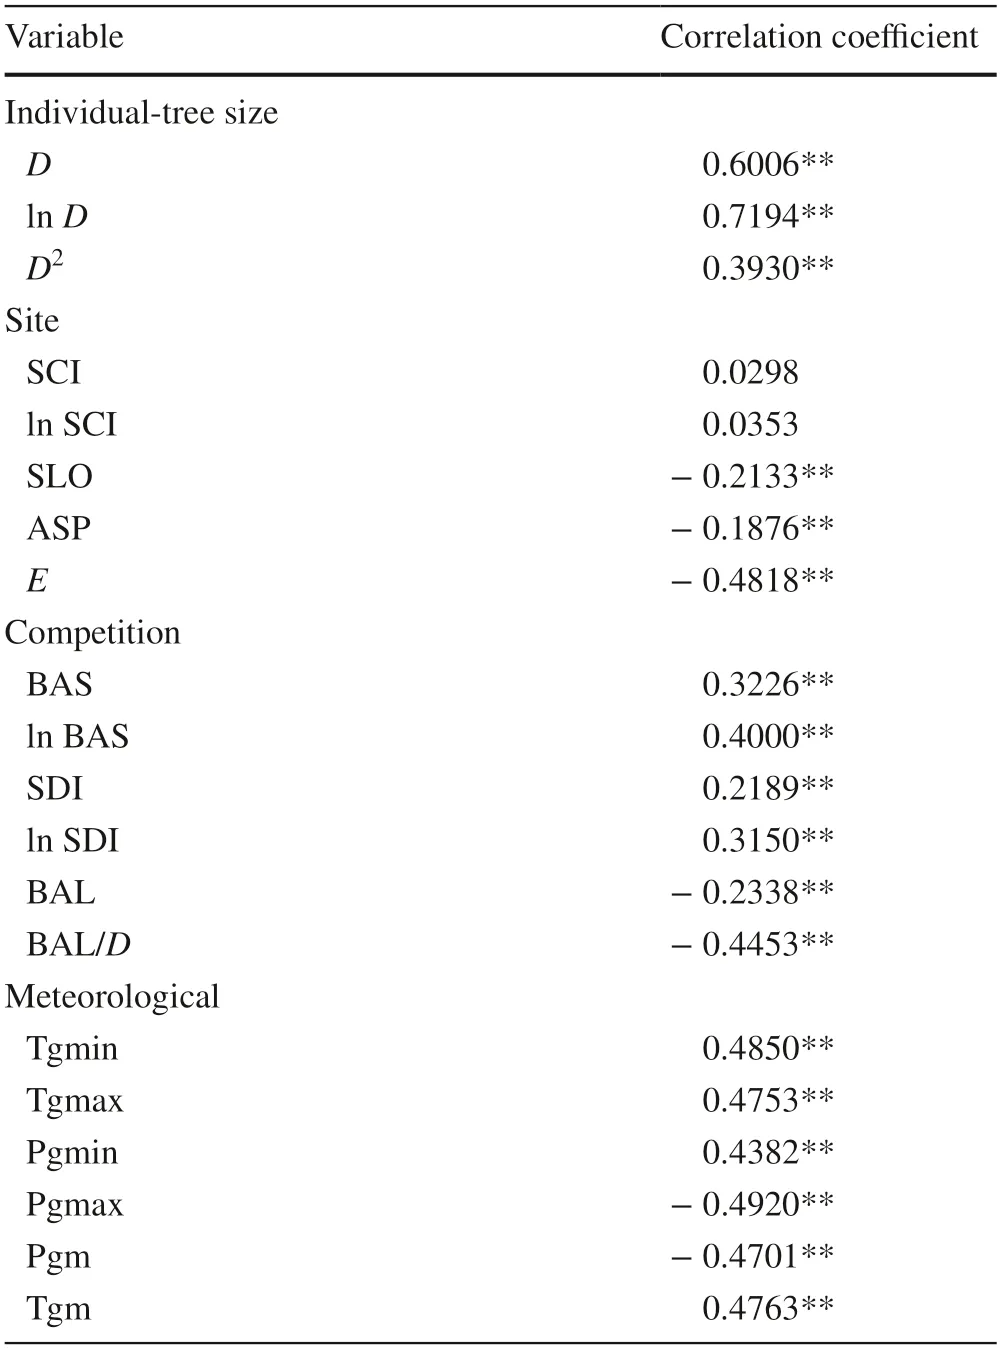
Table 2 Correlation coefficient between diameter (D) growth and influencing variables by stepwise
Meteorological data
The meteorological data,acquired from the China Meteorological Data Service Center (CMDC) (https://data.cma.cn/),consisted of ASCII files,including monthly mean temperature (0.1 °C) and monthly mean precipitation (0.1 mm).Additionally,descriptive information for 32 meteorological stations,including number,name,latitude (°),longitude (°),and elevation (0.1 m),was simultaneously acquired for Heilongjiang Province from 2014 to 2018.After the removal of 1 outlier due to lack of information,31 meteorological stations were ultimately retained to meet statistical assumptions for meteorological variables interpolation (Fig.2).Since Heilongjiang Province experiences a continental climate characterized by cold winters and warm summers,with maximum precipitation in the summer,the growth period of the Korean pine plantations is mainly concentrated in the summer,and our field inventory time was also concentrated in either July or August.Correspondingly,the growing season was selected as the study period for the meteorological variables for the Korean pine plantations,i.e.,the monthly mean temperature and precipitation values from May to September.
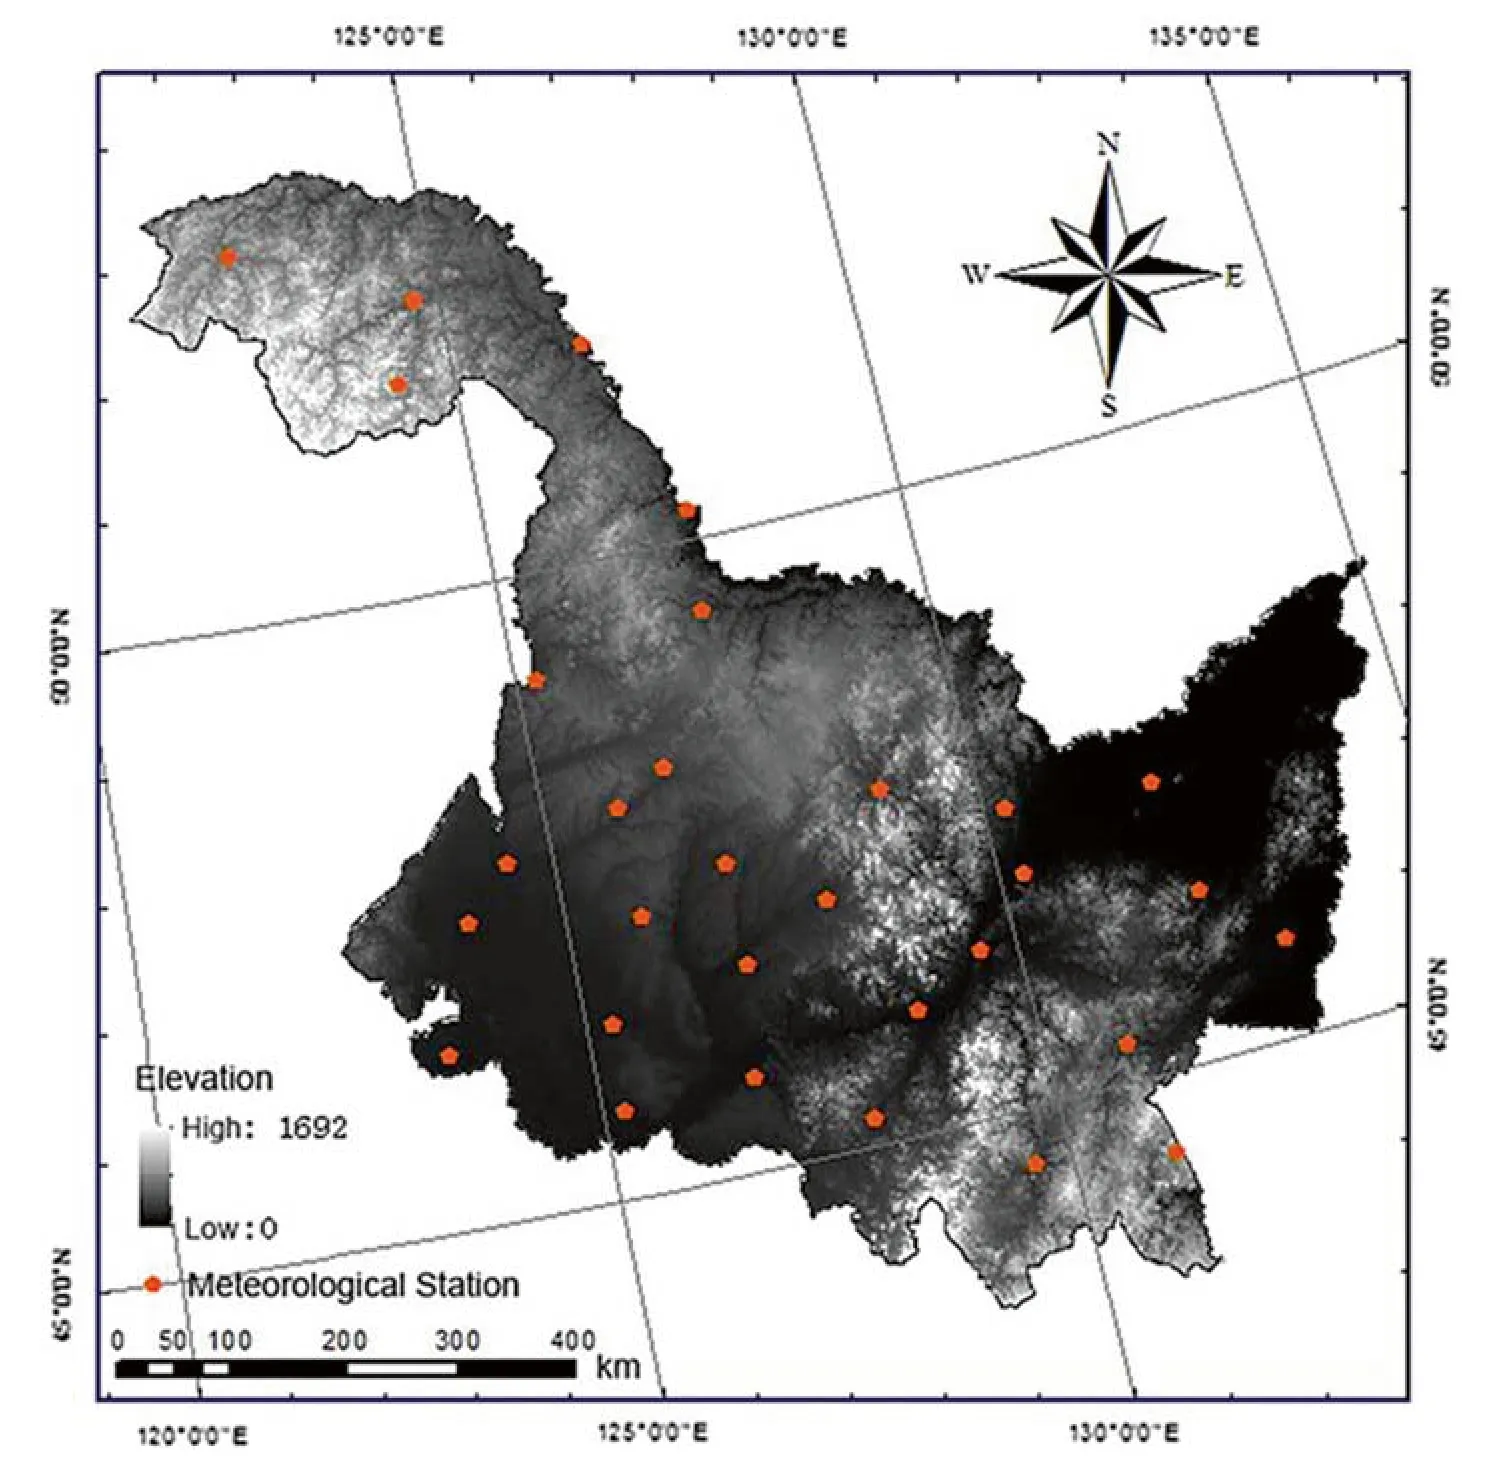
Fig.2 Distribution map of meteorological stations in Heilongjiang Province
Meteorological data analyses
To satisfy the basic requirements of interpolation theory and eliminate the possible proportional effect of variograms,we needed to conduct spatial exploratory analyses,including frequency analysis,spatial trend analysis,and spatial autocorrelation analysis,of the meteorological data before interpolation (Wu and Yan 2007).
Frequency histograms were generally used to visualize normality of the meteorological data,while trend analysis charts were used to judge the spatial trends of the meteorological data.Spatial autocorrelation of geographic data is the basis of spatial interpolation and can improve the accuracy of spatial interpolation (Getis and Ord 1992).To analyze the spatial autocorrelation of the meteorological data,we used Moran’s index (Moran’sI) (Zhao et al.2013).Moran’sIranges from −1 to 1,values > 0 indicate a positive correlation (aggregation),< 0 a negative correlation (discrete).A larger value indicates a greater correlation of spatial distributions,while values approaching 0 indicate spatial distributions closer to random.
For preventing inter-factor collinearity from affecting model accuracy,the collinearity of the predictors should be investigated with the multivariate linear regression (MLR)model.Thus,collinearity analysis was performed using the variance inflation factor (VIF) and tolerance.The VIF refers to the ratio of the variance between variables with andwithout multiple collinearity,while tolerance is the reciprocal of the VIF (Miles 2005).
Interpolation and verification of meteorological variables
Ordinary kriging (OK) is an interpolation method based on geostatistics that is commonly used to interpolate meteorological variables for estimating the value of spatial variables based on the intrinsic relationships between regionalized variables represented by variograms according to the values of adjacent variables (Delrieu et al.2014).Multivariate linear regression (MLR) is an interpolation method that takes topological factors that affect meteorological variables,such as latitude,longitude,elevation,slope,and aspect,as independent variables to obtain the dependent variables (meteorological variables) (Hay et al.1998).A MLR follows the basic conditions of multiple regression methods,such as the significance of independent variables and the consideration of collinearity (Yun et al.2009).
Recently,studies on interpolation methods have revealed that mixed methods,i.e.,techniques that combine geostatistics with traditional statistics,can effectively improve the interpolation results by compensating and correcting the residuals from the results of traditional statistical methods (Vicente-Serrano et al.2003).As a mixed method,regression kriging(RK) improves upon the MLR method by applying the OK method to the measured point residuals of the MLR results(Zhao et al.2018).The residual values of the MLR results at the measured points may contain some variables that are not explained by the regression model.The OK method was applied to the residual of the measured points,and the MLR results were added together to improve the results.The equation is expressed as:
whereZRK(x) is the result of the RK method,ZMLR(x) is the estimated value of the MLR result,ande(x) is the compensating correction factor of the residual value of the MLR results for pointxbased on the OK method.
Cross-validation (Cawley and Talbot 2004) is a common method to validate the accuracy of the spatial interpolation.Specifically,in this study,the leave-one-out cross-validation (LOOCV) was adopted,in which each measured point participates in the accuracy validation,an approach that exhibits good stability for fewer measured points.The mean absolute error (MAE) and root mean square error (RMSE) were used to validate the interpolation accuracy.
Model development
To explore the influence of meteorological variables on the growth process of Korean pine plantations,we also added meteorological variables to the model as a group of variables based on three other traditional groups of variables,individual trees size variables,site variables,and competitive variables.On the basis of previous studies (Calama and Montero 2005;Li 2012),we chose the logarithmic value of the square root growth amount of 1,i.e.,ln (DGI+1),as the dependent variable of the models.The ordinary least squares(OLS) multiple regression method determines the best fit for a straight line that minimizes the sum of the squared deviations of the observed data values (dependent variables only) away from that line.The general forms of the basic individual-tree diameter growth model and the model containing the meteorological variable equations fitted by OLS multiple regression are expressed as:

whereais the model regression coefficient,DGI is the diameter growth increment of a 3-year or 4-year period (cm),f1(SIZE) is the function of the tree size variables,f2(COMP)is the function of the competitive variables,f3(SITE) is the function of the site variables,f4(CLIM) is the function of the meteorological variables,andεis the model error term.
Apart from the measured and computed variables,the following variables or their inverse transformations were selected because these variables had been proven to have important effects on individual-tree diameter growth(Calama and Montero 2005;Uzoh and Oliver 2008).By defining the relationship between diameter increment and individual-tree size,we also directly selected DBH (D),the natural logarithm of DBH (lnD),and the square of DBH(D2) as variables.To adequately describe the tree diameter increment,the model must include some site variables,such as SCI,logarithmic site class index (ln SCI),slope (SLO),aspect (ASP),and elevation (E).Meanwhile,the ratios of basal area in larger trees to initial DBH (BAL/D),as well BAS and SDI,along with their natural logarithms and transformations,were utilized as the tree competitive variables,since they describe a tree’s competitive position in relation to all trees in a plot/stand (Uzoh and Oliver 2008 ;Lhotka and Loewenstein 2011).The largest tree in terms of DBH would have a BAL value of 0,while the smallest tree would have the largest BAL value in a plot.Based on the optimization interpolation method that compares the results of monthly mean temperature (Tgm) and monthly mean precipitation(Pgm),four other types of meteorological variables were interpolated and extracted for the diameter growth model of Korean pine plantations,including temperature-related variables such as monthly maximum temperature (Tgmax) and monthly minimum temperature (Tgmin),and precipitationrelated variables such as monthly maximum precipitation(Pgmax) and monthly minimum precipitation (Pgmin).
To analyze climatic and stand impacts on the growth process of individual trees,we analyze the variables that were highly significantly correlated with the dependent variables.The results of this correlation analysis are given in Table 2.

Table 3 Spatial autocorrelation test results for meteorological variables during the Korean pine plantations growing season in Heilongjiang Province
To avoid multicollinearity between independent variables,we utilized the variance inflation factor (VIF < 10),which provides an index that measures the amount that the variance of an estimated regression coefficient is increased as a result of collinearity.In addition,we took biological reasonableness into account and tested for significant (p< 0.01)correlations between independent variables.To identify variables that would be useful in the model,the variable selection process involved a series of steps beginning with the stepwise regression method together with VIF control,such that variables with larger VIFs were excluded.Ultimately,variables with weak collinearity that provided large contributions to diameter increment were retained.
As a result,the basic model and the individual-tree growth model containing meteorological variables can be expressed as Eqs.(4) and (5),respectively:

wherea k(k=0,1,2,3,4,and 5) is the model coefficient for thekth predictor,DGI is the diameter increment of a 3 or 4-year period (cm),Dis the initial DBH (cm),BAS is the stand basal area (m2ha‒1),SDI is the stand density index,BAL/Dis the ratio of the basal area of trees larger than the subject tree to the initial DBH,Pgmax is the monthly maximum precipitation during the growing season,andεis the model error term.
Since the 2886 trees came from two study areas,in which variations in the influence variables of Korean pine growth were different,we applied a dummy variable regression to deal with the regional effects.Dummy variables often take values of 0,1,and −1,and only represent different categories,as opposed to actual quantities.To avoid collinearity when defining dummy variables,if the regression model contains intercepts,such as variables withkcategories,k–1 dummy variables need to be defined to represent these categories.We used one dummy variable to represent the two study areas,withS=0 indicating the Liangshui National Nature Reserve area,andS=1 indicating the Mengjiagang Forest Farm area.Accordingly,the assignment of the dummy variable and the basic individual-tree growth model with the dummy variable can be expressed as:

whereSirepresents the dummy variable,xkrepresents the independent variables with regional effects,ak(k=0,1,2,3,4,and 5) is the model coefficient for thekth predictor,bk(k=0,1,2,3,4,and 5) is the model coefficient for thekth dummy predictor,andεis the model error term.
To validate the differences between the two regions to determine whether dummy variables were required,we computed theFto determine whether the individual-tree diameter growth was statistically significantly different between the two regions as follows (Meng et al.2008):

where SSERand dfRare the sums of the square error and the degrees of freedom of the models without dummy variables,respectively,and SSEFand dfFare the sums of the square error and the degrees of freedom of the models with dummy variables.IfFis larger than the criticalFvalue,there are regional effects.
Model accuracy assessment
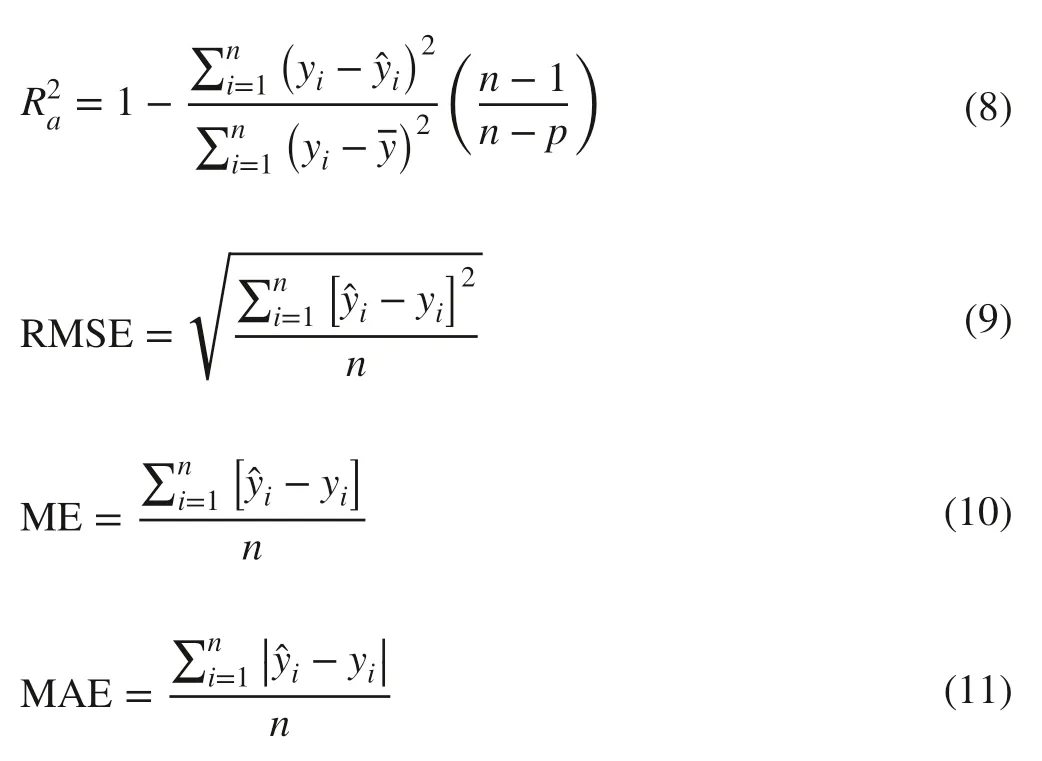
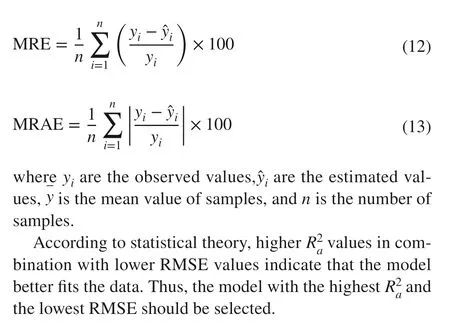
To validate the accuracy of the developed model,many statistical indices have been designed to assess individual-tree diameter growth models (Parresol 1999).The adjusted coefficient of determinationand root mean square error (RMSE)have been introduced to assess the individual-tree diameter growth models,and the following four indices were used in this study for model testing:mean prediction error (ME),mean absolute error (MAE),mean relative error (MRE),and mean relative absolute error (MRAE):
Results
Meteorological data analysis
The monthly mean temperature during the Korean pine plantations growing season ranged from 14.33 to 20.45 °C for the years 2014–2017 in Heilongjiang Province,and the monthly mean precipitation ranged from 63.56 to 152.03 mm.Meanwhile,from 2014 to 2018,the monthly mean temperature during the growing season ranged from 13.58 to 22.38 °C,and the monthly mean precipitation monthly ranged from 51.54 to 146.8 mm.Frequency analysis revealed that the monthly mean temperature and precipitation data were normally distributed (Fig.3).

Fig.3 Normal quantile–quantile (QQ) diagram of meteorological variables during the Korean pine plantations growing season in Heilongjiang Province.T1 and P1 are the monthly mean temperature and precipitation during the growing season for the years 2014–2017,while T2 and P2 are the monthly mean temperature and precipitation during the growing season for the years 2014–2018
According to the trend analysis charts of the meteorological variables (Fig.4),the trends in the mean temperatures (T1andT2) were relatively consistent and increased from north to south,which coincides with the natural rule that temperature increases with decreasing latitude.The mean temperature followed an inverted U-shaped trend in the east–west direction,indicating that the temperatures in the eastern and western regions were lower than those in the central region during the growing season for the years 2014–2018.The precipitation trend (P2) displayed a significantly biased inverted U-shaped trend in the east–west direction,indicating that the precipitation was mainly concentrated in the central and eastern regions,consistent with the actual precipitation of Heilongjiang Province in recent years.The trends in the precipitation data during the two periods were less pronounced in the north–south direction.Therefore,after dealing with the rejection of the meteorological data,the OK method could be used to interpolate the meteorological variables.

Fig.4 Trend analysis charts of meteorological variables during the Korean pine plantations growing season in Heilongjiang Province.T1 and P1 are the monthly mean temperature and precipitation during the growing season for the years 2014–2017,while T2 and P2 are the monthly mean temperature and precipitation during the growing season for the years 2014–2018
Table 3 lists the spatial autocorrelation results for the meteorological variables,which reveal that both temperature and precipitation exhibited significant spatial autocorrelations.Moran’sIvalue for temperature was larger,and itspvalue was close to 0,indicating that the spatial autocorrelation of temperature was strong.The spatial autocorrelation of precipitation was relatively weak,although it was still significantly correlated at the 99% confidence level.
In this study,the MLR model of meteorological variables was fitted using the SAS 9.4 software program,taking longitude (X),latitude (Y),elevation (E),slope (Slo),and aspect (Asp) as the independent variable of the model.Table 4 shows that the tolerance values of all the variables were > 0.1,and their variance inflation factor (VIF) valueswere < 10,indicating that there was no collinearity between the selected influence variables.
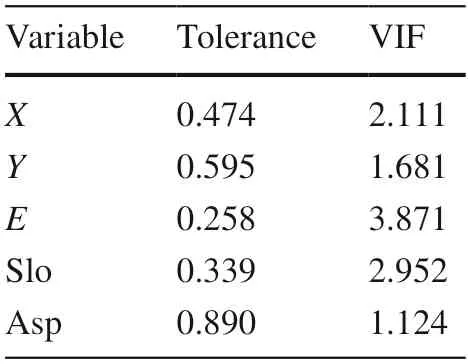
Table 4 Multicollinearity diagnostic indices for variables during the Korean pine plantations growing season in Heilongjiang Province
Three interpolation methods for meteorological variables
For comparing the results of the OK method for different semi-variance models (spherical,exponential,and Gaussian) based on cross validation,the semi-variance model parameter and values of the RMSE and AME are listed in Table 5.The spherical semi-variance model had the highest accuracy.Therefore,the spherical model was selected as the semi-variance model of the OK interpolation method in this study.
Table 6 presents the parameter estimation results of the stepwise regression of the MLR model.After the stepwise regression,latitude,longitude,and elevation were retained in the monthly mean temperature model,whereas only longitude was retained in the monthly mean precipitation model.Elevation variables were not screened for the model,however,since the elevation predictor was not statisticallysignificant in the MLR model,due to the relatively small range of elevation in Heilongjiang Province.At the same time,the residuals of the temperature and precipitation models were normal,and there was no heteroscedasticity problem.
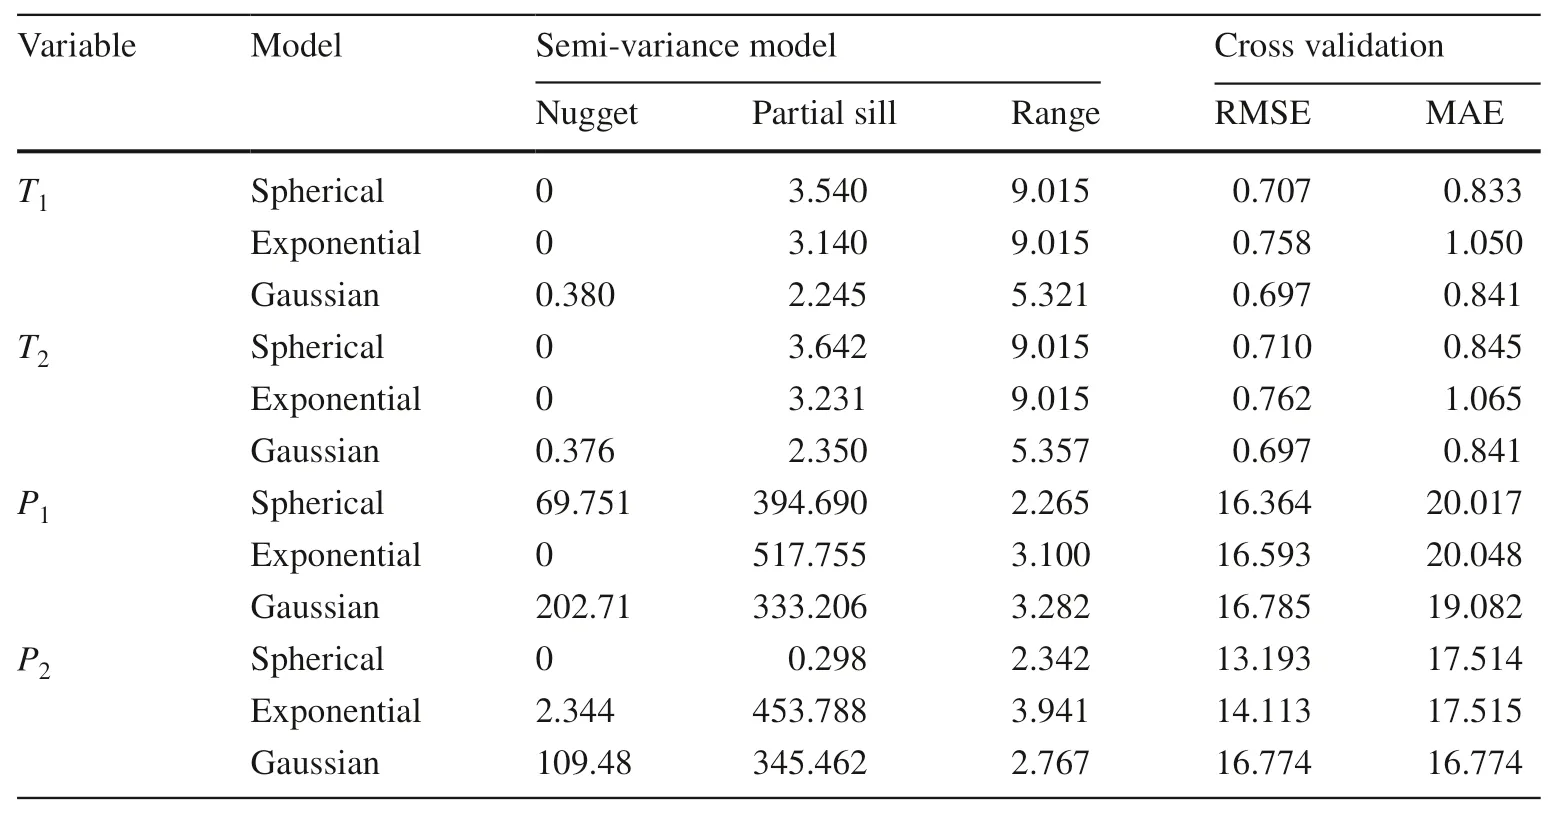
Table 5 Analysis results of the semi-variance model of Ordinary Kriging

Table 6 Parameter estimation results of stepwise regression

Table 7 Cross-validation results of three interpolation methods


The MLR models of the monthly mean temperature and precipitation are:whereT1andP1are the monthly mean temperature and precipitation during the growing season for 2014–2017,T2andP2are the respective means for 2014–2018,Xis longitude,Yis latitude,andEis elevation.
The fitted results of the MLR model revealed thatp< 0.01 for the monthly mean temperature and precipitation for the growing season,indicating that the two MLR models were statistically significant.The coefficients of determinationR2of the monthly mean temperature in the two periods were 0.9382 and 0.9447,meaning that the selected variables explained 93.82% and 94.47% of the monthly mean temperature variations,and the model better simulated the monthly mean temperature of the Korean pine plantations growing season.TheR2value of the monthly mean precipitation was only 0.3852 for 2014–2017 and 0.265 for 2014–2018,whichmay be related to complex variables such as land–sea interactions,seasonal winds,or atmospheric circulation.In terms of the model parameters,the monthly mean temperature was negatively correlated with longitude,latitude,and elevation,while monthly mean precipitation was positively correlated with longitude,indicating that the monthly mean precipitation increased with longitude in the study area.
Interpolation accuracy comparison analysis
Taking the monthly mean temperature and precipitation mentioned above as examples,we compared the ability of the three interpolation methods to simulate the effects of meteorological variables in Heilongjiang Province.Table 7 lists the LOOCV results for the three interpolation methods,which indicate that the RK method simulated the meteorological variables with higher accuracy than the other two methods,based on its lowerMAEandRMSEvalues.

Table 8 Statistics for meteorological variables in study areas

Fig.5 Scatterplots of monthly mean temperature and precipitation for the two periods of growing season in using the three interpolation methods.T 1 and P 1 are the monthly mean temperature and precipitation during the growing season for 2014–2017;T 2 and P 2 are the monthly mean temperature and precipitation during the growing season for 2014–2018
Figure 5 shows the scatterplots of the two-period monthly mean temperature and precipitation using the three interpolation methods.In this figure,the interpolation accuracy of OK for the monthly mean temperature was lower than those of the other two methods,with anR2of 0.874 forT1and 0.881 forT2.The RK method had the highest interpolation accuracy for the 2-period monthly mean temperature data,withR2values reaching 0.943 and 0.996.For the interpolation results of the two-period monthly mean precipitation,since influence variables such as latitude and elevation were eliminated in the MLR modeling process,the interpolation accuracy of MLR for the two-period monthly mean precipitation data was lower than those of the other two methods,withR2values of 0.297 and 0.134.In terms of monthly mean precipitation,the RK method was again the most accurate,withR2values of 0.490 forP1and 0.365 forP2.
The spatial distribution maps of six meteorological variables in Heilongjiang Province during the two study periods were generated in Fig.6,and the meteorological variable data of the 56 sample plots were subsequently derived by extracting values from points using the spatial analysis tools in ArcGIS 10.3.Table 8 lists the statistical results of the meteorological variables from the 56 sample plots in the two study areas.

Fig.6 Interpolation results of meteorological variables in Heilongjiang Province based on the RK method
Fitting results of the individual-tree diameter growth model
Based on the results of the correlation analysis between diameter growth and influencing variables,and given the individual tree data from the two regions,the individualtree diameter growth model (Model I) was fitted using the OLS regression method based on Eq.2.Subsequently,the individual-tree diameter growth model with meteorological variables (Model II) was developed based on Eq.3.We introduced the maximum precipitation of the growing season(Pgmax) into the model because it exhibited a high and significant correlation with dependent variables,which could be used to predict individual-tree growth under current conditions and one projected meteorological change scenario.The set of predictors was used to develop the model,including individual-tree size variables,competitive variables,site variables,stand site variables,and meteorological variables,for predicting the 3-year or 4-year periodic annual diameter increment using OLS.
Table 9 lists the parameter estimation results of the individual-tree diameter growth models.For Models I and II,the coefficient of the influence factor lnDwas positively related to the dependent variables,indicating that the initial DBH of the tree stand exerted a positive effect on the growth of the stand.The coefficients of the competition factors ln SDI,BAS,and BAL/Dwere inversely related to the dependent variables,indicating that denser stands had higher competitive pressure between individual trees,resulting in a smaller DBH increment,which is in line with the growth rules of trees.In terms of Model II,which was based on Model I and contained the meteorological variable Pgmax,the fitting results revealed thatPgmaxwas inversely related to tree growth.According to the standardized coefficient,the individual-tree size variablelnDexerted the greatest influence on DBH growth,followed by the competition factors BAS,lnSDI,and BAL/D.The meteorological variablePgmaxwas also found to have a significant impact on Model II.The five independent variables described above clearly were statistically significant for the diameter growth of Korean pine plantations.
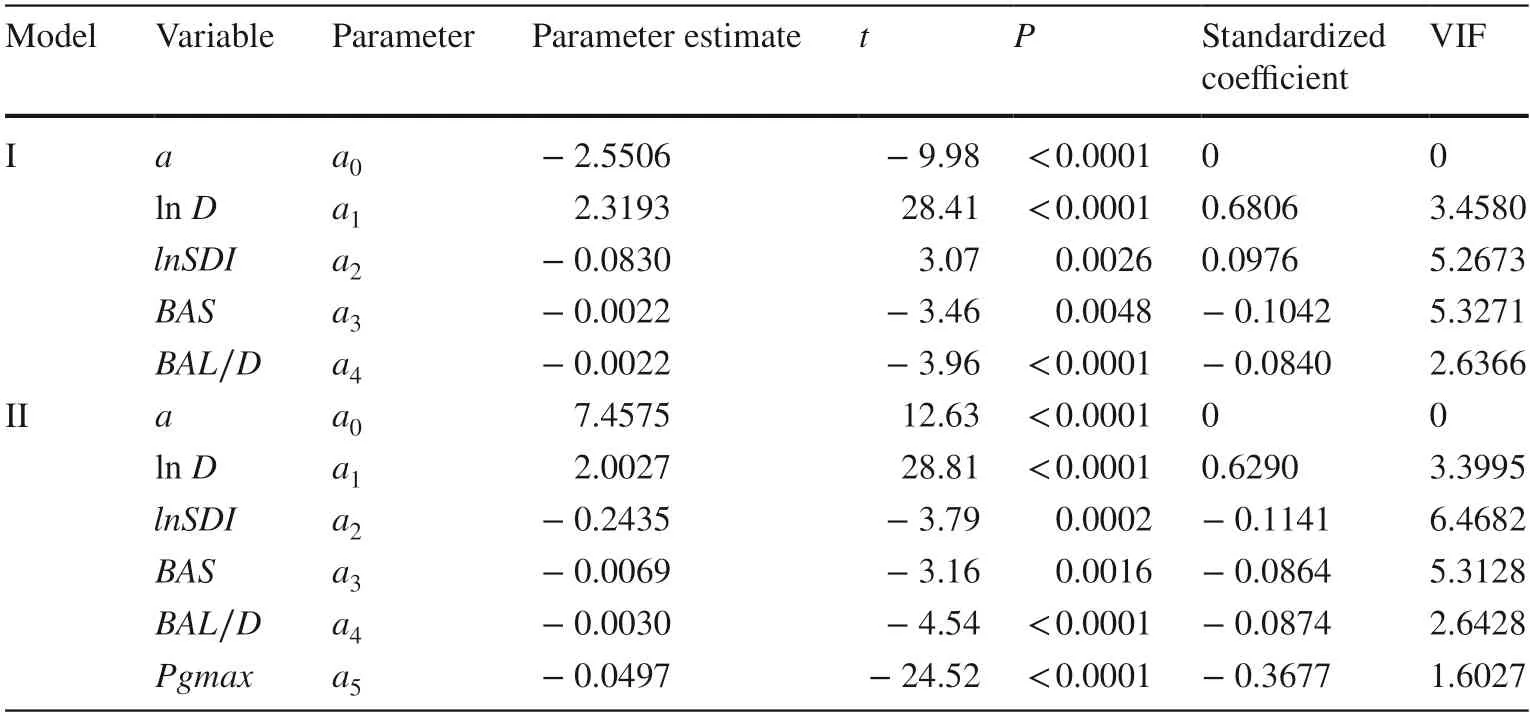
Table 9 Results of parameter estimation of diameter growth model
Individual-tree diameter growth model with dummy variables
To better predict the growth of Korean pine plantations in the two regions,the predictor data were grouped according to the study region and fitted with Model II to obtain the model parameters of the two regions.Comparing and selecting the independent variables with large differences in coefficients between the two regional models,we found that the coefficients of intercepta,lnD,BAS,andPgmaxdiffered appreciably between the models.Hence,dummy variables were utilized to deal with the coefficients of the four predictors,and an individual-tree diameter growth model of Korean pine with regional effects (Model III) was developed,which is more suitable for the two regions,expressed as Eq.18:

whereak(k=0,1,2,3,4,and 5) andbk(k=0,1,2,3,4,and 5) are the model coefficients for thekth predictor,Sis the dummy variable,DGI is the diameter growth increment of a 3-or 4-year period (cm),Dis the initial DBH (cm),BAS is the stand basal area (m2ha‒1),SDI is the stand density index,BAL is the basal area of the trees larger than the subject tree(cm2),Pgmax is the monthly maximum precipitation during the growing season,andεis the model error term.
Table 10 lists the parameter fitting results of Model III,which revealed that the positive effect of lnDon the Mengjiagang Forest Farm region was greater than its positive effect on the Liangshui National Nature Reserve region.There was a significant difference in the response of diameter growth toBAS between the two regions.The negative effect of BAS diameter growth was more evident in the Mengjiagang Forest Farm region,as was the negative effect of Pgmax on diameter growth.

Table 10 Results of parameter estimation for individual-tree diameter growth model with dummy variable
Model comparison
Using the modeling data of sample trees,the goodness-offit statistics of the individual-tree diameter growth models were calculated.Table 11 presents the results of model comparison and assessment,which revealed that the individualtree diameter growth model with meteorological variables(Model II) was better than the model with no meteorological variables (Model I),and achieved a gain of 18% inThe individual-tree diameter growth model with dummy variables (Model III) performed significantly better than both Model I and Model II,with anvalue reaching 0.6286.Compared with Model II,Model III had anF-value of 4.59,which is greater than the criticalF-test value.The results revealed that there were regional effects in the growth models of individual tree diameters in the two regions,and the introduction of dummy variables into the growth models made a statistically significant difference.TheRMSEvalue of Model III was 0.6242,which was the lowest of the three models.Overall,the individual-tree diameter growth model with dummy variables effectively improved the goodnessof-fit of the diameter growth model and more accurately estimated the growth of Korean pine plantations in the two regions.Therefore,we suggest using Model III in the application of tree growth models,if possible.

Table 11 Goodness-of-fit of three kinds of individual diameter growth model
Model validation
Table 12 lists the four statistical indices used to analyze the error prediction results of the models,which were obtained by comparison with the basic diameter growth model.The values of the test indices of Model II decreased accordingly,which indicated that the prediction accuracy of the individual-tree diameter growth model with meteorological variables was higher than that of Model I.Compared with the other two models,Model III with dummy variables had the lowest test index values,indicating that the prediction accuracy of Model III was the highest and thus making it the most suitable model for the prediction of diameter growth in the Korean pine plantations in the two regions.

Table 12 Accuracy assessment of individual-tree diameter growth model
Discussion
Individual-tree diameter growth models of Korean pine plantations were developed to precisely master the growth rules and effectively improve the yield of Korean pine plantations in the two study areas,which are the main production areas of Korean pine plantations in Northeast China.
In this study,we compared the effects of the interpolation methods and used the mixed interpolation method to obtain the optimized meteorological variables in the two study areas.The RK method,which combines geostatistics with traditional statistics,explained the information of model residuals in MLR models via the OK method.The RK method added elevation as a variable into the interpolation process of the monthly mean temperature during the growing season,which simulated well the decrease of air temperature with height,thereby increasing the accuracy of the interpolation results.Therefore,we adopted the RK method to derive the monthly mean temperature and precipitation data during the growing season of Korean pine plantations in Heilongjiang Province from 2014 to 2018 and obtained different meteorological variables corresponding to the stand variable data used in this project.
Combined with stand and individual-tree predictors,individual-tree diameter growth is influenced by the comprehensive impact of individual-tree size,site,competition,and meteorological variables.For the given data and study area,we identified five predictors to develop the individualtree diameter growth model.The tree size variable natural logarithm of initial diameter lnDhas the most important and significant positive effect on the growth of forest trees.Since light is the main limiting resource for tree growth,the diameter of trees usually depends on the amount of light received.Larger trees obviously receive more light and thus have a competitive advantage over smaller trees,which means that the size of the initial diameter corresponds to the basic ability of the tree for later growth,thereby reflecting its competitiveness in the stand or sample plot.The relationship between diameter increment and initial diameter is typical of tree growth processes and is consistent with the research results of Zhao et al.(2013) and Zhang et al.(2017).The three competition variables ln SDI,BAS,and BAL/Dall exerted a similar negative effect on the diameter growth of Korean pine.BAL/Dis an index of tree competitive position:compared to neighboring trees,the larger a tree’s diameter,the more light,water,and soil nutrients the tree receives(Yang et al.2003).From the results in Table 9,the BAL/Dcoefficient in this study was negative,indicating that the predicted increment decreases with increasing BAL/Dvalue.The coefficients ln SDI and BAS reflect the forest density of stands or sample plots;here,they were negative,indicating that denser stands would produce smaller tree diameter increments.In dense stands,the diameter increment of trees with the same initial diameter is usually smaller than that in less dense stands,because the denser the stand,the higher the competitive pressure among individual trees.Hence,individual trees receive the less resources,resulting in less corresponding DBH growth,consistent with the rules of nature.Previous studies have shown that SCI,as a typical site variable,exerts a significant effect on diameter growth compared with other types of site variables (Adame et al.2008;Subedi and Sharma 2011).In this study,however,site variables such as the SCI had no significant effect on the growth of individual-tree diameter.A possible reason for the poor performance of the site indices may be the fact that the field inventory data collected in this study were located on a plain,and therefore,site variables such as elevation did not change significantly.As a result,there was little difference in either the SCI or the other site variables used for modeling in the Korean pine plantations data.
In addition to the aforementioned variables,we explored the influence of six types of meteorological variables on the diameter growth of Korean pine plantations during the growing season.Considering statistical conditions such as collinearity among independent variables,the results revealed that maximum precipitation during the growing season (Pgmax) exerted a significant impact on the diameter growth of Korean pine plantations.The coefficient ofPgmaxis negative,which reflects the wayPgmaxaffects tree growth and is related to the effect of water on the rate of tree cell division.Precipitation has been high during the growing season of Korean pine in Heilongjiang Province in recent years,and Korean pine requires high soil quality.Overly dry and overly wet soils are not conducive to the growth of Korean pine.Moreover,a wetter growing season,which may decrease radiation input,increases nutrient leaching,which affects the accumulation of nutrients in the trees and reduces the decomposition rate,which would reduce the diameter growth of Korean pine.
Finally,in attempting to more reasonably express and predict the growth increment of Korean pine plantations in the two regions,we discovered that several variables had different effects on the diameter growth of Korean pine inthe Liangshui National Nature Reserve and Mengjiagang Forest Farm.For example,the tree size variable lnDwas found to have a positive effect in the Mengjiagang Forest Farm area that was significantly larger than the effect in the Liangshui National Nature Reserve area.This result may be related to the fact that the Korean pine plantations in the Mengjiagang Forest Farm area had larger mean initial DBH values.In addition,the competition factorBASexhibited a negative effect,which was more evident in the Mengjiagang Forest Farm area and may be related to differences between the two study areas in terms of objective conditions such as age and initial planting density of Korean pine plantations.When we utilized theF-test to determine whether there was a significant difference between the sample data of the Korean pine plantations from the two different regions,Fwas 4.59,above the critical F value.Overall,we determined that it is meaningful to develop an individual-tree diameter growth model with regional effects.
The individual-tree diameter growth models based on meteorological variables had much smaller RMSE values and highervalues than the basic diameter growth model.The greatest model fitting improvements were achieved by applying meteorological variables as predictors,followed by the dummy variable method with regional effects.Ideally,forest managers should use the mixed method to obtain more accurate meteorological variable distributions to evaluate the impact of meteorological variables on tree growth,and the dummy variable method should be used to solve the regional effects of the individual-tree diameter growth model.According to our research,the individual-tree diameter growth model can be used to adjust the management measures of Korean pine plantations in the Liangshui National Nature Reserve area and the Mengjiagang Forest Farm area.For example,this simulation will help to better predict the growth process and regularity of Korean pine in the two regions.This model is more instructive for the management of Korean pine plantations in the two regions and can be used as the final model for predicting diameter growth.
Conclusions
In this study to improve the individual-tree diameter growth model of Korean pine plantations for forestry management,we compared the interpolation results of three interpolation methods–OK,MLR,and RK–using meteorological variables of the Korean pine growing season in Heilongjiang Province.The optimized interpolation results were then combined with stand and individual trees variables,based on the data of 2886 sample trees from 56 sample plots of Korean pine plantations from Mengjiagang Forest Farm,Jiamusi,and the Liangshui National Nature Reserve in Heilongjiang Province.An individual-tree diameter growth model (Model I) and an individual-tree diameter growth model with meteorological variables (Model II) were developed using a stepwise regression method.In addition,an individual-tree diameter growth model with regional effects (Model III) was developed with dummy variables in regression,and theF-test statistic was used to validate the differences of the predictors.The results revealed that the interpolation effect of the RK method is clearly better than that of either the OK method or the MLR method.In addition,the RK method exhibited better fitting accuracy and goodness-of-fit for the meteorological variable data of this study.The individual-tree diameter growth model based on optimized meteorological variable interpolation improved thevalue to 0.6078,which reflected the significance of the meteorological variables to the individual-tree diameter growth model of Korean pine,and verified the theoretical conjecture that climate change may affect tree growth.The individual-tree diameter growth model of Korean pine fitted by the dummy variable method solves the regional effects of the model.The fitting effect of the model was improved greatly,and thevalue reached 0.6286.This study provides a useful tool in practical forest management for predicting individual-tree diameter increment.Compared with the stand-level models,predicting the growth of diameter,as one of the main components of the individual-tree growth models,can analyze the relationship between stand structure and production in detail,which are essential for managing and predicting long-term growth performance of Korean pine plantations.They also help simulate the results of silvicultural treatments and permit comparison with alternative thinning regimes to help forest managers plan more efficient management strategies for Korean pine plantations in Northeast China.
AcknowledgementsWe thank the faculty members and students of the Department of Forest Management,Northeast Forestry University(NEFU),P.R.China,who participated in the National Forest Survey in the Liangshui National Nature Reserve and Mengjiagang Forest Farm from 2014 to 2018 and collected the data for this study.We also thank two anonymous reviewers for constructive and valuable suggestions and comments that improved this manuscript.
杂志排行
Journal of Forestry Research的其它文章
- Flexible transparent wood enabled by epoxy resin and ethylene glycol diglycidyl ether
- Diversity and surge in abundance of native parasitoid communities prior to the onset of Torymus sinensis on the Asian chestnut gall wasp (Dryocosmus kuriphilus) in Slovenia,Croatia and Hungary
- Ozone disrupts the communication between plants and insects in urban and suburban areas:an updated insight on plant volatiles
- Testing visible ozone injury within aLight Exposed Sampling Site as aproxy for ozone risk assessment for European forests
- Logging and topographic effects on tree community structure and habitat associations in a tropical upland evergreen forest,Ghana
- Spatial pattern dynamics among co-dominant populations in early secondary forests in Southwest China
