Estimated biomass carbon in thinned Cunninghamia lanceolate plantations at different stand-ages
2021-07-15XieZhangZhenmingWuZhongkunXuLiangXuQingqianXuJianzhongLin
Xie Zhang·Zhenming Wu·Zhongkun Xu·Liang Xu·Qingqian Xu·Jianzhong Lin
Abstract Chinese fir (Cunninghamia lanceolate [Lamb.]Hook.) is a fast-growing species which is not only important as a timber-supplier,but also as an available sink for carbon (C) storage in biomass.Stand age and density are two critical factors that can determine tree C sequestration as interrelated drivers through natural self-thinning.C.lanceolate were planted using 1-year-old bare-root seedlings at the initial density of 1800 stems ha−1 in a 15-ha montane area of Hunan Province,China in 1987.The plantation was thinned twice 10 and 20 years after planting to leave trees of 437.5 ± 26.6,675.0 ± 155.2 and 895.8 ± 60.1 stems ha−1 as low,medium,and high densities,respectively.Tree height and diameter at breast height (DBH) were measured every 2 years beginning from 23 years (2009) to 31 years (2018)after establishment,timber volume (TV) and biomass C were estimated accordingly.We did not find any interactive effect of age and density on any variables except for height.Both TV and biomass C increased with stand age or decreased in higher densities.The allometric height-DBH relationship can be fitted by an exponential risingto-maximum model with higher maximum value over time.The decline of biomass C along density fit with the inverse first-order polynomial model which indicated that at least 1300–1500 stems ha−1 may be needed to maximize TV and biomass C for a longer term over 20 years.Therefore,to control the density to a reasonable level,over 1300 stems ha−1 in a rotation over 20 years old will be practical for tree biomass C in Chinese fir plantations.
Keywords Forest management·Carbon budget·Cunninghamia lanceolate·Southern China
Introduction
Global warming increases the frequency of extreme hightemperature events which further increases atmospheric carbon (C) concentration (Zhou et al.2016).Forests mitigate atmospheric carbon dioxide (CO2) concentration by sequestering nearly half of the terrestrial C in forest vegetations(Beer et al.2010;Pan et al.2019).Forest biomass largely accounts for the mitigation of climate change through pooling atmosphere CO2,around 50% of tree biomass is derived from C (Tang et al.2017).Forest management and stand characteristics are key factors determining the forest C stock(Schaedel et al.2017).The promotion of C storage through stand management needs to be adapted to the specific forest type.
Driven by a high demand for timber resources,China has the largest area of plantation reserves in the world (Wang et al.2016).A proportion of 63% of plantations in China are concentrated in the southern subtropical regions (Wang et al.2017;Ming et al.2019).Chinese fir (Cunninghamia lanceolate[Lamb.] Hook.) is the most important conifer species for timber production and has wide geographic distribution in southern China,Vietnam,and Laos (Zhang et al.2016).The general objective to planting Chinese fir plantations is to meet the requirement of timber production and can be dated back 1000 years (Zhang et al.2004).Large-scale establishment of Chinese fir plantations exploded since the 1950s and peaked around the 1980s (Zhang et al.2004).For the purpose of climate change mitigation,the promotion of C sink in living storage has been the objective for planting and management of Chinese fir plantations since the 1980s (Zhang et al.2004;Zhao et al.2009;Yen and Lee 2011;Wang et al.2012;Liao et al.2014;Xie et al.2016;Cheng et al.2017;Tang et al.2017;Lei et al.2019;Saeed et al.2019).
Due to the attribute of fast growing speed of Chinese fir trees,their C sequestration has a strong variation in response to stand-ages from 15 to 54 years (Zhao et al.2009;Yen and Lee 2011;Wang et al.2012;Chen et al.2013;Xie et al.2016).However,distinct results have been documented in the study of age-related response of C sequestration.For example,it was reported that total C store in biomass of Chinese fir increased to its peak at the age of 23 years in un-thinned stands (Zhao et al.2009;Yen and Lee 2011).Data from a large geographical scale also illustrated continuously increasing C sequestration in an age as high as 30 years (Wang et al.2012;Chen et al.2013).Long-term stand age up to 50 years has been found to have an effect on C allocation with more C allocated to roots in older stands(Xie et al.2016).Current findings on age of Chinese fir stands are highly varied in location and management strategy.The interaction between age and other factors,such as stand density,may have a stronger effect on C storage than any single driver.
Chinese fir belongs to the species with a self-thinning nature (Zhang et al.2016).The first-rotation density declines as the age increases over a long term,up to 50 (Xie et al.2016) or 90 years (Selvaraj et al.2017).Stand density is an influential factor that determines biomass C sequestration and consequently physiological activities in trees (Devi and Yadava 2015;Xie et al.2016;Li et al.2019;Pan et al.2019).Older stands resulted in greater tree C storage and higher partition of biomass to the root (Xie et al.2016).However,artificial thinning before trees have commercial value had no effect on C storage in Chinese fir at around 50 years,which may be an over-mature age without the function of sequestering C (Schaedel et al.2017).Relatively fewer studies were concerned with the effect of stand density on tree C storage in Chinese fir during a shorter rotation period.Furthermore,no evidence illustrates any combination of effects between stand age and density on C storage in Chinese fir plantations.
Biomass is the most important determinant for C estimation but collecting biomass data is extremely costly and time-consuming for large-scale estimation.Therefore,precise estimation of biomass using stand measures is critical to assess tree C storage.In this study,a medium-term rotation experiment was conducted for 30 years to detect the interactive effects of stand age and density on biomass C in live trees in a large area of Chinese fir plantations.Tree biomass C was estimated by a model based on data of height and diameter at breast diameter (DBH).Thereafter,the relationship between growth variables and biomass C was assessed with varied stand densities at different ages.We hypothesized that (1) growth and biomass C increased with age in lower density as a response to the interactive effects,(2) the relationship between height and DBH changed with stand age,and (3) tree biomass C increased with density.Results of this study can be useful for the management of Chinese fir plantations with the objectives of not only harvest of timber volume but also sequestration of C in trees as both parameters are related to above-ground growth (Zhang et al.2013;Duan et al.2016).
Materials and methods
Study site
This study was conducted in Diling (26°44′ N,109°36′ E) at the Huitong Institute of Forestry Science,Xuefeng Mountain Natural Preserve,Hunan Province,China.Local conditions are characterized by a mid-subtropical monsoon climate with mild temperature and misty air.Since the 1980s,the study site had an annual daylight time of 1475 h,average daily temperature of 17.1 °C,relative humidity (RH) of 81.4%,and yearly average rainfall of 1446 mm.The annually active accumulated temperature that is higher than 10 °C was 5475 °C.There were 288 frost-free days.The Chinese fir (the Cupressaceae family) plantation that was chosen for investigation was located to the north of the bank of Dapo Reservoir,where the elevation ranged from 260 m to 520 m with a slope of 15°–30°.Soils were characterized as Ultisols with red-yellow color with the presence of oxidized ferric iron oxides.The O–B soil layers had a depth of 60–80 cm,organic matter of 2.3%,and pH value of 6.1–6.8.
The whole Chinese fir plantation occupied an area of 15 ha with the central location of 26°42′ N and 109°37′ E.The site was prepared by removing weeds,coppices,and shrubs in March of 1987.Thereafter,1-year-old bare-root Chinese fir seedlings were planted in 40 cm × 40 cm × 35 cm(top diameter × height × bottom diameter) shoveled holes along the contour lines to an initial stand density of 1800 stems ha−1.Dead seedlings were replaced by 2-yearold bare-root stocks in the fall of 1987.The total mortality of the first growing season was lower than 6% and all replanted new seedlings were checked for survival in the following summer.The whole site received maintenance twice a year through removing weeds and straightening seedlings for the first three seasons.The first annual maintenance was during May and June and the second during September and October.
Thinning practice
The whole site was divided into three uniform sections,each had an area of 5 ha.Chinese fir trees in all divisions were thinned to different densities twice.The first thinning was done in 1996,10 years after planting,cutting down 22%of all trees.The second happened in 2006 (20 years) cutting down 30%–50% of resident stems.Small-sized trees with low competing ability were chosen and knocked down to leave strong trees with large stems at a uniform spacing according to a visual estimate.
Site investigation
A total of 12 stands were set in December of 2009,23 years after plantation establishment;this is estimated to be the peak of C sink in Chinese fir plantations (Zhao et al.2009;Yen and Lee 2011).The whole site was partitioned into three divisions with different densities,four stands were randomly set in each division with an area of 600 m2(20 m × 30 m).Thus,each stand can be considered as a replicated unit to investigate Chinese fir trees (n=4).Stands were thinned to three distinct densities of 437.5 ± 26.6 (low),675.0 ± 155.2(medium),and 895.8 ± 60.1 (high) stems ha−1(analysis of variance [ANOVA] model,F2,9=19.32,P=0.0006).A total of 1928 trees were measured and involved in this study(Table S1).All Chinese fir trees in each stand were measured for height and DBH and these measurements were repeated in December every 3 years in 2012,2015,and 2018 which was 26,29,and 32 years after plantation establishment.The 30 year mark was found to be the point at which continuous C sequestration in trees occurred without apparent decline for Chinese fir plantation (Wang et al.2012;Chen et al.2013;Zhang et al.2016).
A total of 12 random soil samples were taken across each stand.Soil samples were mixed to be the basic unit for soil determination in each stand.Chemical properties of soil samples were determined and compared for different stand densities (Table 1).In short,soil pH value was measured in 1:2.5 (v/v) mixture in distilled water (Wei et al.2017),soil organic matter by dichromate oxidation and titration with ferrous ammonium sulfate (Wang et al.2016;Wei et al.2017),available nitrogen (N) by the sum of ammonium-N and nitrate–N concentration (Wei et al.2017),available phosphorus (P) by phosphomolybdic acid blue-color method(Wei et al.2017),available potassium (K) by a flame photometer (Wang et al.2016),total N by Kjeldahl method,and total P by the HClO4-digested Na2CO3fusion method (Wang et al.2017;Li et al.2018).

Table 1 Soil properties in Cunninghamia lanceolate plantations at different densities
Model estimation
The timber volume (TV in m3) of Chinese fir stem was calculated according to the formula (Duan et al.2016):
where coefficients ofDandHare DBH and tree height,respectively.Biomass (Win kg) of a specific organ or part(leaves,branch,stem,root,and whole-plant) was regressed by the allometric equation (Zhang et al.2013):

where coefficients ofaandbcan be calculated by the regression model of (Zhang et al.2013):
where in Eq.2,the coefficienteis the error term that is normally distributed with mean zero and the variance ofσ2.In Eq.3,the coefficient α stands for the value of lna.According to the empirical model from the Bayesian method,W forevery organ or part in a Chinese fir tree can be estimated as follows (Zhang et al.2013):

whereW leaves,W branch,W stem,W root,andW wholeare estimated biomass in leaves,branch,stem,root,and in the whole tree,respectively.According to the large-scale summary of biomass C pools in Chinese fir plantations across subtropical China,the C stock in this study was estimated from biomass values using the conversion ratio of 0.5 (Wang et al.2012).In total,according to the number of individual trees,a total of 1928 sets of estimated C were documented for analysis.
Statistics
All statistics were achieved by SPSS software (IBM,New Jersey,USA).Data were analyzed for normality and were transformed to cubic root when it was necessary to meet the requirement of data analysis using normally distributed data.Year and stand density are two independent variables while estimated values are dependent variables.The stand density was a fixed factor with different years as a repeatedly measured factor and stand arrangement as a random factor.The mixed model of analysis of variance (ANOVA) was used to detect density and its interaction with repeated measures across different stand ages on variables with the critical probability of 0.05 as significance.When significant effect was detected,means were compared and arranged according to the Duncan test at 0.05 level.
Height and age were correlated to each other using data that varied in every age at different densities to detect the changing trend among stand age and density situations.Another regression was constructed between stand density and all measured and estimated variables at different ages to detect the changing trend across time of plantation establishment.
The maximum likelihood estimating model for multiple regressions was used by screening the goodness of fit for raw data with stand age and density as driving factors and measured or estimated variables as dependent variables.According to raw data distribution patterns,a Poisson model was employed to describe the multiple-factors regression with estimated values.Wald Chi square value (P< 0.05) was employed to determine the significance of estimated coefficients for contribution by multiple independent variables.
Results
The interaction between stand age and density
Only stand age and density had an interactive effect on tree height (Table 2).Low-density tree height was highest throughout the four stand ages (Fig.1).Tree height was lower in the stand with medium density than in the other two densities.In 2018,tree density in the low-density stand was higher by 7.5% than in the medium density stand and height was higher by 2.3% than in the high-density stand (Fig.1).
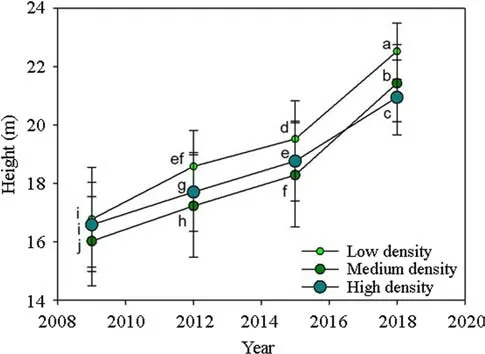
Fig.1 Dynamic of Chinese fir (Cunninghamia lanceolate) tree height over stand age in different densities.Dots stand for means across four stands.Data are analyzed by repeated measures on the same stands by a mixed-model ANOVA.Different letters stand for significant difference across ages and densities according to the Duncan test at 0.05 level
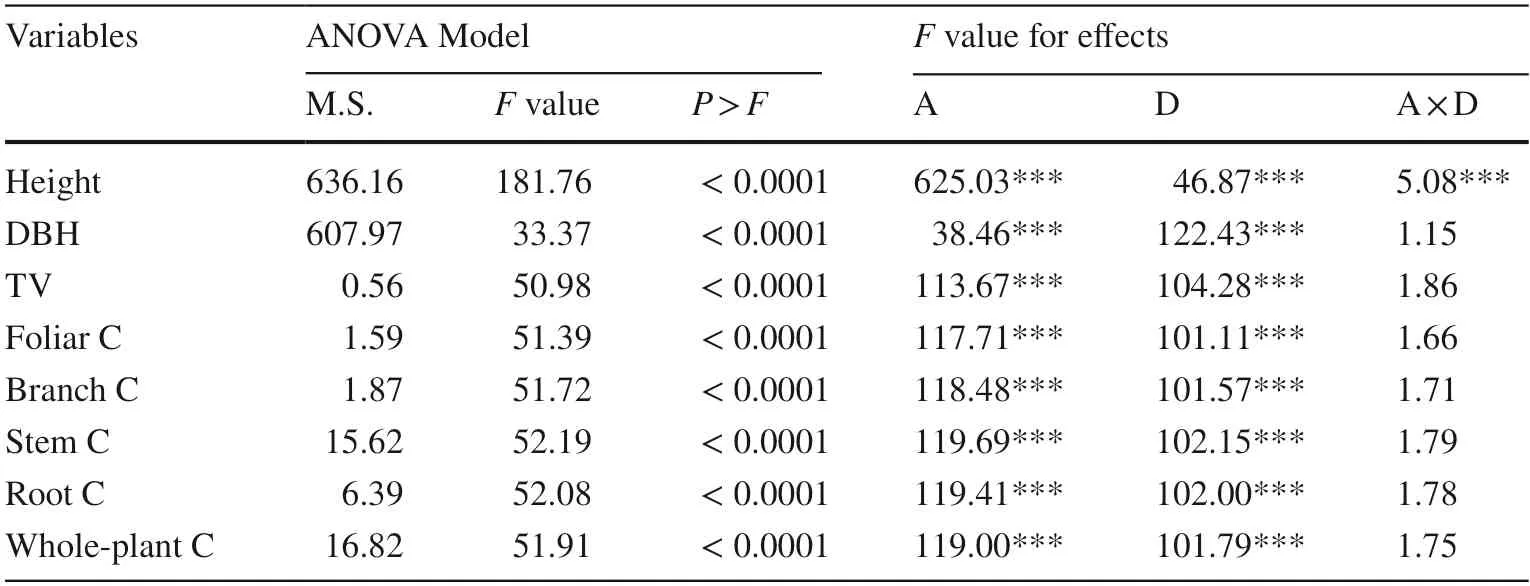
Table 2 Analysis of variance(ANOVA) of age (A),density(D),and their interaction(A × D) on growth and carbon(C) storage variables in trees of Cunninghamia lanceolate plantations
Stand age had a significant sole-effect on DBH and TV,which both increased with time although the increment was not significantly different between the years of 2012 and 2015 (Fig.2 a,c).DBH and TV was lower in the higher density group of stands (Fig.2 b,d).
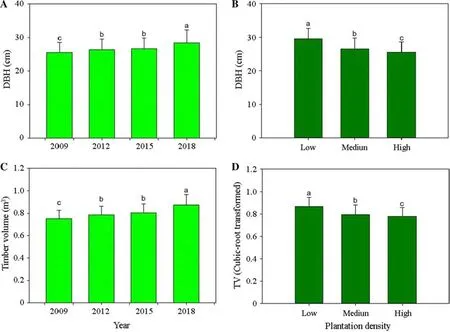
Fig.2 Diameter at breast height (DBH) and timber volume (TV) in Chinese fir (Cunninghamia lanceolate) trees across stand ages (left)and in different densities (right).Bars stand for means across four stands.Different letters stand for significant difference across ages and densities according to the Duncan test at 0.05 level
Stand age had a significant sole-effect on biomass C which increased with time (Fig.3 a,c,e,g).Biomass C in2018 increased by 10−14% compared to that in 2009.While in comparison,biomass C stock was significantly lower in higher density stands (Fig.3 b,d,f,h).
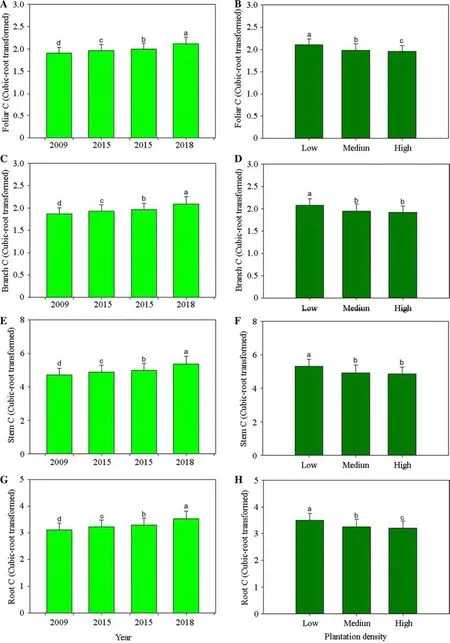
Fig.3 Estimated carbon (C) storage in Chinese fir (Cunninghamia lanceolate) trees across stand ages (left) and in different densities(right).Bars stand for means across four stands.Different letters stand for significant difference across ages and densities according to the Duncan test at 0.05 level
The relationship between height and DBH
Tree height increased with DBH in stands with different densities across all stand ages (Fig.4).This trend of increase can be described by an exponential-rise-to maximum model where the coefficients varied in response to the variation of stand ages and densities (Table 3).As stand years passed,coefficient a declined in 2015 then increased in 2018 in low and high densities,but the coefficient continuously increased throughout the 4 years (Table 3).Generally,coefficient b increased from 2009 to 2015 in both low-and high-density stands.While in comparison,coefficient b remains stable in medium density stands during the study period (Table 3).However,the highest value of tree height continued to increase with DBH throughout the four stand ages.
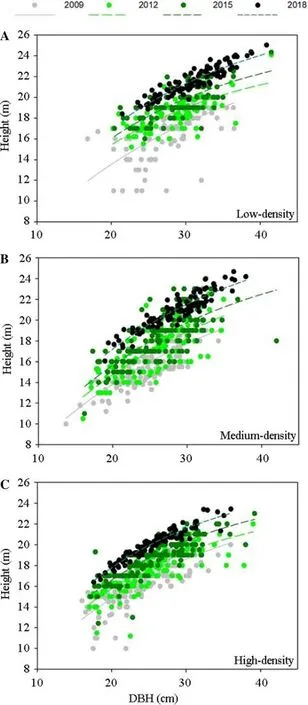
Fig.4 Correlation between diameter at breast height (DBH) and height fit by exponential rise-to-maximum model for Chinese fir(Cunninghamia lanceolate) trees.Dots stands for raw data about height and DBH for every tree in stands in all years
The change across stand densities
The relationship between measured or estimated variables and stand density can be fitted by the inverse first-order polynomial model (Fig.5).Therein,coefficients a and b theoretically stand for the critical stand density to which an infinitesimal value of dependent variables can be regressed.For the regression of density with height,coefficient a increased from 2009 to 2012 then declined in 2018,while the regression of DBH showed an opposite relationship with density (Table 4).Coefficient a increased with time for biomass C estimation in all organs (Table 4).However,coefficient b showed a general increasing trend with time for the regression of density with all dependent variables.
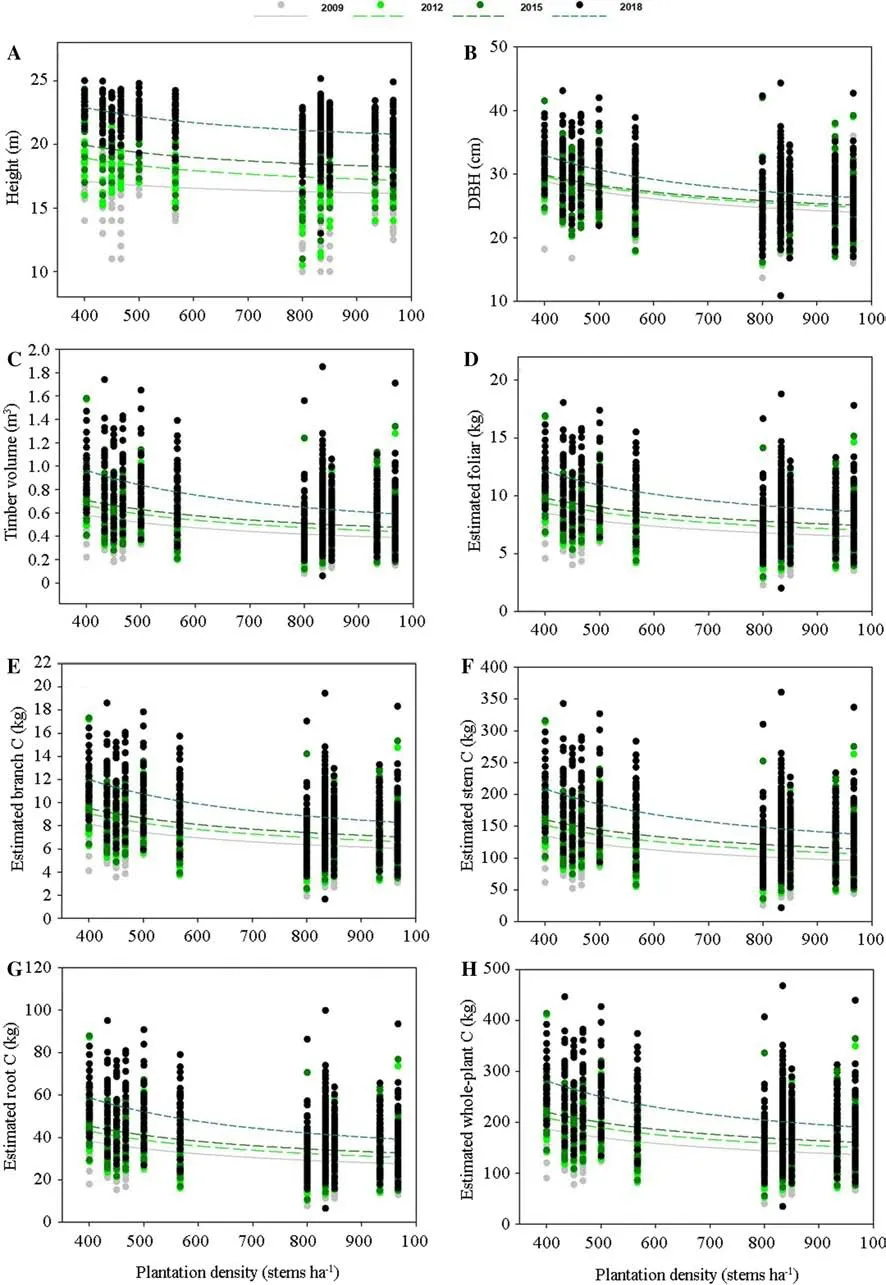
Fig.5 Regression between stand density and growth and carbon (C) variables fit by polynomial inverse-first-order model for Chinese fir (Cunninghamia lanceolate) trees.Dots stands for raw data about height and DBH for every tree in stands in all years
The maximum likelihood regression
Both tree height and DBH can be well described by the maximum likelihood regression using a Poisson model with goodness of fit assessed by the Pearson Chi square value to be 0.1935 and 0.1687,respectively (Tables 5 and 6).However,combined factors of stand age and density had rare contribution to either tree height or DBH.Stand age from 2009 to 2015 showed negative contribution to tree height with no contribution in 2018 (Table 5).Only low stand density had significantly positive contribution to tree height,but either medium or high densities had no contribution to tree height.Stand age also had significantly negative contribution to DBH in 2009,2012,and 2015 with no effect in 2018(Table 6).The low and medium stand densities had positive contributions to DBH while high density had no effect.

Table 3 The regression of diameter at breast height(DBH) with height in trees of Cunninghamia lanceolate plantations across different ages at different densities according to the exponential rise to maximum model

Table 4 The regression of density with growth and carbon(C) storage variables in trees of Cunninghamia lanceolate plantations according to the inverse first-order polynomial model
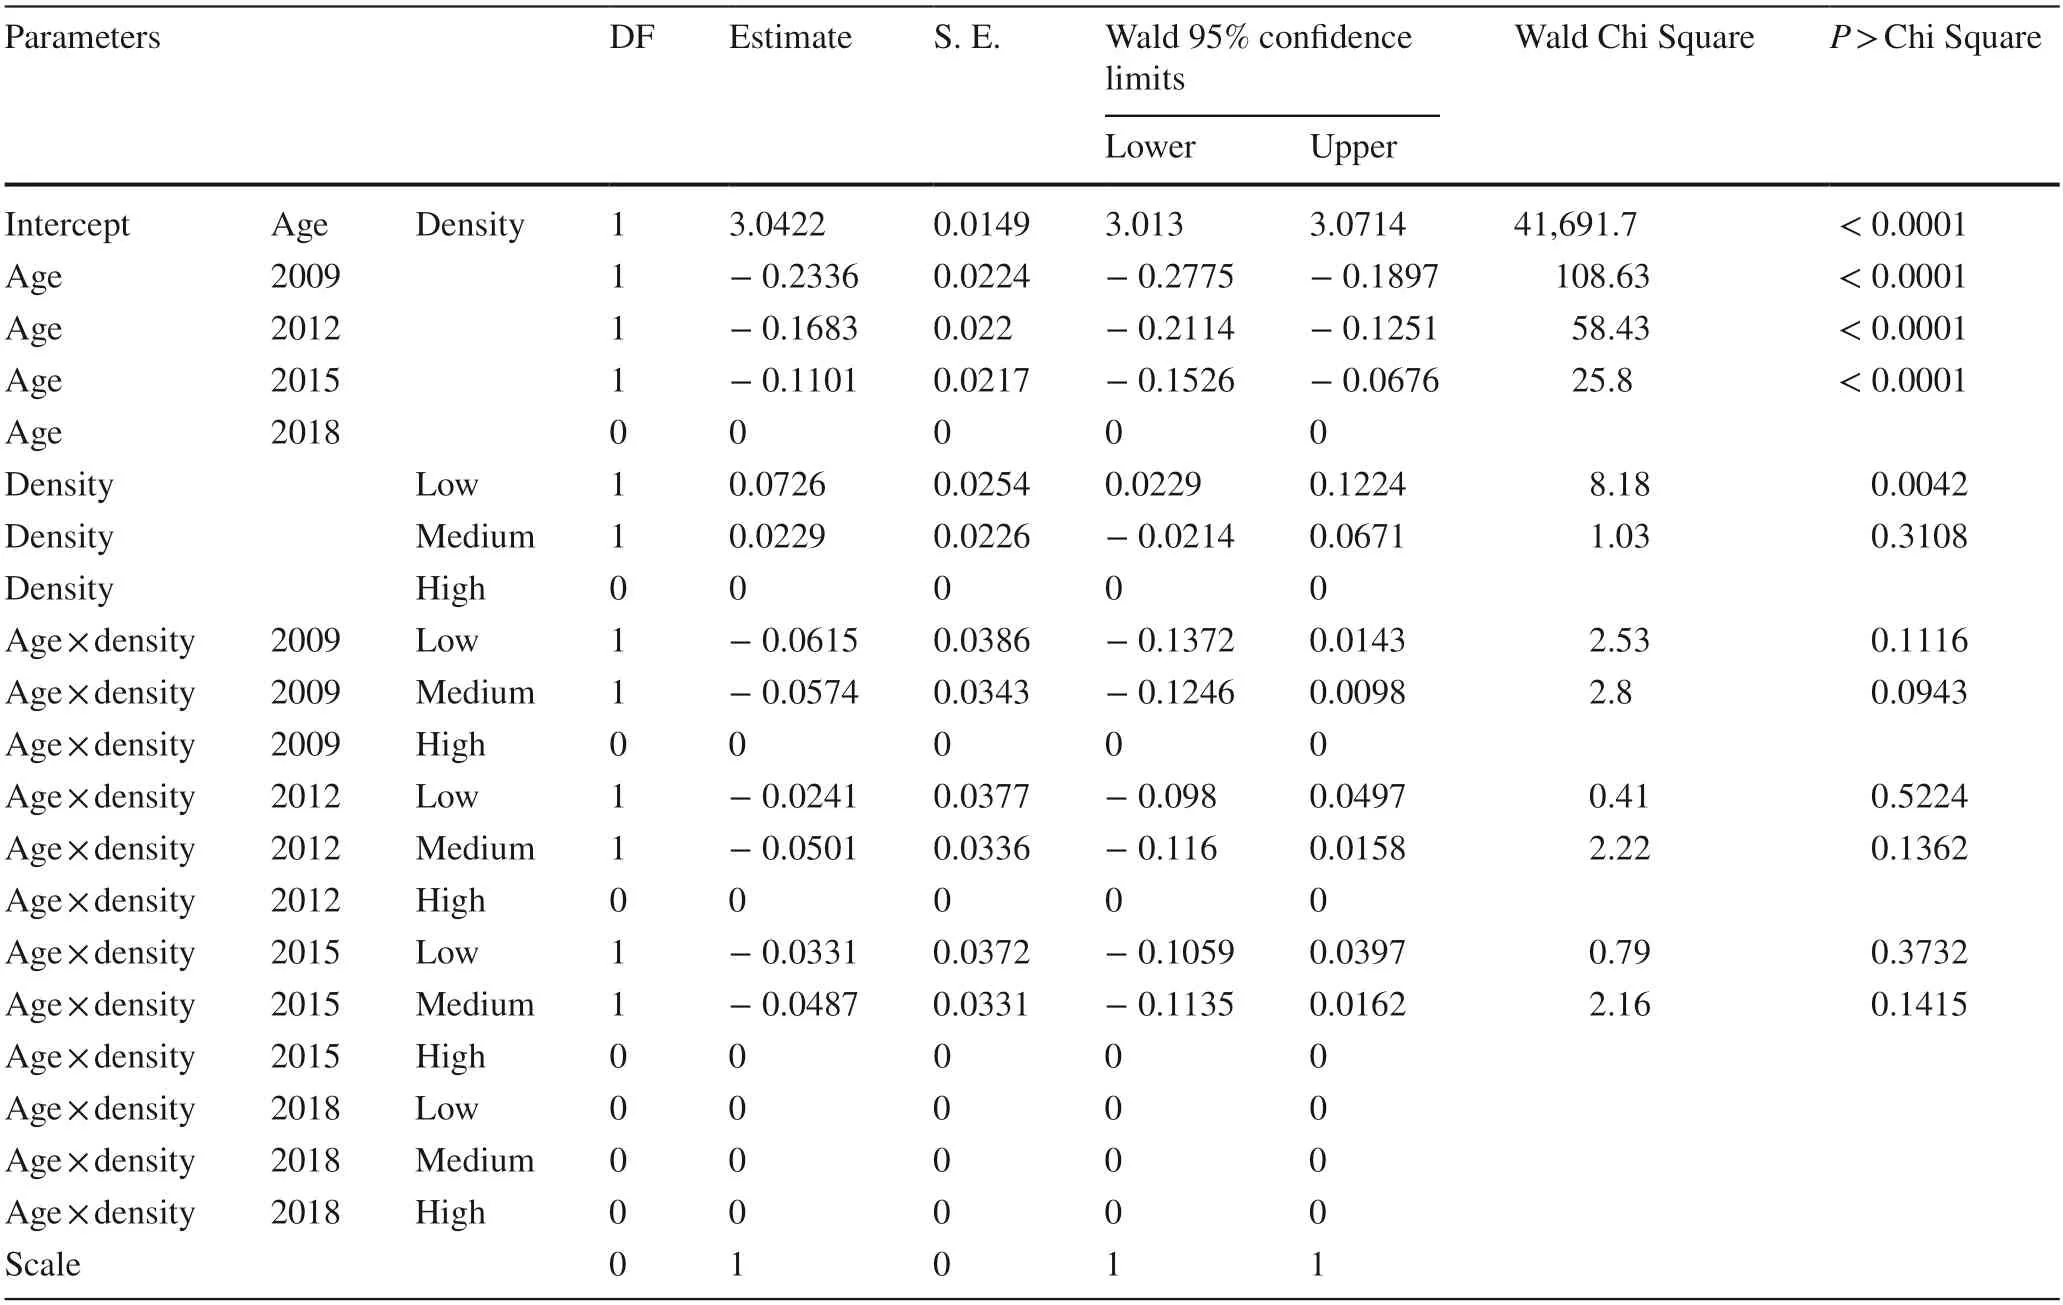
Table 5 Maximum likelihood estimate on Poisson regression of age and density on height in trees of Cunninghamia lanceolate plantations
Discussion
Although our data about biomass C estimates were calculated using the cubic-root transformed value to meet the standard of ANOVA,raw data can be comparable to those in mature Chinese fir plantations at an age around 25 −30 years old.Biomass C was estimated to be 169.09–219.40 kg per whole-tree individual,which fell in the range between 92.22 and 267.73 kg per tree that was estimated by Zhang et al.(2013).The estimated biomass density was 4.00–6.64,3.87–6.30,65.26–102.92,18.48–29.36,and 89.69–143.98 t ha−1for leaves,branch,stem,root,and whole-tree,respectively.The estimated amount of biomass density was also given by Fang et al.(2019) to be 7.5,16.3,152,23,and 234 t ha−1for these organs,respectively.Therefore,our estimated value at the stand-level was generally lower than in Fang et al.(2019) except for in root.Thus,the model used in this study can result in estimated values at an acceptable precision.
We found an interactive effect between stand age and density on height in trees of Chinese fir plantations,which partly agrees with our first hypothesis that growth and biomass C increased with age in lower densities as a response to the interactive effects.Surprisingly,despite a lower tree heightin the medium density stands during the early stage,the height was then higher than that in the high density stands after 9-year growth.For the relationship between height and DBH,the maximum value of tree height kept increasing only in the medium density with a stable increasing ratio of the exponential function.Hence,in the medium stand density,tree height increased at a stable pace with DBH due to the unchanged coefficient b in the regression model.Our results for tallest tree stem in low density disagree to those in investigations on Chinese fir plantations in Fujian,Jiangxi,Guangxi,and Sichuan Provinces,China (Zhang et al.2019).This is because the initial planting density and management practice were different in our study than in former studies.We planted 1800 seedlings ha−1before thinning but previous studies usually planted 2000 seedlings ha−1at the start without thinning.We chose the shorter trees to be subjected to thinning,therefore the low-density stand received more thinning leaving large trees with taller stems.
It was surprising to find that DBH and TV were not responsive to the interaction between stand age and density.This was indicated by methods of not only ANOVA but also Poisson regression model.We thinned twice expecting to concur with evidence that doing so can cause positive response of biomass C through promoting diameter increase(Schaedel et al.2017).We surmise that our thinning strategy to reserve large ones without focus on density control was mainly responsible for the null response to the interaction,but previous thinning had been made to control the density.As our data estimated,to the most extent two models together determine the same effect.Because our biomass C was estimated based on data of height and DBH,tree biomass C was also found to be null to the interaction between age and density.Although it was speculated that an age of 23 years may be the peak of increase of biomass C in Chinese fir trees (Zhao et al.2009;Yen and Lee 2011),our study further illustrated that this increase can be extended up to 30 years.The conventional management of Chinese fir plantations with the aim of maximizing commercial harvest can provide continuous C sequestration in trees without apparent decline (Wang et al.2012;Chen et al.2013;Zhang et al.2016).However,using the thinning management in this study can promote biomass C in large volume trees and contribute to the DBH increment.
Our results on the relationship between height and DBH support our second hypothesis that the relationship between height and DBH changed with stand age.The rise-to-maximum exponential model has also been used several times to describe the allometric relationship between height and DBH in Chinese fir trees (Li et al.2015).In this model,parameters a and b stand for the maximum value and the rate of rise to this limit,respectively.With the increase of DBH,the maximum value of tree height declined from 2009 to 2012 then increased in 2015 to 2018 in both low and high densities according to the coefficient change.A lower maximum value together with higher increasing ratio suggest a faster increase of height to the maximum in a small range of DBH.In both low and high densities,the regression in 2012 reached the maximum value faster than that in 2009.In contrast,from 2015 to 2018 the increase of tree height across DBH slowed down due to higher maximum value but
increasing rate declined at low density.At the same time,the increasing rate between height and DBH in the medium density always remained constant throughout the four ages.These results concur with those from a recent study where changes of height-DBH relationship were found among different competitions that were derived from stand density(Zhang et al.2020).However,the height-DBH relationship among different densities needs to be tested in more regions to further confirm the response of regression coefficients to the variation of densities.This was because Chinese fir plantations are distributed in many regions that have been documented in the above-mentioned studies.
With the increase of stand age,the infinitesimal values for tree height,DBH,and TV all increased (Table 4).However,the critical stand density for tree height and DBH declined from 2009 to 2015 with an increase in 2018,while TV continued to increase throughout all stand ages.With the increase of stand age,both infinitesimal and critical stand density increased for estimated biomass C in all tree organs (Table 4).Some studies have shown that Chinese fir tree carbon storage increased with the number of stems in stands (Zhao et al.2009;Tang et al.2016).However,the variation of stand densities in these studies originated from the age-related development of natural thinning.Therefore,the increase of tree biomass C in Chinese fir plantations resulted from the accumulation across age but not the effect from density.Chinese fir tree biomass C can accumulate to increase in biomass with time (Xie et al.2016),but thinning was not found to have any effect on biomass C in Chinese fir trees in a long rotation of 50 years (Schaedel et al.2017).In contrast,our results showed that tree biomass C declined with the increase of stand density which resulted from the decreases of height and DBH in high density stands.As the lower limit of estimated C increased with stand age,there is no obvious trend of maximum lower limit in our time range.Therefore,our study term could be prolonged if the sequestration of C in biomass was set as the main goal of Chinese fir management.In addition,the density control in our study of fewer than 1000 stems ha−1was too low for biomass C because the critical density indicated by regression was generally higher than 1300 stems ha−1for initial planting density in previous studies (Tang et al.2016;Zhang et al.2019).Future studies are needed to detect the potential maximum of biomass C with the increase of stand density.

Table 6 Maximum likelihood estimate on Poisson regression of age and density on diameter at breast height (DBH) in trees of Cunninghamia lanceolate plantations
Conclusion
We planted Chinese fir seedlings to construct a 15-ha plantation which was then thinned twice to have three divisions with different stand densities of low,medium,and high levels.The C storage responded in low and medium densities through longer rotation due to the depression on height and DBH was alleviated over a longer time.We did not find any significant interaction between stand age and density on measured and estimated variables except for height which disagrees with our hypothesis.However,thinning can promote C storage in Chinese fir plantations through growth improvement.Height and DBH were only maintained in a constant allometric relationship at thedensity of about 670 stems ha−1.For management implications,a near-mature Chinese fir plantation at a density of 1500 stems ha−1and 20 years old is suitable for timber harvest but a rotation as long as 30 years is needed to promote biomass C in mature stands over 30,000 stems ha−1.This was indicated by the model and needs to be confirmed by future trials.Future work is suggested to develop new models for biomass C estimation at the community scale in more stands across regions.
Open AccessThis article is licensed under a Creative Commons Attribution 4.0 International License,which permits use,sharing,adaptation,distribution and reproduction in any medium or format,as long as you give appropriate credit to the original author(s) and the source,provide a link to the Creative Commons licence,and indicate if changes were made.The images or other third party material in this article are included in the article’s Creative Commons licence,unless indicated otherwise in a credit line to the material.If material is not included in the article’s Creative Commons licence and your intended use is not permitted by statutory regulation or exceeds the permitted use,you will need to obtain permission directly from the copyright holder.To view a copy of this licence,visit http://creativecommons.org/licenses/by/4.0/.
杂志排行
Journal of Forestry Research的其它文章
- Flexible transparent wood enabled by epoxy resin and ethylene glycol diglycidyl ether
- Diversity and surge in abundance of native parasitoid communities prior to the onset of Torymus sinensis on the Asian chestnut gall wasp (Dryocosmus kuriphilus) in Slovenia,Croatia and Hungary
- Ozone disrupts the communication between plants and insects in urban and suburban areas:an updated insight on plant volatiles
- Testing visible ozone injury within aLight Exposed Sampling Site as aproxy for ozone risk assessment for European forests
- Logging and topographic effects on tree community structure and habitat associations in a tropical upland evergreen forest,Ghana
- Spatial pattern dynamics among co-dominant populations in early secondary forests in Southwest China
