Biogeographic divergence in leaf traits of Sapindus mukorossi and Sapindus delavayi and its relation to climate
2021-07-15XinWangJimingLiuXueRuiYuanyuanXuGuochunZhaoLixianWangXuehuangWengZhongChenLimingJia
Xin Wang·Jiming Liu·Xue Rui·Yuanyuan Xu·Guochun Zhao·Lixian Wang·Xuehuang Weng·Zhong Chen·Liming Jia
Abstract To explore differences in leaf morphology between Sapindus mukorossi and Sapindus delavayi,and how the environment might drive these differences,80 germplasm samples from the Sapindus germplasm nursery in Fujian Province were selected.The study revealed a wide variation and diversity in 16 germplasm traits,both within and between species grown under the same conditions.On average,the relative contribution of intraspecific variability to total variability was more important (83%) than the relative contribution of interspecific variability (17%).PERMANOVA analysis showed differences in leaf let thickness,length,perimeter,length to width ratio,and leaf hairs or trichome density.Correlation analyses between leaf morphological traits and environmental variables indicated that leaves tended to be larger,longer,and thicker in wetter,warmer,and low-altitude conditions.Our analysis of the relationship between climate and leaf morphology revealed that S.mukorossi had a greater sensitivity to climate variation,particularly in response to mean temperatures of the coldest and warmest seasons,which led to differences in leaf traits and the distribution of the two species.These findings contribute to the understanding of leaf morphology variations in S.mukorossi and S.delavayi,and provide a basis for the collection of Sapindus germplasm resources,their cultivation and use to help address climate change.
Keywords Climate·Leaf morphology·Sapindus delavayi·Sapindus mukorossi
Introduction
The phenotype of a plant is the three-dimensional expression of genes in space and time after interaction with the environment,and ultimately results from the selective expression of genetic information in gene-environment interactions(Xu et al.2019).As the most direct embodiment of genetic diversity,phenotypic variation is the simplest method for detecting it.Therefore,studying phenotypic diversity is crucial for obtaining population differentiation information and for developing genetic improvement strategies (Ragamustari and Sukara 2019).Research on phenotype-environment relationships helps to reveal the role of genetic and environmental factors in the ecological adaptation of plants (Li et al.2018).Furthermore,Royer (2012) and Peppe et al.(2011)have reconstructed regional paleoclimatic information based on such relationships.
As a main component of plant structure and the interface of light capture,gas exchange,and temperature regulation,leaves are the primary organ that link the entire plant to the environment;moreover,leaf traits are the product of both the ecological environment and evolutionary history of the plant (Yan et al.2014).Several studies have demonstrated that climate variation across a geographic range can lead to variations in morphological traits,including leaf shape,size,thickness,and leaf-vein characteristics,possibly reflecting local adaption under selection pressures (Peppe et al.2011;Glennon and Cron 2015;McKee 2017).Wright et al.(2017)investigated worldwide patterns in leaf size and found that large-leaved species predominate in wet,hot,sunny environments,whereas small-leaved species are typical of hot,sunny environments under arid conditions.In addition,Peppe et al.(2011)’s study of 92 globally distributed sites suggested that leaves in cold climates typically have larger,more numerous teeth.Thus,the study of leaf diversity and its relationship with climate can reveal genetic variations of plants and their adaptation to the environment.This approach can also make full use of underutilized plants such as theSapindusgenus.
Sapindus(Sapindaceae) comprises 13 species and is globally distributed in warm temperate to tropical regions of the Americas,Asia,and Oceania.Among these species,Sapindus mukorossiGaertn.andSapindus delavayi(Franch.) Radlk.are native in southwest to eastern China(Liu et al.2017).The two species are rich in saponin(35.5% and 36.2%,respectively) and oil (14.2% and 11.8%,respectively) (Sun et al.2018),and thus have good potential for use as renewable energy,in biomedicine,and in agriculture (Guo et al.2011;Wu et al.2013;Xu et al.2013).In addition,the foliage and fruit contribute to its aesthetic value as an ornamental tree.Recent studies have mainly focused on the extraction,separation,and application of effective components fromSapindusfruits(Xu et al.2013;Swarnavalli et al.2017) and their genetic structure (Mahar et al.2017).However,little information is available on the epidermal characteristics and systematic significance ofSapindusleaves (Cao and Xia 2008;Cao et al.2014).The leaves ofS.mukorossiandS.delavayiare compound and the leaflets exhibit a wide diversity of shapes,sizes,and arrangements among different provenances,thus serving as good material for the study of leaf morphological diversity and leaf phenotype responses to the environment.
Leaf phenotype is susceptible to short-term environmental impacts;therefore,to avoid these and focus on long-term environmental (genetic) impacts,the samples in this study originated from aSapindusgermplasm nursery.The nursery collectsSapindusgermplasm resources from many regions in China covering its natural distribution area.The objective of the present study was to examine leaf phenotype diversity and geographic climateadaptive mechanisms ofS.mukorossiandS.delavayiby conducting phenetic analyses of 80 accessions to inform breeding protocols and address future climate change.
Materials and method
Investigation and conservation of Sapindus germplasm sources
Field investigation and collections ofSapindusgermplasm worldwide were undertaken from 2014 up to the present,the areas covered the natural distribution ofSapindus,including in China and in Southeast Asian countries.CollectedSapindusgermplasm were conserved in Jianning County,Sanming City,Fujian Province,China (27° 06′ N,117° 25′ E),where the average temperature is 17.4 °C,the maximum is 36.8 °C(July),the minimum is 4.3 °C (January),and average relative humidity is 83.9%.Based on the growth status of each germplasm sample,65 germplasm ofS.mukorossiand 15 ofS.delavayiwere selected (Table 1),covering most of their natural range in China (latitudes 23° 7′–35° 29′,longitudes 99° 9′–121° 51′,and elevations 6.18–1861 m a.s.l.).Origins of selected germplasm collection sites are shown in Fig.1.

Fig.1 Source map of 80 Sapindus germplasm
Collection of seed source environmental data
Geographical information of the origin of the germplasm(longitude,latitude,and altitude;Table 2) were obtained with a handheld GPS unit (JUNO SCSD,Trimble,Sunnyvale,CA,USA).Climate data were also obtained from the Global Climate database (http://world clim.org/versi on2),which provides rasterized global meteorological data.Twenty climate variables of the provenances were captured by the corresponding layers using ArcGIS,and a total of 20 meteorological factors were collected.Using correlation analysis,factors with a strong correlation (r2≥ 0.9) were removed.The final 15 meteorological factors and three geographic factors are shown in Table 2.
Scanning electron microscopic observation
Sample preparation was according to Liu et al.(2007).After post-fixing,samples were washed twice for 10 min in phosphate buffer (0.1 M) at pH 7.2,and dehydrated in increasing concentrations of ethanol and soaked in increasing concentration gradients of tert-butyl alcohol (ethanol and tert-butyl alcohol concentration ratio:3:7,5:5,10:0).Samples were dried,sputter-coated with gold,observed with a Hitachi S-3400 N II electron microscope and photographed.
Measurement of morphological traits
Three healthy trees of each accession were selected,and from each tree,five compound leaves on annual spring shoots were harvested.Sixteen characteristic indexes ofS.mukorossiandS.delavayileaves were observed,including:(1) 6 qualitative traits–leaf let petiole color,leaf let degree ofoverlap,color,foliar luster,veins;(2) 10 quantitative traits–length,width,area,shape index,perimeter,length/width of leaf lets,rachis length,thickness of leaf lets and leaf let epidermal hair density (Table 3).
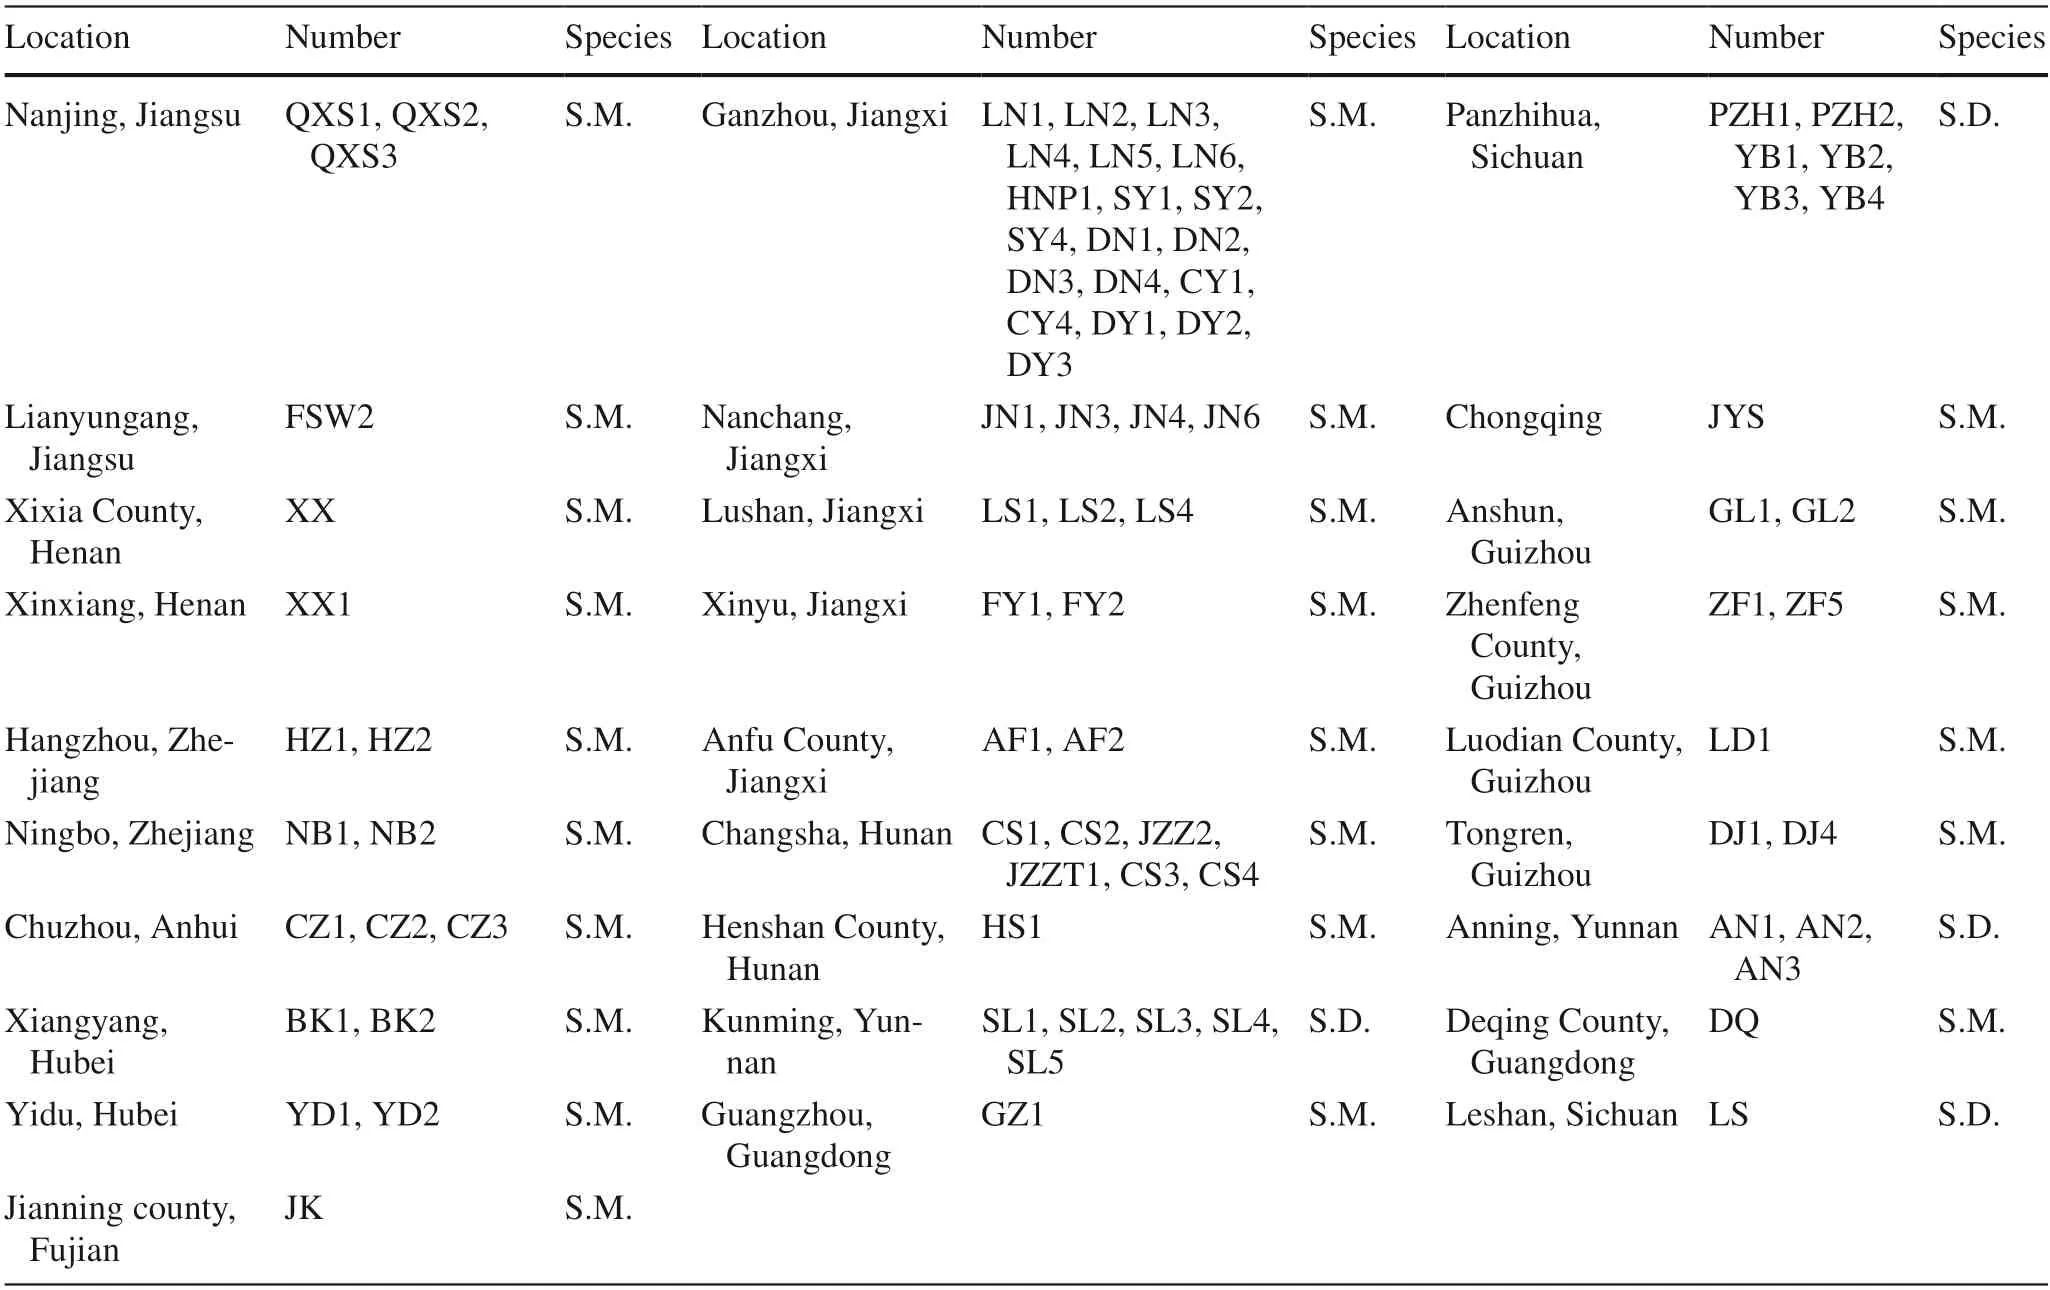
Table 1 Sampling locations and sample numbers of S.delavayi (S.D.) and S.mukorossi (S.M.) accessions

Table 2 Environment variables used to analyze relationship between climate and leaf traits of the two Sapindus species
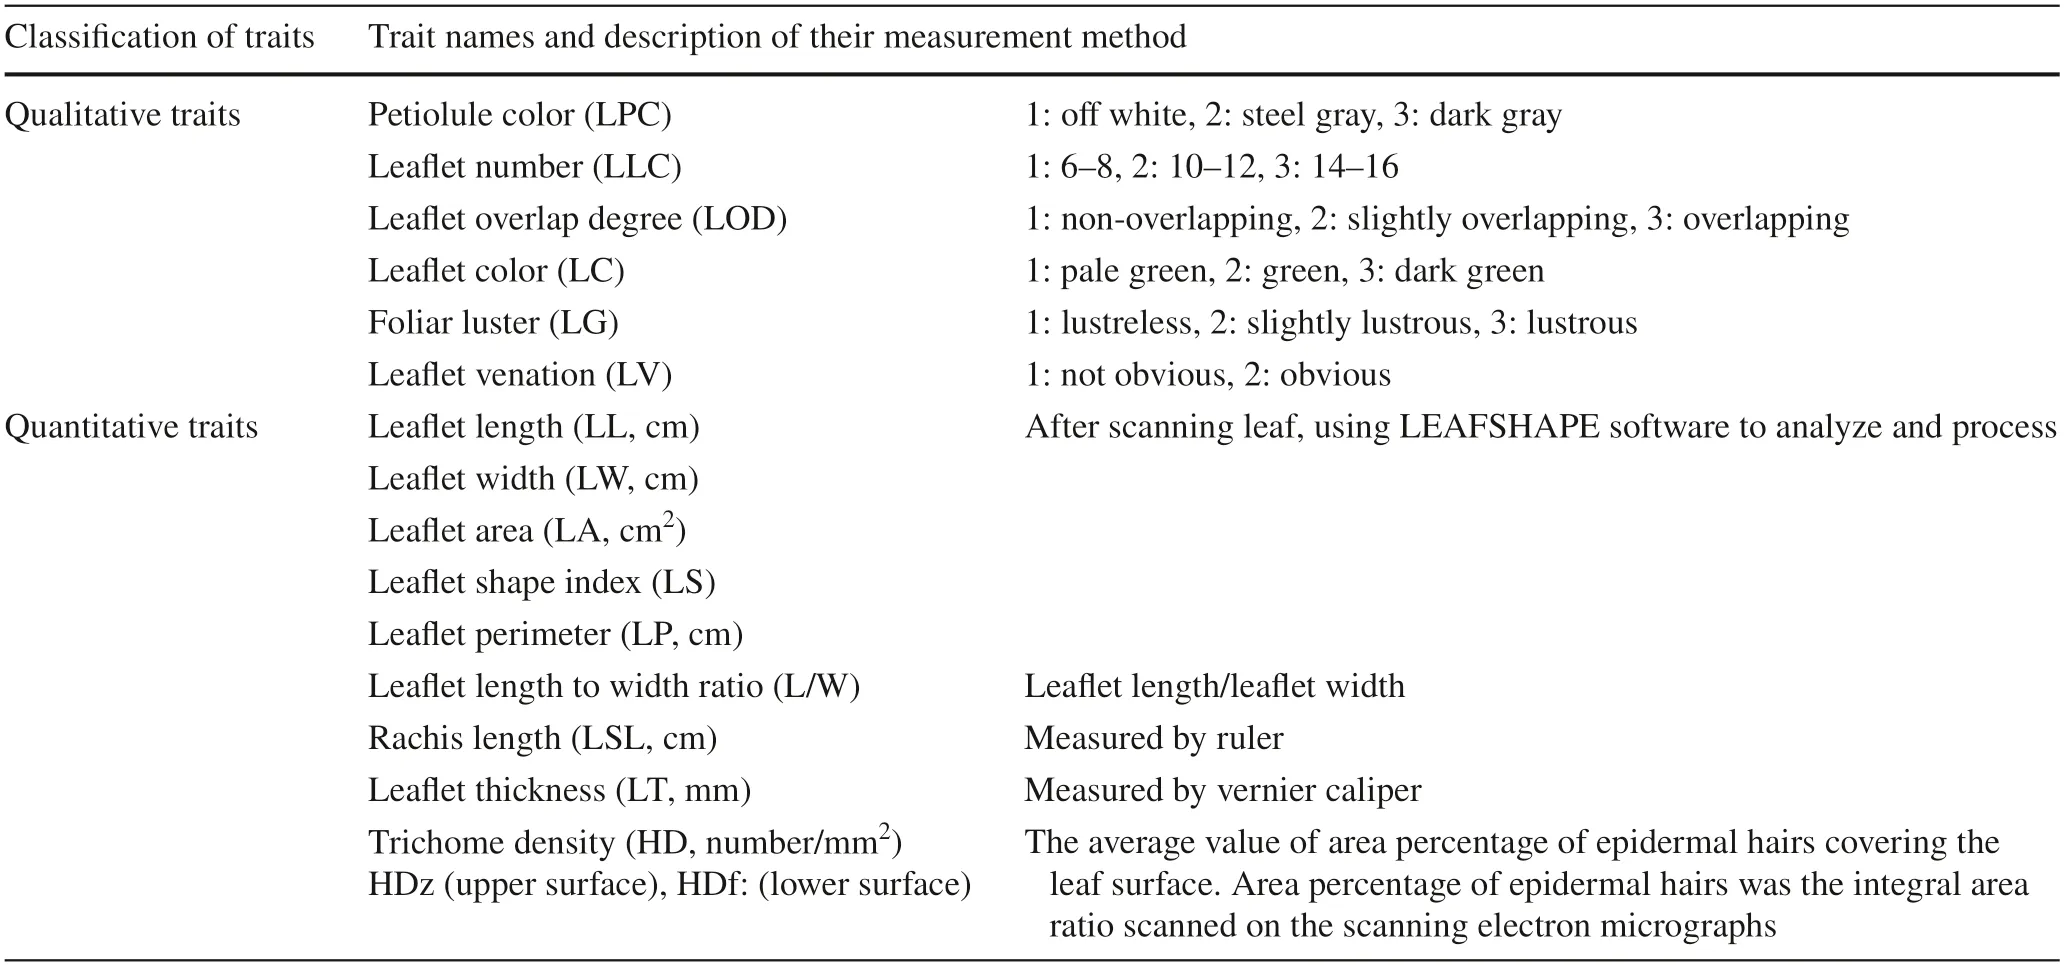
Table 3 Measurements of morphological traits
Calculation of the frequency of each rank within each trait
Data were gathered to characterize the collection of each species separately as well as to calculate phenotypic diversity based on the Shannon–Wiener genetic diversity index(H) and following the calculations of Sun et al.(2017).Coefficient of variation (CV) was used as an indicator of the variability of traits using the formula:CV=standard deviation/mean.The significance of interspecific differences among all traits was determined using PERMANOVA based on the Bray–Curtis distance.PERMANOVA is a powerful non-parametric method for detecting differences in community structure (Anderson and Walsh 2013).In this study,this method was applied to interspecific differences of traits at a level of significance ofP< 0.05.
The Helinger transformation was used for all trait variables.All environmental variables were standardized.Relationships between each trait and each environment variable were determined using Pearson correlation analysis.Mantel tests determined the environmental factors that were significantly related to variations inS.mukorossiandS.delavayileaf morphological traits.Transformation-based redundancy analysis (tb-RDA) was conducted to further explore the key environmental factors that cause differences in the distribution ofS.mukorossiandS.delavayileaf phenotype traits.To avoid effects of collinearity among environmental variables,variance inflation factor analysis was used prior to tb-RDA.All analyses and visualizations were performed using R version 3.6.1 (https://www.r-proje ct.org/).
Results
Leaf morphological diversity and distribution characteristics
Several leaf traits exhibited similar diversity indices(H=genetic diversity index) betweenS.mukorossiandS.delavayi,including LV (0.14 and 0.00,respectively),LC(0.99 and 0.89,respectively),LLC (0.67 and 0.85,respectively),and LG (0.92 and 0.63,respectively) (Table 4).The majority ofS.mukorossiandS.delavayiindividuals had 10–12 green leaflets lacking brightness and with obvious veins.In contrast,relatively large differences betweenS.mukorossiandS.delavayiwere observed for the H values of several traits,including LOD (0.22 and 0.67,respectively) and LPC (0.93 and 0.24,respectively).
Morphological differences between S.mukorossi and S.delavayi leaves
With the exception of HD,distributions ofS.mukorossitraits were higher than those ofS.delavayi(Fig.2).The range of values of the HD and L/W trait ofS.mukorossiwere lower than those forS.delavayi.In contrast,the ranges for the LSL and LT traits ofS.mukorossiwere higher than those ofS.delavayi.
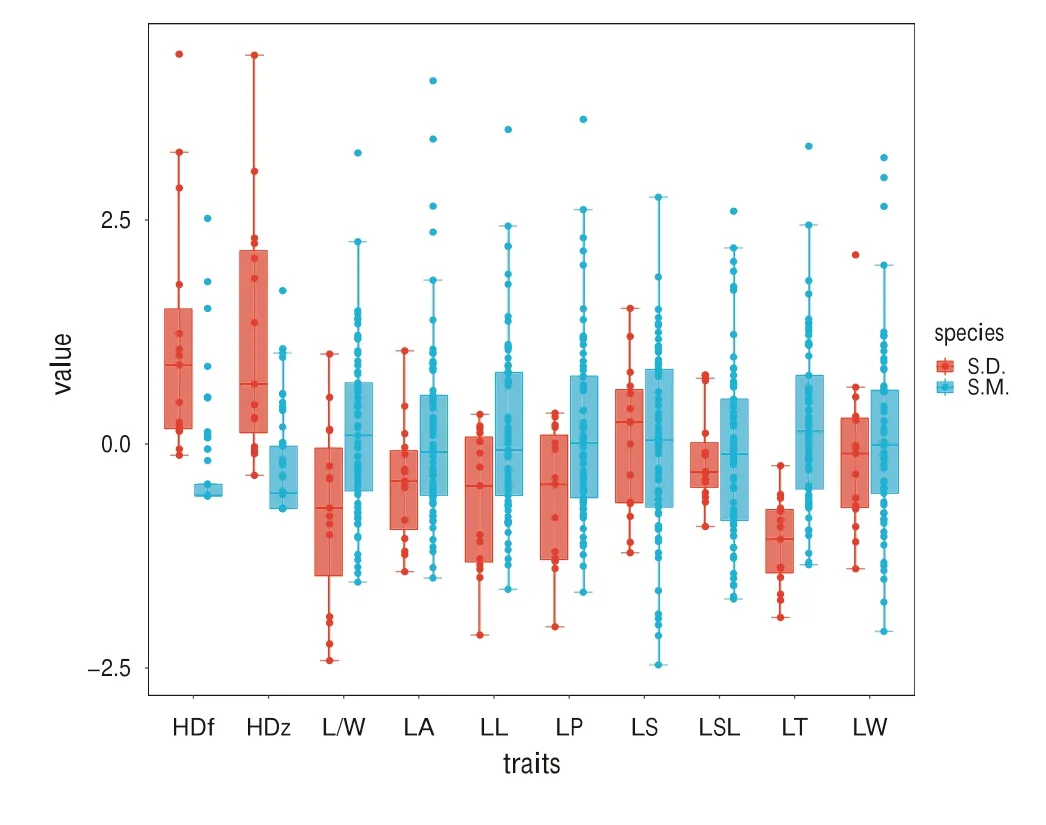
Fig.2 Variation and distribution of S.mukorossi and S.delavayi leaf morphological traits.LL leaf let length,LW leaf let width,LA leaf let area,LS leaf let shape index,LP leaf let perimeter,L/W leaf let length to width ratio,LSL rachis length,LT leaf let thickness,HD trichome density,S.M.S.mukorossi,S.D.S.delavayi
The CV,used here as a measure of the degree of population differentiation,ranged from 4 to 228.2% forS.mukorossiand from 3.2 to 77.6% forS.delavayi(Table 5).With the exception of the CV of the L/W,the CVs of theS.mukorossitraits were much higher than those ofS.delavayi,demonstrating that the variability of most leaf morphological traits ofS.mukorossiwas higher than that ofS.delavayi.Furthermore,the CV values for the HDf and HDz ofS.mukorossiwere 2–3 times larger than the corresponding values ofS.delavayi.
WithS.mukorossi,the H values ranged from 0.9 to 2.0,whereas those inS.delavayiranged from 1.4 to 1.7(Table 5).The H values of most traits (with the exception of HDz) were higher inS.mukorossithan inS.delavayi.The highest H values forS.mukorossiandS.delavayiwere observed for leaflet shape index (LS) (2.0 and 1.7,respectively),and the lowest H values were observed for upper trichome density (HDz) (0.9) inS.mukorossiand for rachis length (LSL) (1.2) inS.delavayi.
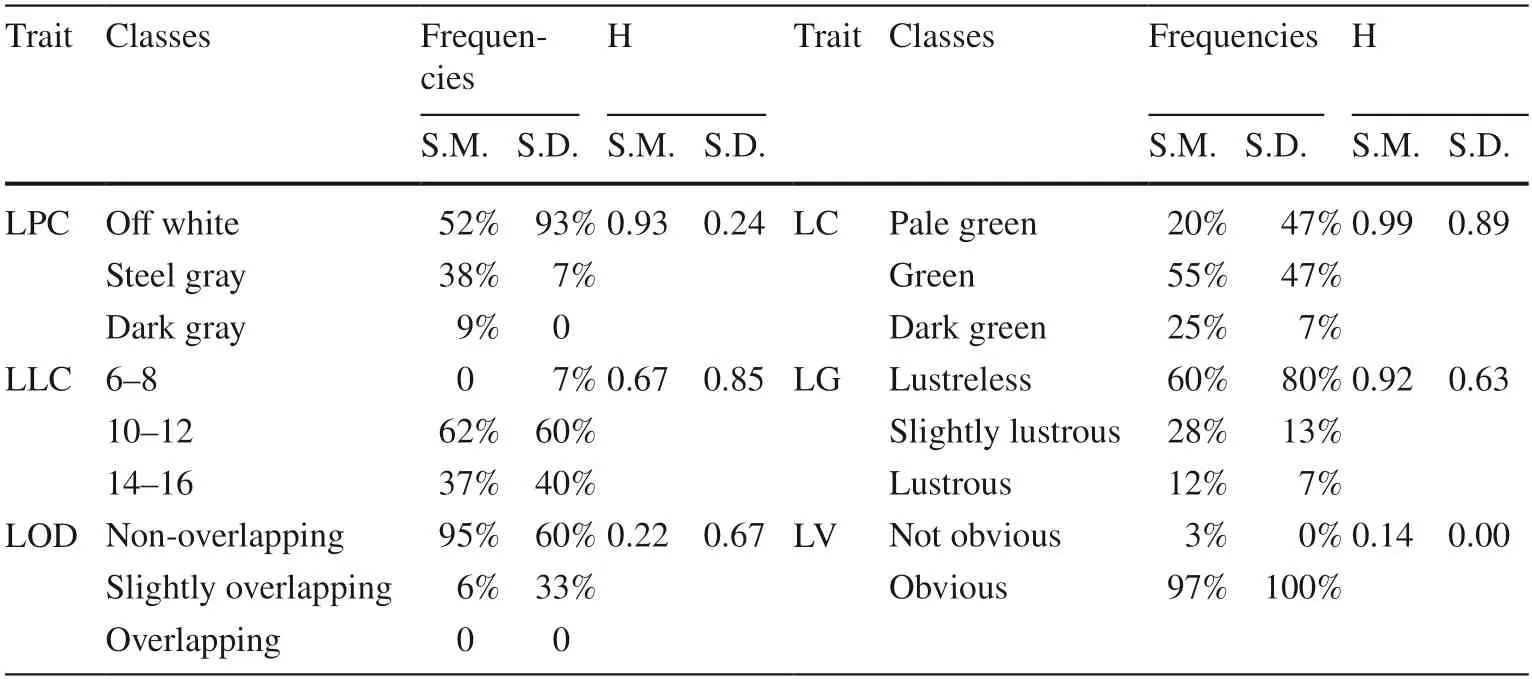
Table 4 Distribution characteristics and diversity of leaf qualitative traits

Table 5 Descriptive statistics of S.mukorossi and S.delavayi leaf traits
Sapindus mukorossi leaf morphological diversity and distribution
Sapindus mukorossileaf morphological traits exhibited broad ranges of variation and diversity,whereas its LS and LT showed uniformly stable distributions.Its trichrome density exhibited strong variation and discreteness,was genetically unstable and prone to geographical differentiation.
The CV values of the ten morphological traits ofS.mukorossiwere significantly different,with the greatest variation for HDz and HDf (CVs:228.2% and 143.8%,respectively) (Table 5).In addition,the CV of LS was lowest (4.0%),with a range of 0.62–0.68,indicating that this trait is stable.
The ten morphological traits exhibited moderate diversity index values,with a mean value of 1.8.LT had the highest H value (2.1),whereas HDz had the lowest H value (1.2).
Sapindus delavayi leaf morphological diversity and distribution
There was considerable variation in the CV values among the ten morphological traits ofS.delavayi(Table 5).With the exceptions of HDz and HDf,the CV values of all the other traits were below 20%.The CV value was highest for HDz (77.6%),with a range of 1.3–10.6 N mm−2,and the most stable for LS (3.2%),with a range of 0.6–0.7.
The average leaf morphological diversity ofS.delavayiwas moderate,with an H value of 1.5.The HDz exhibited the highest H value (1.4),whereas LSL exhibited the lowest (1.2).
Sources of variation in S.mukorossi and S.delavayi leaf morphological traits
Based on the PERMANOVA analysis,S.mukorossiandS.delavayishowed significant differences (P< 0.01) in leaf morphological traits.The following contributed most to interspecific differences:HDf,LT,HDz,L/W,LP,LL,and LPC (Table 6).Further analysis indicated that a large portion of morphological variations could be explained by intraspecific variation (0.83) rather than interspecific variance (0.17),among which LT (leaf let thickness) and HDf(upper trichrome density) explained the maximum interspecific variation.Overall,these findings indicate that most of the variation in leaf morphological traits occur within,rather than between species.
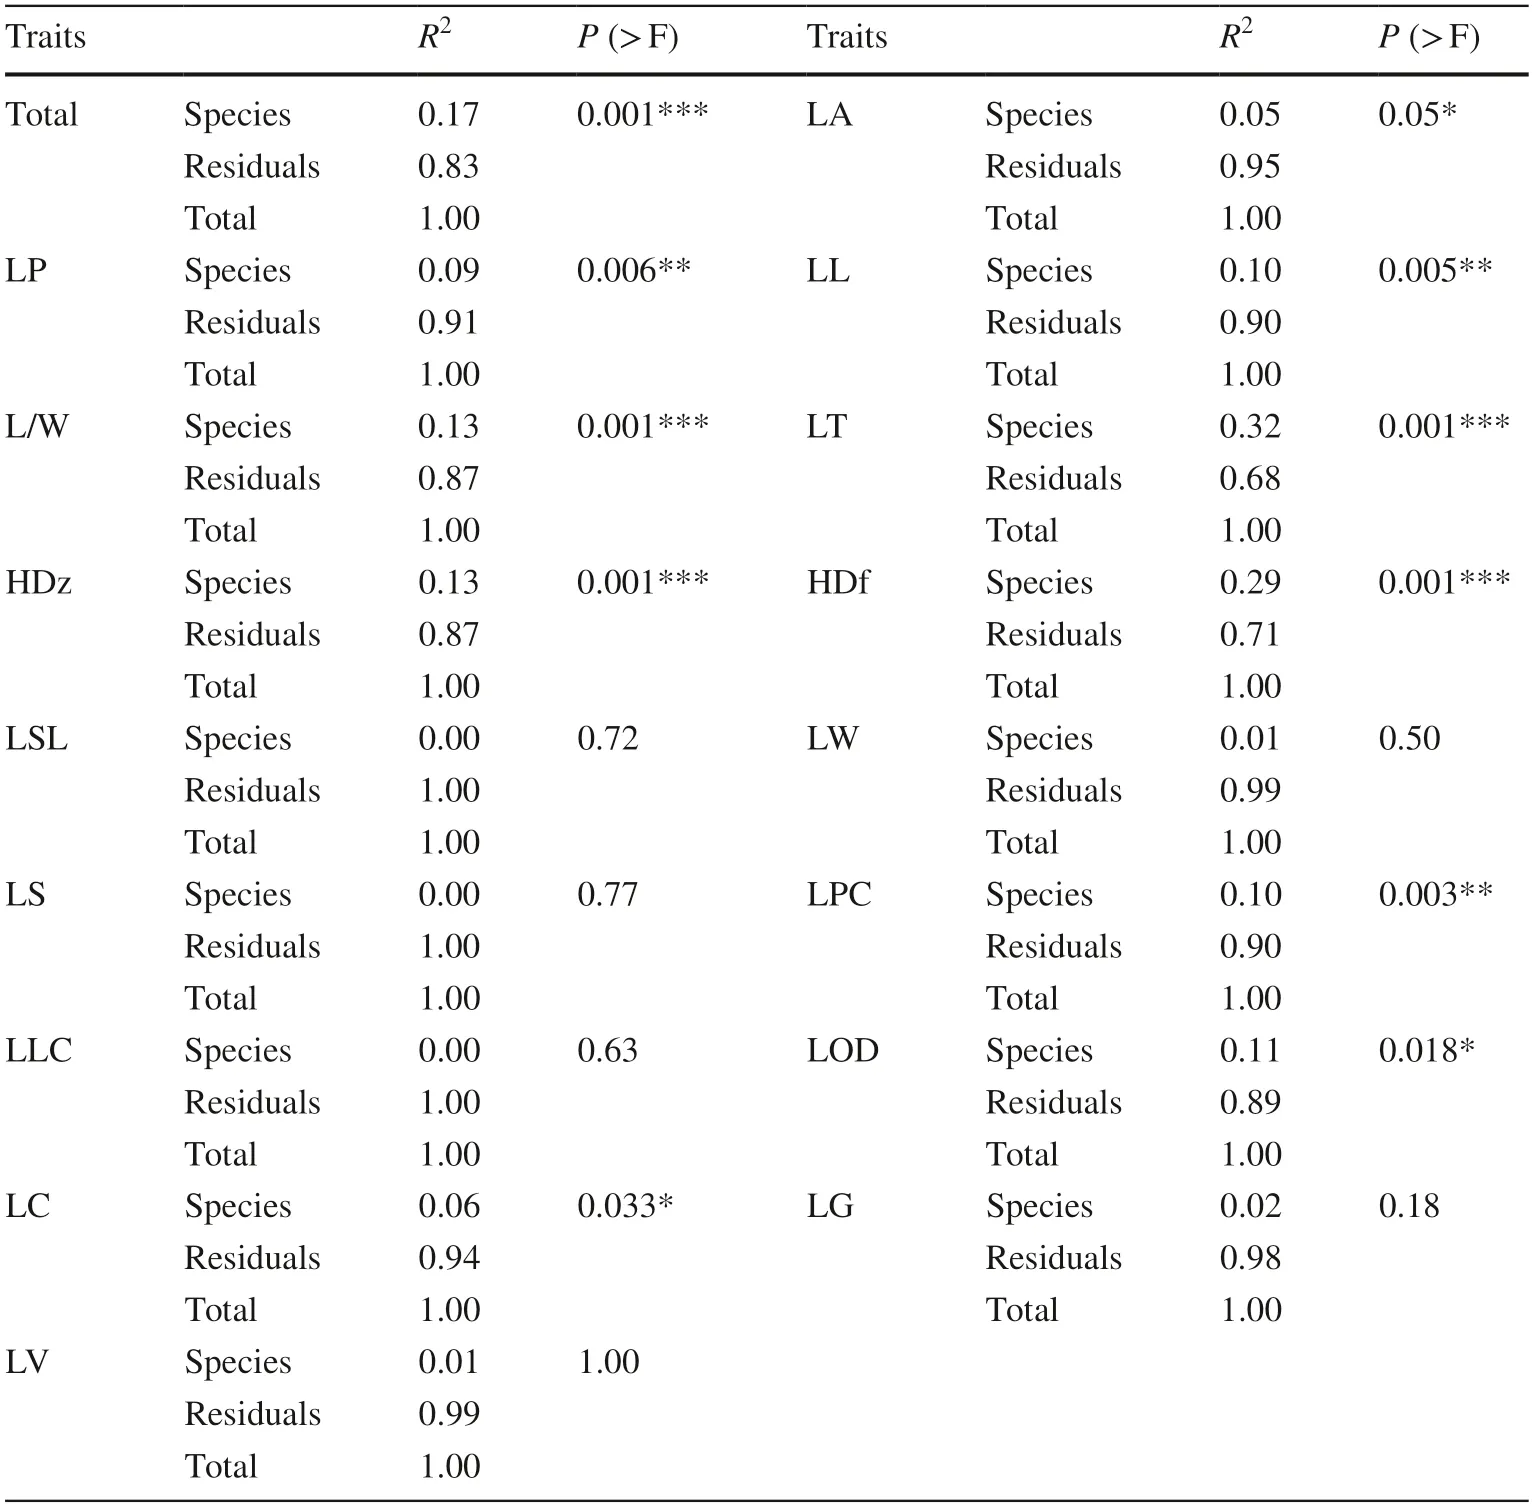
Table 6 Results of PERMANOVA test for interspecies differences in leaf traits between S.mukorossi and S.delavayi
Responses of leaf morphological traits to the seed source environment
Pearson correlation analyses revealed several significant associations between morphological traits and environmental variables (Fig.3).HDz was negatively correlated with Bio1 (annual mean temperature) (r=−0.48,P< 0.01)and Bio16 (precipitation of wettest quarter) (r=−0.43,P< 0.05) and positively correlated with Bio20 (solar radiation) (r=0.48,P< 0.01).HDf was significantly correlated with Bio2 (mean diurnal range) (r=0.47,P< 0.001) and Bio20 (r=0.45,P< 0.001).Three traits,including LT,LP,and LL were negatively correlated with Al (altitude) and Bio15 (precipitation seasonality),and positively correlated with Bio10 (mean temperature of warmest quarter),Bio17(precipitation of driest quarter),and Bio19 (precipitation of coldest quarter).LW was positively correlated with Lon(longitude),Bio10,and Bio19,and negatively related to Al.

Fig.3 Correlation between phenotypic traits and environmental variables.Note Pairwise comparisons are a color gradient denoting Spearman’s correlation coefficient.Only results that had statistical significance (P < 0.05) are in color,and ‘***’ represents P < 0.01.Lon longitude,Lat latitude,Al altitude;Bio1 annual mean temperature,Bio2 mean diurnal range,Bio3 isothermality,Bio4:temperature seasonality,Bio7 temperature annual range,Bio8 mean temperature of wettest quarter,Bio9 mean temperature of driest quarter,Bio10 mean temperature of warmest quarter,Bio11 mean temperature of coldest quarter,Bio15 precipitation seasonality,Bio16 precipitation of wettest quarter,Bio17 precipitation of driest quarter,Bio18 precipitation of warmest quarter,Bio19 precipitation of coldest quarter,Bio20 solar radiation;LL leaf let length,LW leaf let width,LA leaf let area,LS leaf let shape index,LP leaf let perimeter,L/w leaf let length to width ratio,LSL rachis length,LT leaf let thickness,HD leaf let epidermal hair density,LPC petiolule color,LLC leaf let number;LOD leaf let overlap degree;LC leaf let color,LG foliar luster;LV leaf let venation
The results of the Mantel tests indicate that the twoSapindusspecies varied in their relationship with environmental variables (Fig.4).Almost all environmental variables had a significant effect on leaf morphological variations ofS.delavayi(except for Bio3 and Bio4),among which Bio8(mean temperature of wettest quarter) and Bio10 had the most significant effects (Mantel’sR> 0.5,P< 0.05).Nevertheless,only two variables,Lat (latitude) and Bio11,had significant effects on leaf morphological variations inS.mukorossi.These findings demonstrate that environmental factors more strongly affect leaf morphological traits ofS.delavayithan those ofS.mukorossi.
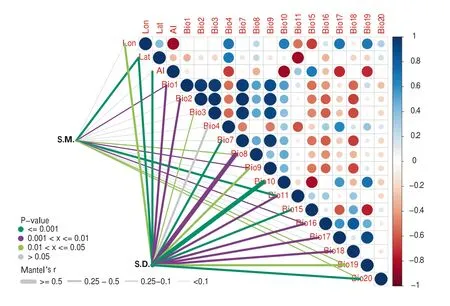
Fig.4 Relationships between environmental variables and morphological variations.Note Pairwise comparisons of environmental factors are in color denoting Spearman’s correlation coefficient;leaf trait distribution was related to each environmental factor by partial Mantel tests.Edge width corresponds to the Mantel’s r statistic,and edge color denotes the statistical significance based on 9999 permutations
A transformation-based redundancy analysis (tb-RDA)revealed that Bio10 and Bio11 significantly affected leaf morphological differences betweenS.mukorossiandS.delavayiand separated them into two significantly distinct groups (P=0.001;Fig.5).Leaf morphological traits significantly differed between the twoSapindusspecies along the RDA1 and RDA2 axes (Fig.5 b,c).In addition,the RDA1(39.9% variance explained) was strongly correlated with Bio10,whereas the RDA2 (2.4% variance explained) was strongly correlated with Bio11 (Fig.5 a).Several environmental factors formed distinct clusters based on their effects on the morphological traits ofS.mukorossi.One cluster(LN3-DY3) was positively correlated with Bio11 and Bio18,a second cluster (LS1-FY1) was positively correlated with Bio10,and a third cluster (YD-SY4) was negatively correlated with Bio11,Bio10,and Bio18.Sapindus delavayialso formed different clusters in terms of geography:one cluster primarily originated from Kunming and Yunnan;the other from Panzhihua and Sichuan.

Fig.5 Ordination of the two species by morphological traits with environmental variables.Note Green vectors point to the direction of the increase for a given variable so that germplasms with similar environmental variable profiles and morphological traits are localized in similar positions in the diagram.Bio10 mean temperature of warmest quarter,Bio11 mean temperature of coldest quarter,Bio18 precipitation of warmest quarter
Discussion
Differences in leaf morphology between S.mukorossi and S.delavayi
Our findings suggest that average diversity values for the quantitative traits ofS.mukorossi(H=1.82) andS.delavayi(H=1.51) were moderate.These values are lower than those observed forErythrophleum fordii(H=2.03) (Li et al.2019)andAcer pictumsubsp.mono(H=5.95) (Zhang et al.2015),higher than that forDavidia involucrateBaill.(H=0.536)(Zhang et al.2019),and similar to that forCitrus reticulataBlanco.(H=1.88) (Sun et al.2017).In contrast,the twoSapindusspecies exhibited strong degrees of variation with CV values higher than those forErythrophleum fordiiOliv.(12.4%) andDavidia involucrataBaill.(16.2%) and similar to that forCitrus reticulataBlanco.(30.6%).These comparisons illustrate that leaf traits of the two species varied greatly and exhibited an uneven distribution.These findings may be related to the fact that the sources of the collected accessions were distributed widely across China,and the number of sources differed among regions.Furthermore,plants with high CV values often exhibit strong adaptability to different environments and are therefore often widely distributed.This result is consistent with the observation thatS.mukorossi(higher CV) was distributed more widely than species with lower CV values,includingS.delavayi,Erythrophleum fordiiOliv.,andDavidia involucrateBaill.(Zhang et al.2019).
Significant differences in leaf morphological diversity were found betweenS.mukorossiandS.delavayi;mostS.mukorossileaf traits exhibited higher diversity and variation than those ofS.delavayi.In addition,the 80 germplasm samples analyzed in the tb-RDA (Fig.2) were separated into two groups corresponding to theS.mukorossiandS.delavayigermplasm.Sapindus mukorossiwas further divided into three subgroups;however,the composition of the three subgroups was consistent with climatic environment and not geographical distribution.This result is consistent with that of Sun et al.(2018) who observed a lack of significant correlation between geographical and genetic distances inS.mukorossiandS.delavayigermplasm.Similarly,Diao et al.(2016) reached the same conclusion forS.mukorossigermplasm collected from southern China.Sapindusgermplasm were scattered across a wide area of China with complex and relatively isolated geographical environments.Such long-term geographical isolation may produce local microclimates leading to local differentiation.
Further analysis indicated thatS.mukorossileaf traits were drastically different from those ofS.delavayifor lower trichome density,leaf let thickness,upper trichome density,leaf let length to width ratio,leaf let perimeter,leaf let length,and petiolule color.Compared to those ofS.delavayi,S.mukorossileaf lets were thicker,larger,and longer,with an off-white petiole.This finding is consistent with those outlined in the“Flora of China”(Delectis Florae Republicae 1985),and further demonstrates that these traits can be used as a classification index for the two species.We observed that leaves of some accessions from Langya Mountain,Qixia Mountain,and Lushan Mountain were surprisingly covered with pubescence.One possible explanation for this characteristic may be that alpine climates (low temperature,large temperature difference,and high radiation) promote the growth of epidermal hairs.
Relationship between leaf morphology and geographic climate of seed resources
Leaf morphology is a functional response of plants to environmental changes.Specific environmental inputs modulate distinct molecular pathways,the outputs of which regulate leaf morphology (Chitwood and Sinha 2016).Under the influence of different environments,plants have formed different patterns of geographical variation.
The variation in leaf morphology ofS.mukorossiandS.delavayiwas influenced by climate along latitudinal/longitudinal gradients.Furthermore,climate variables synergistically affected the leaf traits.Leaf lets of both species tended to be larger and longer in low-latitude environments with uniformly high precipitation and temperatures during the warmest quarter.This finding corroborates results forDavidia involucrateBaill.(Zhang et al.2019),Quercus kelloggiiNewberry (Royer et al.2008),fourHelichrysumspecies (Glennon and Cron 2015),andRhododendron mucronulatumTurcz.(Koksheeva et al.2017).Climate could also affect traits with ecological functions,including trichomes and leaf thickness.Our results also demonstrated that a higher density of epidermal hairs was associated with lower mean annual temperatures,rainfall and a higher daily range and radiation intensity;greater leaf thickness was related to more abundant and uniform precipitation and higher temperatures in the warmest quarter.These results are consistent with studies showing that dense leaf hairs or trichomes modulate leaf water,heat and optical balance,radiation absorption,and also protect the leaf from photochemical damage(Liu et al.2015;Bickford 2016).Therefore,epidermal hairs are closely linked to drought,chilling,long-day,and highradiance conditions.With regards to leaf thickness,several studies have shown that in succulent xerophytes,thicker leaves can dramatically regulate temperature (Monteiro et al.2016) and protect the plant from high temperatures,radiation,and drought stress (Leigh et al.2012).In contrast,for plants with thin leaves such asRobinia pseudoacaciaL.(Rashidi et al.2012) andPersea americanaMill.(Chartzoulakis et al.2002),leaf thickness increases with increasing temperature and decreases with decreasing rainfall.Another important finding was that climate had a much stronger effect on leaf morphology ofS.delavayithan that ofS.mukorossi(Fig.4),which may be a result of its wider distribution.In addition,the tb-RDA revealed that the mean temperatures in the warmest and coldest seasons played a key role that caused differences in leaf traits between the two species:S.mukorossiwas better adapted to temperature differences between the coldest and warmest seasons compared toS.delavayi.This phenomenon further confirms that differences in sensitivity to climate may lead to differences in the distribution and traits of species.
Sources of variation in Sapindus leaf morphological diversity
Leaf morphology is influenced by both environment and genetics.In this study,all the samples grew in the same area and were equally affected by environmental variables,eliminating individual and population differences caused by environmental differences.However,even under these circumstances,leaf morphology of the 80 germplasm samples still exhibited high diversity and large interspecific differences.Hence,we hypothesized that the observed morphological variations were genetic and mainly caused by the long-term historical environment.Using ISSR markers,many researchers have also demonstrated that the genusSapindushas high genetic diversity (Mahar et al.2011,2013;Sun et al.2018).In this study,leaf morphological variations occurred primarily within rather than between species,similar to the findings of Sun et al.(2019) and Mahar et al.(2011).These findings may be related to the fact that most of the sources of the germplasm were scattered trees in discontinuous habitats and thus a low opportunity for gene exchange,leading to intraspecific differentiation.Moreover,intraspecific variability can serve as a critical driver of shortterm functional responses of plant morphology (Jung et al.2014),demonstrating that leaf morphology in the two species was very likely affected by short-term climate variations.
Conclusions
Our results demonstrate that there is considerable intraspecific and interspecific variation in leaf morphology inS.mukorossiandS.delavayi.This variation may be primarily due to genetics rather than to environmental variables.In addition,this variation arose primarily from intraspecific variability.Intraspecific collections should be prioritized in future collections ofSapindusgermplasm to obtain complete morphological diversity data.Further analysis indicated that interspecific differences in leaf traits of the two species were significant;lower trichome density,leaf let thickness,upper trichome density,leaf let length to width ratio,leaf let perimeter,leaf let length,and petiolule color exhibited the most variance.Mean temperatures in the warmest and coldest seasons played key roles causing these differences.Moreover,S.mukorossileaf morphology was more sensitive to climate variation and can adapt to larger temperature differences between the coldest and warmest seasons.This feature should be the basis for the introduction and cultivation of this species and can help to address climate change.
AcknowledgementsWe are grateful to the team of Yuanhua Forestry Biotechnology Co.,Ltd.,for providing the forestry materials and for assistance,and textcheck (http://www.textc heck.com/text/page/index)for polishing the English text of a draft of this manuscript.
杂志排行
Journal of Forestry Research的其它文章
- Flexible transparent wood enabled by epoxy resin and ethylene glycol diglycidyl ether
- Diversity and surge in abundance of native parasitoid communities prior to the onset of Torymus sinensis on the Asian chestnut gall wasp (Dryocosmus kuriphilus) in Slovenia,Croatia and Hungary
- Ozone disrupts the communication between plants and insects in urban and suburban areas:an updated insight on plant volatiles
- Testing visible ozone injury within aLight Exposed Sampling Site as aproxy for ozone risk assessment for European forests
- Logging and topographic effects on tree community structure and habitat associations in a tropical upland evergreen forest,Ghana
- Spatial pattern dynamics among co-dominant populations in early secondary forests in Southwest China
