Foliar C/N stoichiometry in urban forest trees on a global scale
2021-07-15HongxuWeiXingyuanHe
Hongxu Wei·Xingyuan He,2
Abstract Foliar C/N stoichiometry is an indicator of geochemical cycling in forest ecosystems,but the driving changes for its response to urbanization at the wide scale is not clear.In this study,data on tree-leaf C and N stoichiometry were collected in papers from across 105 tree species from 82 genera and 46 families.The foliar C/N of urban forest trees varied among different climate zones and tree taxonomic variation and tended to be higher in trees of urban forests near the equator and in eastern regions,mainly driven by lowered foliar N concentration.Neither the foliar C concentration nor foliar C/N for trees of urban forests was statistically higher than those of rural forests.For variation by taxonomic classification,C4 species Amaranthus retroflexus and Chenopodium ambrosoides (Amaranthaceae) had lower foliar C/N than did other species and families.Myrsine guianensis (Primulaceae) and Myconia fallax (Asteraceae) had the highest foliar C/N.Therefore,urbanization has not caused a significant response in forest trees for foliar C/N.The change in foliar N concentration was globally the main force driving of the differences in foliar C/N for most tree species in urban forests.More work is needed on foliar C/N in trees at cities in polar regions and the Southern Hemisphere.
Keywords Ecosystem cycling·City habitat·Isometric scaling·Suburb·Remote town·N deposition
Introduction
In 2018,an estimated 55.3% of the world’s population lived in urban settlements (United Nation 2018).By 2030,urban areas are projected to house 60% of the global people,and one in every three people will live in cities with at least half a million inhabitants.Urban areas are the source of greenhouse gases (CO2,CH4,and N2O),the precursor of tropospheric O3,particulates (Wang et al.2020),and temperature elevation (Shen et al.2008;Li et al.2014),which can drive regional and global changes in the environment.Urban forests are thus ahead of the global-change“response curve”among forests in their region (Carreiro and Tripler 2005).Multiple urban environmental changes contribute to this response of local forest ecosystems;hence,urban forests are usually considered a natural laboratory to study the effects of comprehensive environmental changes on urban forest ecosystems (Carreiro and Tripler 2005;Chen et al.2010;Nikula et al.2010;Kahan et al.2014).However,knowledge of the biogeochemical response of urban forests to urban environments is still limited at the global scale.
Urbanization contributes to changes in per capita carbon (C) emissions over the long term (Sheng and Guo 2016;Wang et al.2016),urban land cover and use (Liu et al.2019;Li et al.2020),and urban afforestation efforts(Imhoffet al.2004;Oldfield et al.2014;Zhang et al.2015).N concentrations in forest systems are also modified by the urban environment (Chen et al.2010;Searle et al.2012;Rao et al.2013).Synergistic changes in C and N in urban forest systems during urbanization lead to an indeterminable change in the C/N over time.Ecological C/N is a critical indicator of biogeochemical cycling in terrestrial ecosystems (Yang and Luo 2011;Rong et al.2015),but the C/N stoichiometric response of urban forest ecosystems remains unknown.
Foliage C/N is of special concern in a changing world because the foliar N concentration can reflect both tree growth and soil fertility in response to modified C cycling(McGroddy et al.2004;Rong et al.2015).The foliar C/N ratio was found to be higher in a coniferous forest biome than in broadleaf and tropical forests and tended to increase with stand age (McGroddy et al.2004;Yang and Luo 2011).However,the current understanding of foliar C/N stoichiometry in trees is limited for urban forests.Knowledge of foliar C/N stoichiometry in natural forest trees may be insufficient for speculating about urban forest trees because the environment of urban systems is quite different from the natural ambient environment affecting geochemical cycling in nonurban forest systems.The accumulation of evidence from field studies and manipulation experiments in urban forest remnants is still accumulating (Chen et al.2010;Searle et al.2012;Rao et al.2013) provides an opportunity to analyze the foliar C/N ratio in urban forest trees through a literature synthesis.
Increases in atmospheric carbon dioxide concentration,hereafter [CO2],and temperature,typical of urban environments,have been found to increase the foliar C/N of C3grasses,forbs and woody plants (Sardans et al.2011).However,the effect of warming on foliar C/N ratios varies from positive to negative or neutral on plants of different types (Sardans et al.2011).In regional studies,foliar C/N tended to be lower in trees located in urban forests than in rural forests (van Rensburg et al.1997;Alfani et al.2000;Knepp et al.2005;Chen et al.2010;Nikula et al.2010;Rao et al.2013).The tree species examined were mainlyQuercusspecies (van Rensburg et al.1997;Alfani et al.2000) andPinusspecies (Chen et al.2010;Sardans et al.2011).Other tree species,such asAesculus hippocastanum(Oleksyn et al.2007),Liriodendron tulipifera(McGroddy et al.2004) andZelkova serrata(Kiyosu and Kidoguchi 2000) have been evaluated for their foliar C/N ratio only at urban sites.The foliar C/N stoichiometry for species ofPopulusandSalixhas rarely been evaluated in urban forest trees (Kagata and Ohgushi 2007;Sardans et al.2011;Pacaldo et al.2013).Therefore,current studies have been biased for site location and tree species,and a literature synthesis may reveal some general responses of foliar C/N stoichiometry in forest trees in urban environments.
The present analysis included records from the Web of Science database on foliar C and N stoichiometry in trees from urban and rural forests up to 1 February 2019 to compare the foliar C/N ratio in trees between urban and rural forests at a global scale and to study the influences of species variation and climate zones on the foliar C/N results.We hypothesized that (1) climate and geography had a combined effect on foliar C/N in trees from urban forests and (2) foliar C/N can vary among species and other taxon rankings.
Materials and methods
Literature synthesis
To collect data from studies with experiment and experimental investigations on foliar C and N concentrations in trees of forests along urban–rural gradients.Data were mainly collected using the search engines of Web of Science and Google Scholar using keywords“foliar/leaf C and/or N concentrations”,“ecological stoichiometry”,and“forest tree”combined with“urban”,“city”,“rural”,“remote”,“metropolitan”,and“town”.To maintain a high distinction between urban and rural sites,we used only data from forests in urbanized and non-urban regions.Data from forests in suburban and surrounding towns were excluded from our synthesis.We defined forests in rural regions as those at least 20 km away from a city (Yarie and Van Cleve 1996;Craven et al.2007;Chen et al.2010;Nikula et al.2010;Fang et al.2011;Maisto et al.2013).All chosen studies had to present clear and specific information that the forests were located in regions around or within a city.Any studies that lacked information on forest distance to adjacent cities were not included in the synthesis.In addition,papers were collected from a range of literature sources according to the following detailed criteria:
Study sitechosen studies had to clearly specify the regional urbanization levels (from urban to rural) of the sites where leaf samples were collected from the forest trees.Any reports without specific location descriptions or the introduction of urbanization levels were excluded.
Data traitdata had to be analyzed as the total concentration of C and N in tree leaves.Data considering the C and N stoichiometry in litter,soils,or understory plant leaves were not included in our synthesis,e.g.,parts of Fan et al.(2015).Data on the leaf C/N ratio without raw data on C and N concentrations in the leaves were also excluded from our study.
Research materialonly natural forests,forest remnants,and plantations over 10 years old were chosen for collection of foliar data.Juvenile tree materials (seedlings,samplings,and cuttings) planted in a simulated study with controlled environment were excluded from the collection,but those planted in urban and rural sites were included (Kim et al.2015).
In total,foliar C and N stoichiometry data were collected from 105 tree species in 82 genera and 46 families from 31 published papers (Table 1).Graphical information for most data was given by the original study,and some others were obtained on Google map according to the place and location.The raw data therein were extracted from published tables or estimated from published graphs.Graphical information was extracted using the Engauge Digitizer software (GitHub,San Francisco,CA,USA).Our database recorded C and N in forest trees along a regional urbanization gradient in cities across climate zones,geographic gradients (longitude and latitude),tree families,genera,and species.Climate zones for the locations of the collected records were classified into continental temperate,Mediterranean,tropical,subtropical,and polar regions by the rank of latitudes (Zhang et al.2017).
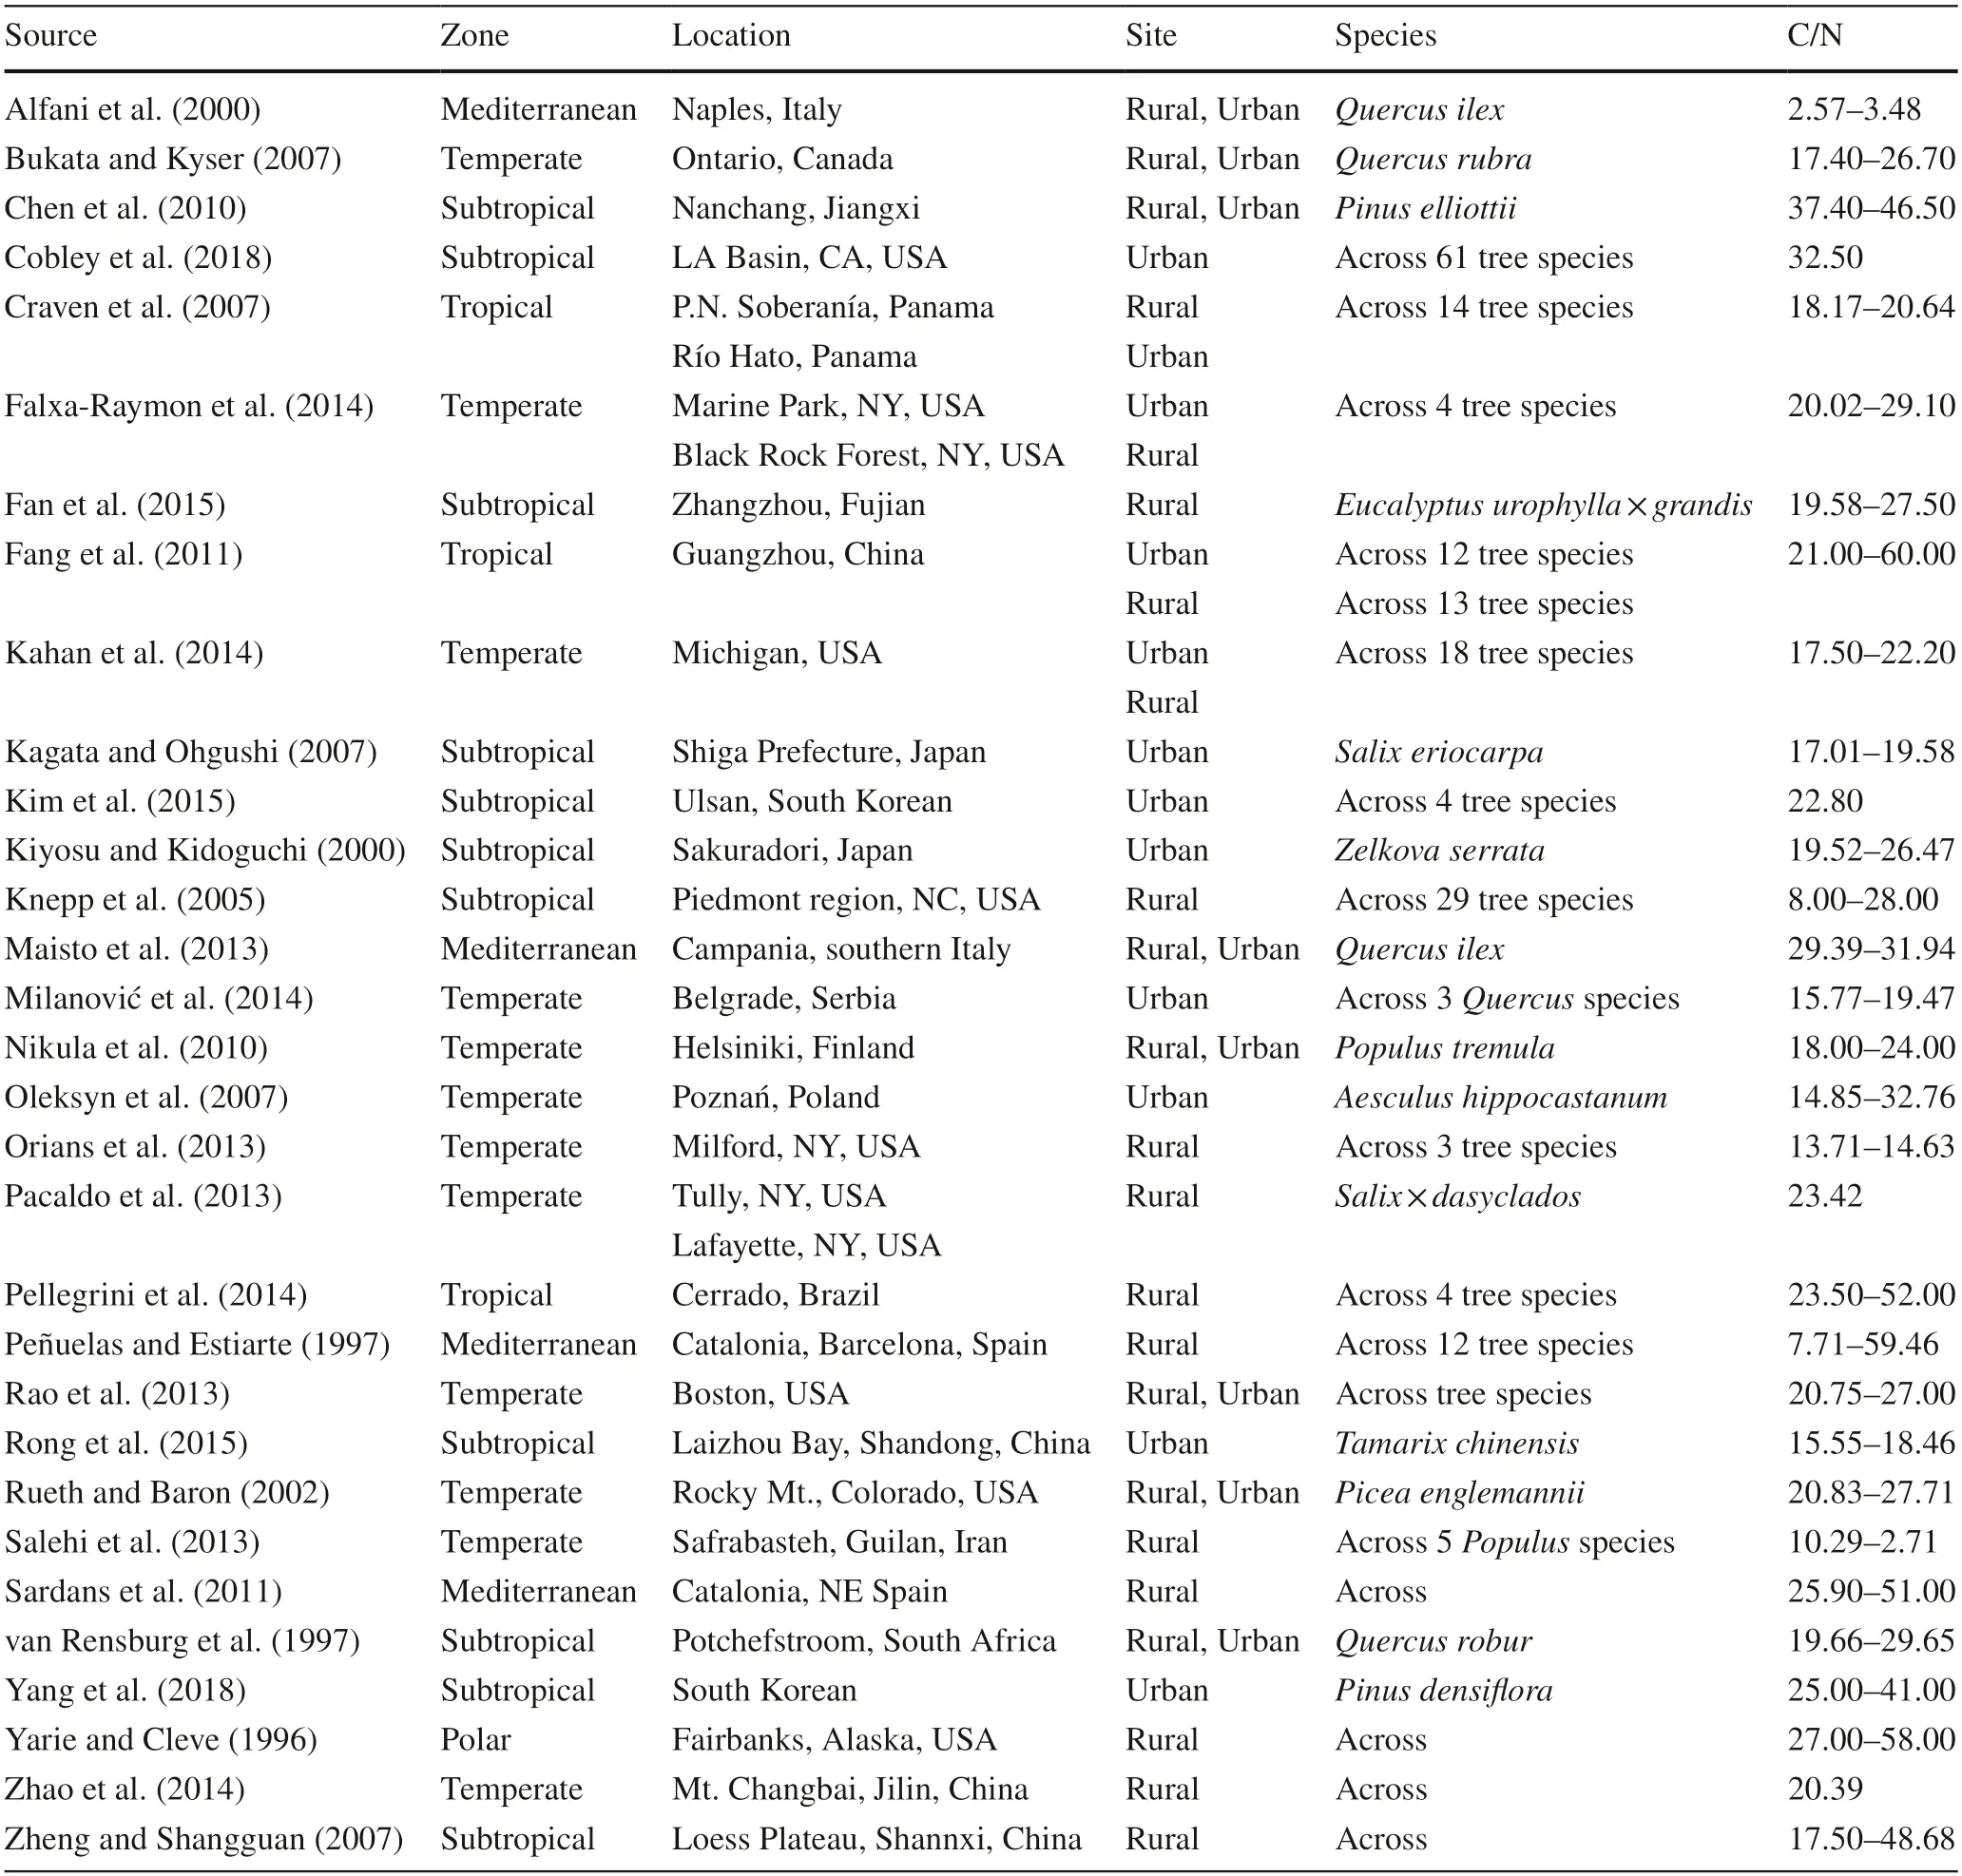
Table 1 Summary of information from studies on foliar C/N in forest tree species from rural and urban sites in different climatic zones worldwide
Analysis of differences in foliar C/N ratio
A nomographic method was devised to interpret the factors driving foliar C and N concentrations responsible for differences in the foliar C/N in trees between urban and rural forests.Data for foliar C concentration,N concentration,and C/N in rural forest trees were set as a reference to 100;thereafter,values for urban forest trees were standardized to values from 0 to 100.Standardized C and N values together resulted in a nomograph withx-andy-coordinates,respectively.Since the foliar C/N ratio during urbanization was positively driven by C concentration but negatively driven by N concentration,the difference in foliar C/N ratio of urban forest trees compared to rural forest trees can be described as 8 vector shifts of C-N relations (letters A to H,Fig.1).These C-N relation shifts and the involvement of foliar C/N values between the reference (rural) and vector-line end (urban) can together indicate the driving factor,either C or N,in leaves to determine the change in the foliar C/N ratio (Table 2).
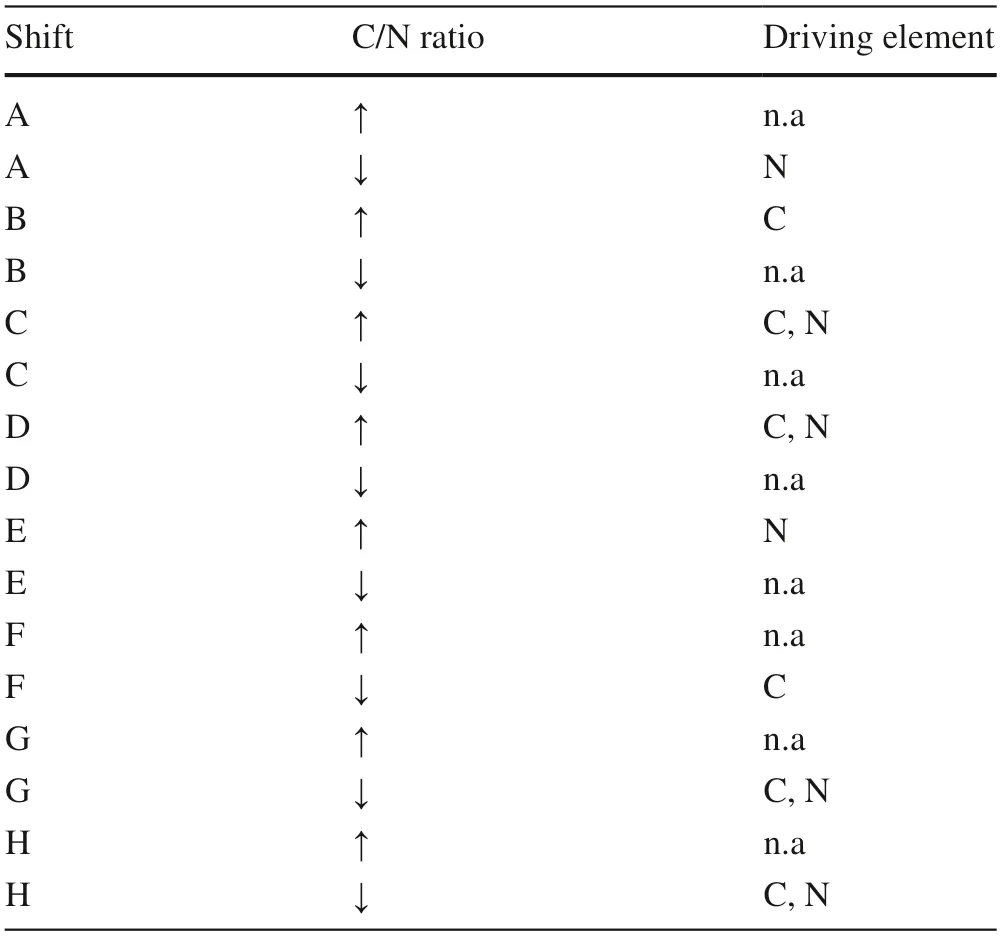
Table 2 Analysis of driving elements of carbon (C) or nitrogen (N)accounting for the relative changes (increase:↑,decrease:↓) of foliar C/N ratio in trees in urban forests relative to those in rural forests with reference to a theoretical balance ratio of 100:100

Fig.1 Theoretical vector shifts of foliar C/N changes from trees in rural forests (center of the graph,coordinate of 100,100) to those in urban forests under the co-modification between log-transformed foliar C (x-axis) and N (y-axis) concentrations.No unit are labeled for either X-or Y-axes because data have been standardized.The coordinate of foliar C/N in urban forest trees can fall in eight orientations(A–H),which can help to predict whether C or N is the driving element under contrasting conditions of increased and decreased foliar C/N
Statistical analyses
All data were analyzed by SAS software (SAS Institute,Cary,NC,USA).In the test for normality using the Shapiro–Wilk test,none of the C/N data were normally distributed.However,data for foliar C and N concentrations and foliar C/N showed near-Gaussian distributions (Fig.2).Therefore,we employed the near-normal maximum-likelihood model to analyze the effects of climate zones (temperate,mediterranean,tropical,or subtropical,and polar),urbanizing location (urban and rural),family,genera,and species on least-square (LS) means.Urbanizing location is the core factor that revealed the difference between urban and rural sites.The scaled deviance for goodness of fit was detected to be 1.04 for foliar C and N concentrations and foliar C/N ratio,which all fell in the acceptable range.Because the factors tree species,genera,and family had a high number of varieties but very uneven number of objectives within each variety,they failed to generate a combination with urbanizing location.Therefore,these three factors were analyzed as three independent main effects.The multiple comparison was achieved by conservative Bonferroni grouping for specific LS means (α=0.05).Spearman rank correlation was employed to detect the relationship between geographical gradient and foliar C/N stoichiometry for data collected from both urban and rural sites.

Fig.2 Data distribution for foliar C (a),foliar N (b),and foliar C/N ratio (c)
Results
Foliar C/N ratio in urban forest trees at the global scale
The global synthesis of the literature encompassed 31 studies on foliar C/N ratios in trees of urban forests (Table 1).These studies were conducted across 105 species from 46 families and 82 genera at 34 locations (Table 1).Among these studies,one was done at a rural site in Fairbanks,Alaska,USA in the polar zone,and another one at a rural site in Cerrado,Brazil in the Southern Atmosphere (Fig.3).Two groups of studies were concentrated in eastern parts of North America and eastern Asia (Fig.3).

Fig.3 Global distribution of foliar C/N ratio in urban forest trees in cities at different climate zones (temperate,Mediterranean,tropical,subtropical,and polar)
Relationship between foliar C and N concentrations
For urban forest sites,a negative relationship was found between longitude and latitude,suggesting that more data were collected from eastern regions around the equator(Table 3).Along the latitude gradient,foliar N concentration tended to increase;hence,foliar C/N ratio declined.In contrast,along the longitude gradient,foliar N concentration declined;thus,foliar C/N ratio increased.The relationship between foliar C and foliar N concentrations was negative.
In rural sites,along the latitude gradient,foliar C/N ratio decreased with a decline in foliar C concentration and increase in foliar N (Table 3).Along the longitude gradient,both foliar C and N concentrations declined,and foliar C/N ratio did not change.Foliar C/N ratio had a positive relationship with foliar C concentration and a negative relationship with foliar N.
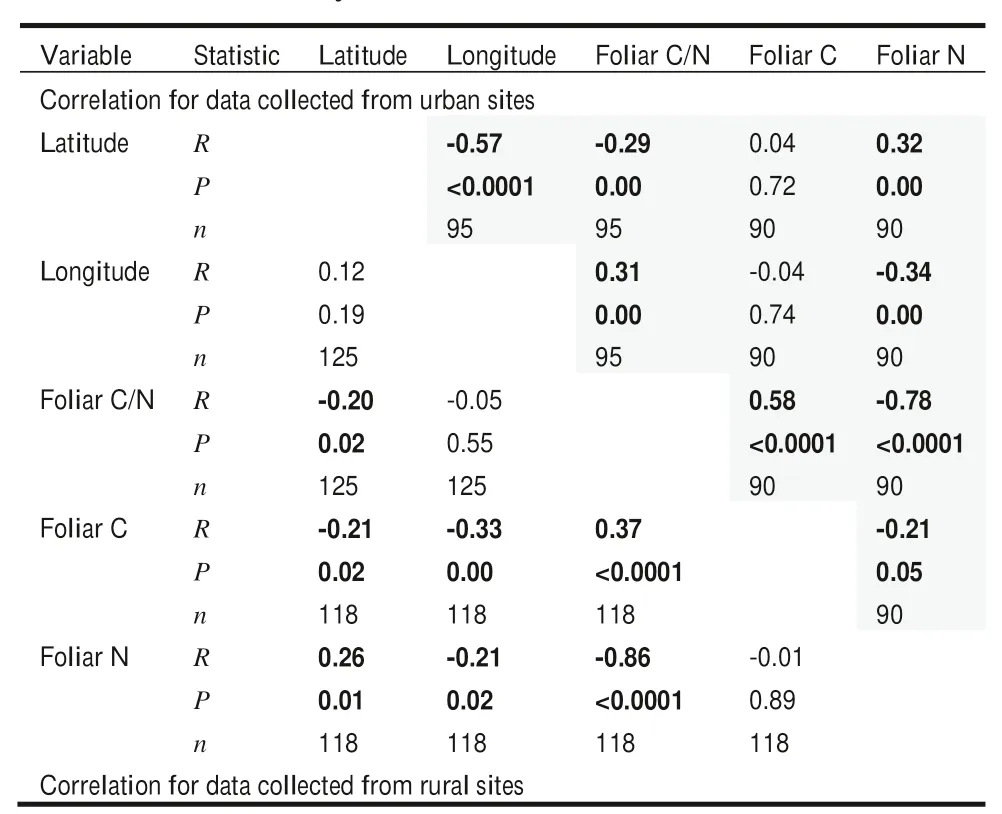
Table 3 Spearman correlation between geographical gradient and foliar C/N stoichiometry for data collected from urban and rural sites
Effects of climate and urbanization on foliar C/N ratio
Geographical variation in climate zones had a significant effect on foliar C concentration (Table 4).Forest trees in subtropical regions had the highest foliar C concentration (LS mean:47.95% ± 0.64%),7.74% higher than in temperate sites (LS mean:44.51% ± 0.18%) (Fig.4 a).However,foliar C concentration in mediterranean (LS mean:47.10% ± 1.80%) and tropical regions (LS mean:46.30% ± 1.58%) did not differ significantly from those in the other climate zones.
Factors of climate zones and urbanization had an interactive effect on foliar N concentration and foliar C/N ratio(Table 4).Foliar N concentration was highest in forest trees at rural sites in Mediterranean and subtropical zones,which were higher than that in forest trees at subtropical cities by 32.70% and 29.09%,respectively (Fig.4).Foliar N concentrations in rural forest trees at mediterranean and subtropical zones were also higher than that in rural forest trees at tropical regions by 72.52% and 67.83%,respectively (Fig.4).
Foliar C/N ratio was highest in rural forest trees at the Polar zone which was followed by that in rural forest trees in tropical zones (Fig.4 c).Foliar C/N ratio was lowest in urban and rural forest trees in temperate regions and rural forests in mediterranean regions (Fig.4 c).
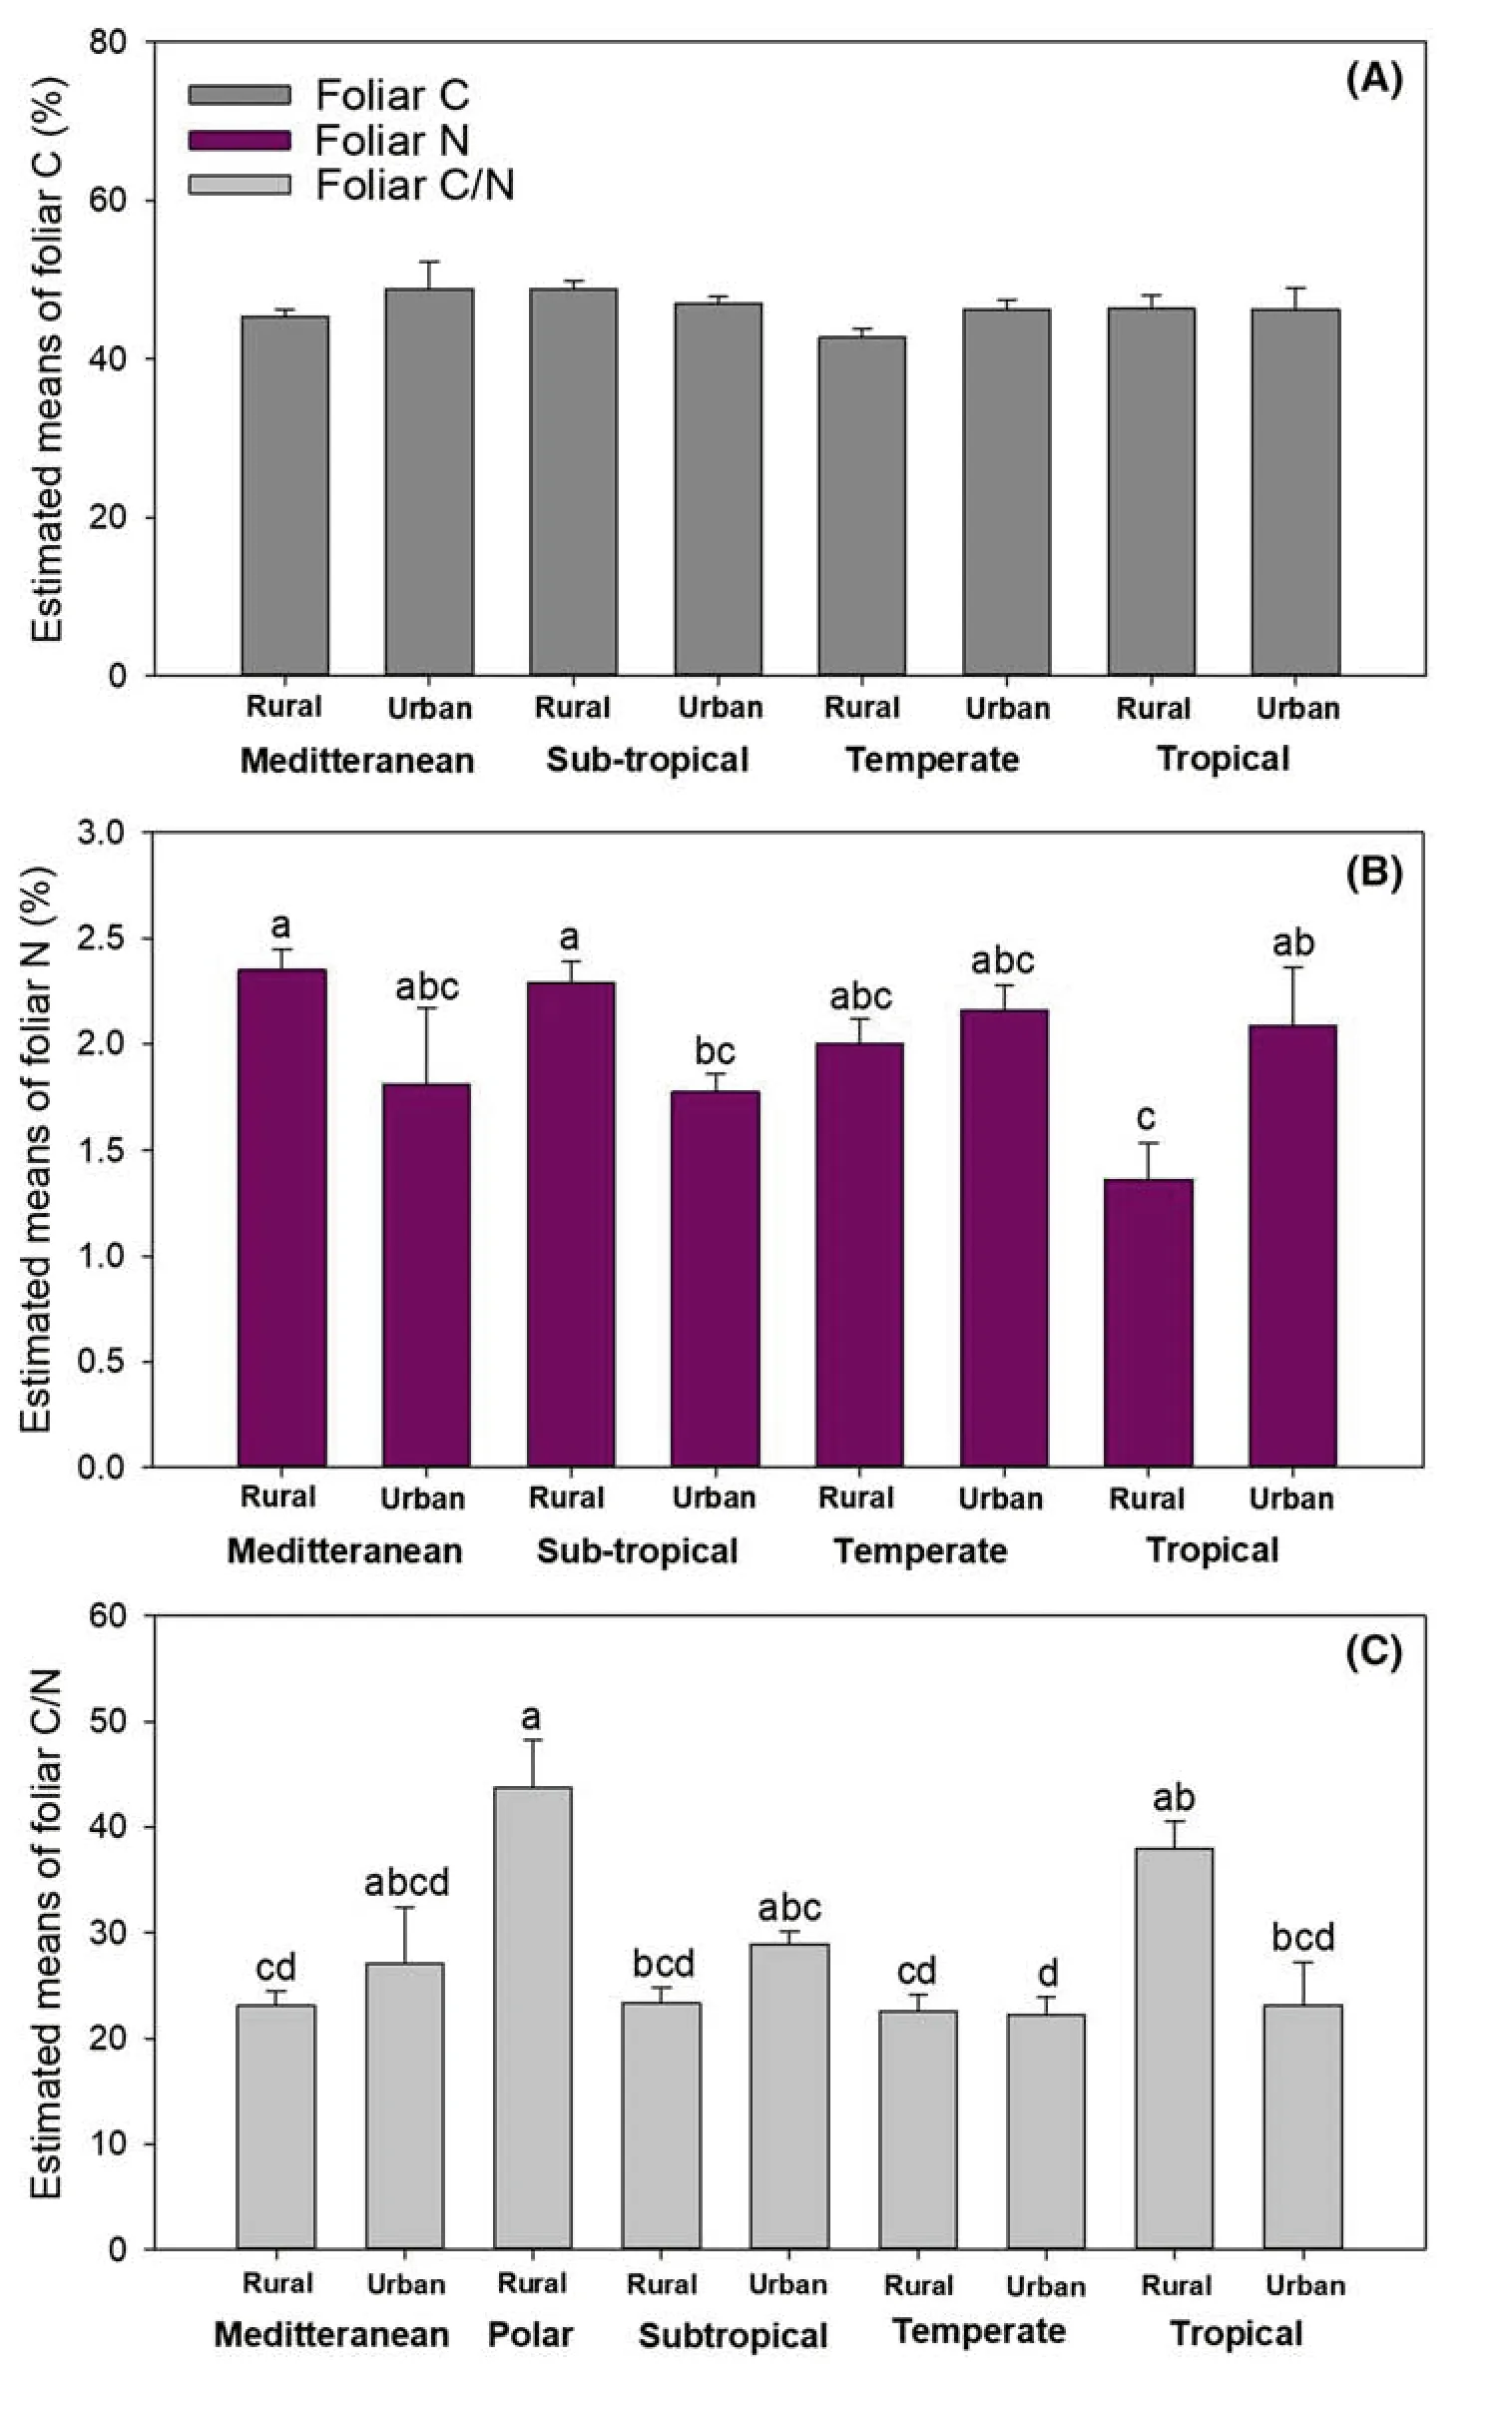
Fig.4 Estimates of least square(LS) means (+SE) of foliar C(a),foliar N (b),and foliar C/N(c) in trees between urban and rural forests in cities in different climate zones.Different letters above bars indicate significant difference among conservative Bonferroni grouping for species LS means (α =0.05)
Foliar C/N ratio in forest trees among taxonomic variations
Foliar C and N concentrations and foliar C/N ratio all varied among forest tree families (Table 5).Foliar C was highest in Altingiaceae (n=2) and lowest in Amaranthaceae (n=6)and Boraginaceae (n=3) families (Fig.5 a).Foliar N was highest in Amaranthaceae (n=6),followed by Oleaceae(n=3),and lowest in Asparagaceae (n=3) and Primulaceae (n=2) families (Fig.5 b).Foliar C/N ratio was highest in Primulaceae (n=2),followed by Asteraceae (n=2),and lowest in Amaranthaceae (n=6) families (Fig.5 c).

Fig.5 Estimates of least square (LS) means (+SE) of foliar C (a),foliar N(b),and foliar C/N (c) in trees from different families.Different letters above bars indicate significant difference among conservative Bonferroni grouping for species LS means (α =0.05)
The foliar C concentration was highest in maple and spruce genera (Fig.6 a).Genera ofAmaranthus(n=3),Borago(n=3),Chenopodium(n=3),andRuscus(n=3)had the lowest foliar C concentration (Fig.6 a).Foliar N concentration was highest in theRobinia(n=2),followed byAmaranthus(n=3),and lowest inMyconia(n=2) (Fig.6 b).Foliar C/N ratio was highest in spruce (n=3),followed byMyconia(n=2) andMyrsine(n=2),and lowest inAmaranthus(n=3),ash (n=3),Borago(n=3),Chenopodium(n=3),andRobinia(n=2) genera (Fig.6 c).
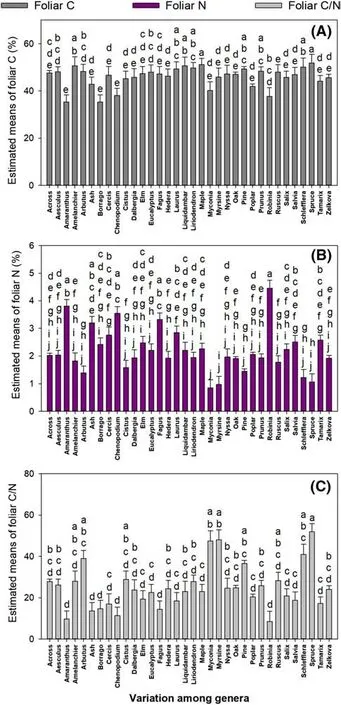
Fig.6 Estimates of least square (LS) means (+SE) of foliar C (a),foliar N (b),and foliar C/N (c) in trees from different genera.Different letters above bars indicate significant difference among conservative Bonferroni grouping for species LS means (α =0.05)
Foliar C concentration was highest inQuercus alba(n=3) and lowest inPopulus×canadensis(n=2) (Fig.7 a).Foliar N concentration was highest inRobinia pseudoacacia(n=2),followed by C4Amaranthus retrofl exus(n=3)andChenopodium ambrosoides(n=3),and lowest inPinus thunbergii(n=3) (Fig.7 b).Foliar C/N ratio was highest inPopulus×canadensis(n=2) and lowest in C4Amaranthus retroflexus(n=3) andRuscus aculeatus(n=3) (Fig.7 c).
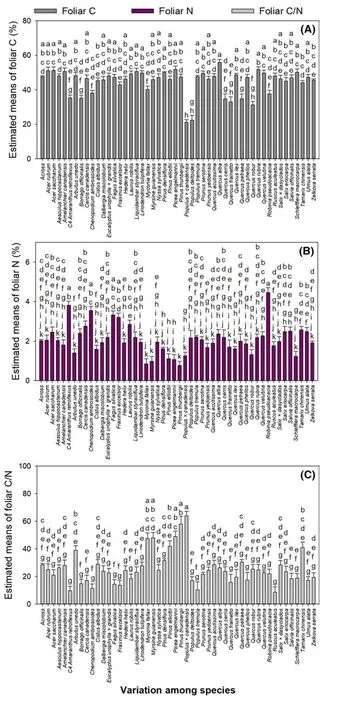
Fig.7 Estimates of least square(LS) means (+SE) of foliar C(a),foliar N (b),and foliar C/N(c) in trees from different genera.Different letters above bars indicate significant difference among conservative Bonferroni grouping for species LS means(α =0.05)
The analysis on the change of C/N ratio in urban forest trees
Compared to rural forest trees,urban forest trees had lower foliar C/N ratio in temperate regions,which was caused by the higher foliar N concentration than foliar C concentration (Fig.8 a;Table 2).The higher foliar C/N ratios in urban forests at Mediterranean regions was caused by higher foliar C concentration but lower foliar N concentration.Foliar C/N ratio in subtropical urban forest trees was also higher due to much lower foliar N concentration than foliar Cconcentration.The lower foliar C/N ratio in urban trees of tropical forests was caused by lower foliar C concentration in spite of higher foliar N concentration.

Table 4 Likelihood ratio statistics for type I analysis of climatic zones (Z),site location (L),and their interaction (CZ × L) on foliar carbon (C)and nitrogen (N) percent and foliar C/N ratio in trees of urban forests at the global scale
Compared to rural forest trees,those in urban forests from Nyssaceae and Salicaceae families had lower foliar C/N,which was caused by higher increase in foliar N concentration than the increase in foliar C concentration(Fig.8 b;Table 2).The increase in foliar C/N ratio in urban trees from Ulmaceae,Magnoliaceae,Sapindaceae,and Rosaceae families was caused by larger decline in foliar N concentration compared with foliar C concentration.However,foliar C/N in urban trees from Fagaceae familydecreased because of greater decline in foliar C concentration than that in foliar N concentration.Foliar C/N ratio in urban trees showed a decline across families due to higher foliar C concentration and lower foliar N concentration.Similarly,lower foliar C concentration paired with higher foliar N concentration resulted in a decline foliar C/N in urban forest trees from the Pinaceae family.

Table 5 Likelihood ratio statistics for type I analysis of variation among family,genus,and species on foliar carbon (C)and nitrogen (N) percent and foliar C/N ratio in trees of urban forests at the global scale
Compared to rural forest trees,those in urban forest trees fromPinusandNyssahad a negative foliar C/N ratio(Fig.8 c) because an increase in foliar N concentration was greater than the increase in foliar C concentration (Table 2).The increase in foliar C/N ratio in urbanPopulustrees resulted from a higher increase in foliar C concentration than in foliar N concentration.Foliar C/N ratio increased in urban trees fromPrunusandLiriodendrongenera as a result of greater decreases in foliar N concentration than in foliar C concentration.The decrease in foliar C/N in urbanQuercustrees resulted from a decline in foliar C concentration.However,the decrease in foliar C/N ratio in urban trees fromAmelanchier,Salix,andPiceagenera and those across genera all resulted from a decrease in foliar C concentration and increase in foliar N concentration.
Quercus roburandQuercus ilexin urban forests had lower foliar C/N ratio than in these trees in rural forests,mainly caused by higher foliar N concentration (Fig.8 d;Table 2).The decrease in foliar C/N ratio in urban trees ofNyssa sylvatica,Prunus serotina,andPopulus tremulawas caused by higher increase of foliar N concentration than foliar C concentration.Foliar C/N ratio inLiriodendron tulipiferatrees in urban forests was higher than in rural forests,because foliar N concentration was greater and foliar C concentration lower.Foliar C/N ratio inQuercus rubraandPinus elliottiitrees and in trees across species in urban regions was lower in all cases than in rural regions due lower foliar C concentration and higher foliar N concentration.

Fig.8 Vector shifts of foliar C:N ratio changes from rural forest trees(coordinate of 100,100) to those in urban forest under the co-modification between standardized foliar C (x-axis) and N (y-axis) concentrations among climate zones (a),tree families (b),tree genera (c),and tree species (d).Interpretation for vector shift is given in Table 2.Bracketed numbers are standardized foliar C:N ratio in trees of urban forest
Discussion
Geographical distribution of foliar C/N ratio in urban forest trees
We found that foliar C/N ratio decreased along the latitude both in urban and rural forest trees.This was generated because foliar N concentration was higher in high-latitude trees in both urban and rural forests.In rural sites,foliar N concentration was lower in tropical forests than that in Mediterranean and subtropical forests.In urban sites,temperate forest trees tended to have higher foliar N concentration than southern ones although the difference was not statistically significant.Our results concur with those of Reich and Oleksyn (2004) where foliar N concentration decreased with increasing environmental temperature.Jiang et al.(2019)demonstrated that the increase in foliar N concentration with latitude resulted from enhanced N resorption efficiency in northern forests.In addition,lower foliar C concentration in trees of northern forests at rural sites at least partly contributed to the latitudinal decline in foliar C/N ratio.Short growing season and low temperature limit C assimilation by trees in northern forests (Caldararu et al.2014;Slot et al.2014).In urban sites,foliar C/N ratio increased with the decline of foliar N concentration with longitude.With regard to the negative relationship between longitude and latitude,the increasing foliar C/N can also be explained by those along latitude.These results also suggested that more N was reserved in cycling in western sites (eastern America) than in eastern sites (eastern Asia).Our results did not match the records of regional N deposition.Total N deposition (TND) to eastern United States was estimated to range 8–20 kg N ha−1a−1during 2006 and 2008 (Zhang et al.2012).TND was estimated to be 15–50 kg N ha−1a−1in eastern China during 2008–2012 (Zhao et al.2017).Therefore,it is unlikely the N deposition that drove the higher foliar N in western regions than in eastern ones.
Change of foliar C/N in urban forest trees among climate zones
The difference in foliar N concentration drove the difference in foliar C/N between urban forest trees and rural forest trees in temperate and subtropical regions.Foliar N in higher and lower concentrations than foliar C in urban forest trees that drove the difference in foliar C/N in temperate and subtropical regions,respectively.The difference in foliar C/N in trees between rural and urban forest sites in temperate regions did not differ significantly,neither did foliar C and N concentrations in temperate regions.However,foliar N concentration was significantly lower in trees of urban forests than that of urban forests at subtropical regions.Enloe et al.(2015)demonstrated that higher N concentration was found in litter and soils at the depth of 0 −90 cm in urban forests than in rural forests at subtropical regions.This suggests that a great proportion of N was returned to soils through litter decomposition in subtropical regions.
In tropical regions,a significant increase in foliar N in urban forest tress was responsible for the lower foliar C/Nratio.Primary production in tropical rural forests may be limited by the negligible N availability in these areas (Fang et al.2011).Higher foliar N concentration in tropical urban forests can be a reflection of a greater retention of nutrients needed for photosynthesis (Craven et al.2007).
None of the foliar variables differed significantly between trees in urban and rural forests in Mediterranean regions when data for rural forests in Mediterranean regions were pooled.Some regional Mediterranean results showed significant results about foliar N concentration between urban and rural forests (Alfani et al.2000).However,in other Mediterranean regions,the urban–rural difference in N concentration was significant for soils instead of leaves (Maisto et al.2013).Therefore,for urban forests in different climate zones,the significant distinction in foliar N concentration between urban and rural forests was the main force shaping the foliar C/N ratio.Thus,we accept our first hypothesis that climate zones and geography had an interactive effect on foliar C/N ratio.
Foliar C/N in urban forest trees among families
Among all families in the studies,Amaranthaceae had extremely low foliar C/N ratio due to lower foliar C concentration and higher N concentration,suggesting that the trees assimilated less C because of the higher cost of N uptake compared with other families.According to Sardans et al.(2012),foliar C:N in C4plants did not change in response to elevated [CO2] compared with C3plants.
Among the families,the highest foliar C/N ratio was found in the Primulaceae,which also had the lowest foliar N concentration.In our study,the only Primulaceae species was the evergreen shrubMyrsine guianensis,and its low foliar N is positively correlated to its small amount of woody biomass (Pellegrini et al.2014).The foliar N concentration in the Asteraceae family was also the lowest among all families.Ruscus aculeatusis the only species from the Asteraceae family,which required deep shade and does not have high leaf N concentrations unless exposed to sunlight(Sack et al.2003).Records about trees in the aforementioned families in our study all came from rural forests.Hence,the data are not appropriate for inclusion in an analysis of the driving force of foliar C/N ratio in urban forest trees from these families.Furthermore,we can accept our second hypothesis that the taxon can contribute to variation in foliar C/N.
Change in foliar C/N in urban forest trees among taxa
In our study,a higher concentration of foliar N was the main contributor to lower foliar C/N ratio in trees of urban forests than in rural forests for the Nyssaceae and Salicaceae families.Nyssa sylvaticais the only species from the Nyssaceae family that had a higher foliar N concentration due to its association with arbuscular mycorrhizal fungal to break down soil organic N (Falxa-Raymond et al.2014).Species ofSalixandPopulus(Salicaceae) are known hyperaccumulators for phytoremediation of N from urban soils (Shi et al.2016;Radwanski et al.2017).In our study,Salix eriocarpa(Kagata and Ohgushi 2007) andPopulus tremula(Nikula et al.2010) both had higher foliar N concentration in urban forests than in rural forests.
Decreased foliar N concentration was the driving force for the lower foliar C/N in Ulmaceae,Magnoliaceae,and Sapindaceae.In Ulmaceae,the difference between urban and rural actually came from lower foliar N concentration inZelkova serrata(Kiyosu and Kidoguchi 2000),an indicator of air pollution in cities of Japan (Kiyosu and Kidoguchi 2000),compared withUlmus alata(Knepp et al.2005).Its leaf N concentration is highest when leaves begin to expand,then decreases until it becomes steady atfull expansion (Koyama et al.2008).Foliar N concentration inUlmus alatais not affected by the elevated [CO2] (Knepp et al.2005).Liriodendron tulipiferais the only species in the Magnoliaceae family in our study that was distributed in urban and rural forests (Knepp et al.2005;Kim et al.2015).Elevated [CO2]in the urban atmosphere can reduce foliar N concentration inL.tulipifera(Drake et al.1997).Improved soil–water balance can increase foliar C/N ratio by increasing C uptake in the shade (Drake et al.1997).Either an environmental change in [CO2] or soil water availability may contribute to an increase in foliar C/N ratio,but no specific environmental characteristics that would lead to such changes have been reported (Knepp et al.2005;Kim et al.2015).A decrease in foliar N concentration reported forAesculus hippocastanum(Sapindaceae),commonly planted in urban sites,may have been caused by reduced uptake of NO3−after a deicing treatment with NaCl (Oleksyn et al.2007).
The decrease in foliar C concentration in urban forest sites drove the decline in foliar C/N ratio in Fagaceae family.Foliar C concentration inQuercus ilex,a typical Fagaceae species (Alfani et al.2000;Maisto et al.2013) was lower in urban sites than in rural sites.When data were pooled across rural sites,the foliar C concentration in urban forests was even lower.The higher temperature in cities can promote foliar growth as photosynthates are used.In contrast,foliar C/N ratio increased only a little in urban Rosaceae trees as a result of a decrease in foliar N concentration.Rosaceae plants are mostly fast-growing pioneers that use N at a high rate and are desired near city centers for their flowers,but anthropogenic activities likely contribute to the low N content in urban soils (Falxa-Raymond et al.2014).Foliar C/N in trees across a range of families was slightly lower in urban forests than in rural ones,co-driven by a decrease in foliar C concentration and increase in foliar N concentration.These results suggest that the general response of foliar C and N stoichiometry in urban forest trees across families is the result of fast use of C and high consumption of N in leaves.
Limits of this study
Although we summarized studies about 105 tree species from 82 genera and 46 families in 31 studies.This number of studies is comparable with the number of studies used in a synthesis of C/N in natural forests at a global scale(n=39) Yang and Luo (2011).Thus,the total number of relevant studies may not be sufficient to provide more robust results regarding foliar C/N stoichiometry in urban forest trees.Therefore,the results of our study were restricted to scattered regions with a small number of data sets at the global scale.Substantial aspects of our results can be taken at least as summaries of certain regional studies for a given tree species,but more powerful results can only be obtained at much larger scales with summaries that include more regional studies in future work.Our data were mainly collected from the Northern Hemisphere,and only one record was from the Southern Hemisphere.The results of an additional research in the Web of Science using the keywords“foliar C and N stoichiometry”and“New Zealand/Australia”indicated that researchers from the Southern Hemisphere paid more attention to soil stoichiometry (Bui and Henderson 2013;Hawke and Valiance 2015) and foliar N/P (Zheng and Shangguan 2007;Cleveland et al.2011;Salehi et al.2013;Turnbull et al.2016) than to foliar C/N.Studies concerning the urbanization effect on foliar traits in forest trees in New Zealand or Australia are nearly non-existent.This lack of research represents a considerable gap in our understanding of urbanization on forest stoichiometry.
Conclusions
At the global scale,the foliar C/N ratio of urban forest trees varied among different climate zones and tree taxa.Foliar C/N ratio in urban trees tended to be higher in forests near the equator and in eastern regions,mainly driven by lower foliar N concentration.Neither foliar C concentration nor foliar C/N in trees of urban forests was significantly higher than in rural forests.Among taxa,C4Amaranthus retroflexusandChenopodium ambrosoides(Amaranthaceae) had the lowest foliar C/N,andMyrsine guianensis(Primulaceae)andMyconia fallax(Asteraceae) had the highest.The change in foliar N concentration was the main driver of the change in foliar C/N for most tree species in urban forests.Further work is needed to detect the mechanism driving the decline in foliar C concentrations in urban forest trees,and more studies are needed on urban forests in the Southern Hemisphere.
AcknowledgementsDr.Zhibin Ren is acknowledged for his assistance for data collection and figure generation.Dr.Changwei Zhou for his essentially helpful assistance in literature searching and bibliography establishment.Authors are thankful to all anonymous reviewers and associate editors that have contributed to the outcome of final edition for publication.
杂志排行
Journal of Forestry Research的其它文章
- Flexible transparent wood enabled by epoxy resin and ethylene glycol diglycidyl ether
- Diversity and surge in abundance of native parasitoid communities prior to the onset of Torymus sinensis on the Asian chestnut gall wasp (Dryocosmus kuriphilus) in Slovenia,Croatia and Hungary
- Ozone disrupts the communication between plants and insects in urban and suburban areas:an updated insight on plant volatiles
- Testing visible ozone injury within aLight Exposed Sampling Site as aproxy for ozone risk assessment for European forests
- Logging and topographic effects on tree community structure and habitat associations in a tropical upland evergreen forest,Ghana
- Spatial pattern dynamics among co-dominant populations in early secondary forests in Southwest China
