Evaluation of groundwater quality using pollution index of groundwater(PIG)and non-carcinogenic health risk assessment in part of the Gangetic Basin
2021-07-02ApoorvVermaSingh
Apoorv Verma·N.B.Singh,2
Abstract The aim of this study was to evaluate groundwater f itness for domestic and irrigational use in Unnao district of Uttar Pradesh,India.For this study,block wise(n=16)groundwater samples were collected,and measured parameters were analyzed using the pollution index of groundwater(PIG),various irrigational indices,and graphical techniques.The results of this study suggested that most of the parameters were within the prescribed limits of WHO and BIS,excluding F-(0.4 to 2.6 mg L-1)and Fe2+ (0.1 to 1.7 mg L-1). Concentrations of total dissolved solids(TDS)were exceeded the desirable limit(>500 mg L-1)in 43.75%of samples at some sites.The Gibbs plot revealed that groundwater chemistry was governed by rock-water interaction in the region,especially silicate weathering.The Piper plot suggested that Ca2+-HCO3-is dominant hydrochemical facies in the area followed by mixed Ca2+-Na+-HCO3-type,Na+-Cltype,and Na+-HCO3-type.PIG evaluation revealed that the contribution of F-and Fe2+in groundwater degradation is high in comparison to other elements in the region,about 18.75%samples showed low pollution,while about 6.25%samples shows moderate pollution,and 6.25%samples ref lected high pollution.The human health risk(HHR)assessment f inding suggested that children(mean:1.36) are more vulnerable than adults (mean:1.01).Sodium absorption ration(SAR),Residual sodium carbonate(RSC),and Permeability index(PI)indicated that most of the groundwater was suitable for irrigation,whereas,Magnesium hazard ration(MHR)and Potential salinity(PS)indices suggested that only 37.5%and 56.25%of the samples were suitable for irrigational use,respectively.This regional study would help in decision making for stakeholders and relevant authorities in the execution of groundwater management and remediation plans in the area.
Keywords Groundwater·Pollution index of groundwater·Irrigational indices·Silicate weathering·Human health risk
1 Introduction
Groundwater resources are vital in India and different parts of the world.India uses about 230 cubic kilometers of groundwater annually,which is one-fourth globally(MacDonald et al.2016;Bhanja et al.2017).World Bank(2012)estimated that about 60%of India’s aquifers will be in more critical condition in the coming 20 years due to over-withdrawal.The total groundwater depletion in India is between 122 and 199 billion mduring the period of 1996–2016(Mishra et al.2018).In India,the dependence on groundwater in the agricultural sector is around 60%,and for drinking water supply is 85%(Zaveri et al.2016;Chindarkar and Grafton 2019).Groundwater in a large geographical area of India is severely affected by the geochemical and anthropogenic activities(Madhav et al.2018;Agarwal et al.2019;Khan and Umar 2019;Verma et al.2020a,2020b;Gupta 2020).Prolonged drinking of contaminated groundwater with inadequate hygiene is the cause of various health hazards(Yadav et al.2019;Mukherjee et al.2019;Adimalla 2020;Rao 2020).Safe drinking water is not just a basic need of every human being but also one of the primary human rights for a healthy lifestyle.Hence,public awareness of water quality is increasing in India and worldwide due to its direct impact on human health.Therefore,groundwater quality assessment becomes necessary before applying any remedial measures to overcome water-borne diseases.Groundwater quality degradation occurs when the contaminants load on the ground surface increases due to anthropogenic activity(Madhav et al.2018;Agarwal et al.2019;Verma et al.2020a,2020b).Due to which the soil of the vadose zone is gradually saturated by contaminated surface water as well as its detoxif ication capacity reduces,and then the contaminated water easily reaches the groundwater table(Khan and Umar 2019).The groundwater resources are naturally contaminated through typical hydro-geological and meteorological factors such as rock-water interaction processes,dissolution,weathering,evapotranspiration,precipitation,climate change(Singh and Singh 2018;Yadav et al.2019;Khan and Umar 2019;Duraisamy et al.2019;Pandey et al.2020).
Geochemistry and quality of groundwater is typically def ined by physical(pH,EC,and TDS)and chemical parameters such as cations(Ca,Mg,Na,K)and anions(Cl,SO,HCO,F,and NO).However,Fand NOare two major anionic elements that easily impair groundwater quality when beyond the limit,documented in several studies(Jha et al.2010,2011;Goyal et al.2010;Kumar and Saxena 2011;Ahamad et al.2018;Ward et al.2018;Agarwal et al.2019;Mukherjee et al.2019;Singh et al.2019;Adimalla 2020).Teotia and Teotia(1994)estimated that the Earth’s crust contains about 85 million tons of F,and of which 12 billion tons are found in India.The occurrence of high HCO,Na,and high pH helps to release Fions from the aquifer matrix in groundwater(Gupta 2020).The optimal NOconcentration is typically found<10 mg Lin natural and fresh groundwater,in contrast,up to or>100 mg Lcan be found in contaminated groundwater.However,the excessive use of agro-nitrogenous fertilizers and direct discharge of domestic-industrial wastewater on the surface increases the concentration of NO(>45 mg L;BIS 2012)in groundwater that is major cause of groundwater pollution in India(Ahamad et al.2018;Agarwal et al.2019;Adimalla 2019,2020).
The Gangetic belt of Uttar Pradesh province has potential aquifers due to which the groundwater resources have increased manifold (CGWB 2013).However,human intervention on these groundwater resources are increasing due to the over population and rapid urbanization in the region.Several studies highlighted that major districts in the state of Uttar Pradesh such as Agra,Aligarh,Allahabad,Ballia,Bhadohi,Gautam Buddh Nagar,Ghaziabad,Kanpur,Lucknow,Saharanpur,Siddharthnagar,and Varanasi are facing groundwater quality problems(Yadav et al.2019;Khan and Umar 2019;Pandey et al.2020;Singh and Singh 2018;Madhav et al.2018;Agarwal et al.2019;Chabukdhara et al.2017;Kumar et al.2018;Verma et al.2020a;Kumar et al.2019;Verma et al.2020b;Ahamad et al.2018).In the current evaluation area(Unnao),the majority of the inhabitants are completely reliant on groundwater for drinking and irrigation use.Central Groundwater Board(CGWB)and many studies reported(Goyal et al.2010;Jha et al.2010,2011;Kumar and Saxena 2011)that some areas of the Unnao have high Famount in groundwater,especially in Marks Nagar(0.8 to 13.9 mg L).Goyal et al.(2010)reported that some villages in the Unnao have high Feamount(0.5 to 1.9 mg L)in groundwater.The district has more than 80%of agricultural land and the widespread use of nitrogenous fertilizers in farming increases the possibility of groundwater contamination through NO.
Thus,the above reasons strengthen the need for reevaluation of groundwater quality periodically in the Unnao.For this,the Pollution Index of Groundwater(PIG)developed by Subba Rao(2012)has been adopted by adding two new parameters(total hardness and Fe).This approach describes the effect of each parameter chosen for the evaluation of groundwater quality.The major objectives of this groundwater evaluation are:(a)to appraise the hydro-geo-chemical characteristics and geochemical evolution of groundwater;(b)to evaluatethe contribution of each elements in groundwater pollution using PIG;(c)assessing non-carcinogenic human health risk;(d)to evaluatethe groundwater for irrigationusing various indices and ratios.
2 Description of study area
2.1 Geolocation and climate
Unnao region is a f lat terrain that covers an area of 4558 km,situated between 26°05’and 27°02’N latitudes,and 80°03’and 81°03E longitudes,in Uttar Pradesh state of India(Fig.1).It is 103 to 127 m above from mean sea level(amsl)with a slope from north to southeast(CGWB 2013).The study area has distinctively four seasons:winter(November to mid-March),summer(March to May),monsoon(June to September),and recurring-monsoon(September–October).The temperature reaches 116°F in summers while falls to 39.2°F in the winters in the study area.The average annual rainfall is reported about 837.13 mm and extreme rainfall takes place in the monsoon period during the month of June–September with an average value of 743.60 mm(IMD 2020).

Fig.1 Study area map showing sampling sites in Unnao
2.2 Geology and hydrogeology
The geology of the study area is a Quaternary alluvial,which is classif ied based on the superposition of sediments into two broad categories:older and newer alluvium.The older alluviumis formed through river-channel depositions during the Middle to Upper Pleistocene epoch.In addition,Varanasi older alluvium(VOA)is the prevalent geomorphic lithologies are found in high-land of the region.It comprises of polycyclic sedimentary sequence of oxidized clay,silt,and grey to brown sand that periodically mixes with ferro-magnesium and calcareous nodules.The newer alluvium is formed during the Holocene epoch,comprises mainly the f lood plain channels and sand bars in low land regions.It is composed of polycyclic deposition of sediments that consist of oxidized clay,silt,and grey sand of medium-grained sizes(CGWB 2013).
The groundwater resources of the area primarily drained by the River Ganges and its tributary rivers.Aquifer matrix in the area is composed of various grades of alluvial sand,gravel,and pebble sediments.The sub-surface polycyclic events of granular and clay depositions forms a multilayered aquifer system in the area.The direction of groundwater f low in the study area is from the northeast to the southeast direction.CGWB(2013)has drilled several exploratory boreholes and found that three major aquifer groups are present in Unnao.The f irst aquifer system has been found to a depth of about 90 m,most of the dug wells(deep and/or shallow)used to extract water from it.Second and third aquifer systems below ground level exist between 100 and 250 m and between 250 and 455 m,respectively(CGWB 2013).Typically,the depth of the water level ranged between 2.15 and 14.13 m during the pre-monsoon period,and normal f luctuations have been observed during the post–pre-monsoon period between-0.50 and 3.50 m (CGWB 2013)in f irst aquifer group.For this study,samples from the f irst aquifer group were taken in which both unconf ined and semi-conf ined to conf ined aquifer types are prevalent.
3 Methodology
3.1 Sampling,f ield and laboratory analysis

3.2 Verif ication of chemical analysis
The percent charge balance errors(%CBE)verif ication method was used to check the authenticity of the chemical analysis.Fritz(1994)described that only charge balance is not a credible scale of accuracy,whereas%CBE is more authentic for verif ication of chemical analysis as a means of rectifying the analytical procedures.Therefore,%CBE was calculated using Eq.1 and found that it was within the acceptable range of±5(supplementary Table S1).

where all the concentration in meq L.The obtained data has been analyzed to understand and assess groundwater quality.In addition,the spatial distribution maps of each element have also been prepared using Arc GIS 10.4.4 platform through an inverse distance weighted spatial interpolation tool.
3.3 Pollution index of groundwater
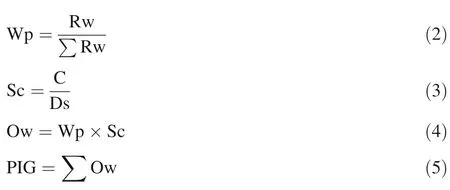
It is a f ive-step method,in the f irst step the relative weight(Rw)has been assigned to selected parameters on a scale of 1 to 5(Subba Rao 2012).The second step involves the calculation of the weight parameter(Wp)for each selected element of groundwater using Eq.2(Table 1).After that,the concentration status(Sc)for each selected element has been calculated using Eq.3 in step three,where C represents the concentration of each variable in the groundwater sample and Ds represents the standard limit.For this,standard limits(Ds)set by the Bureau of Indian Standards(BIS 2012)and World Health Organization standards(WHO 2011)have been used.The fourth step involves the calculation of the overall quality(Ow)for each element using Eq.4.Finally,the PIG is determined using Eq.5 by the summation of the overall water quality(Ow)values of all selected elements for each sample.
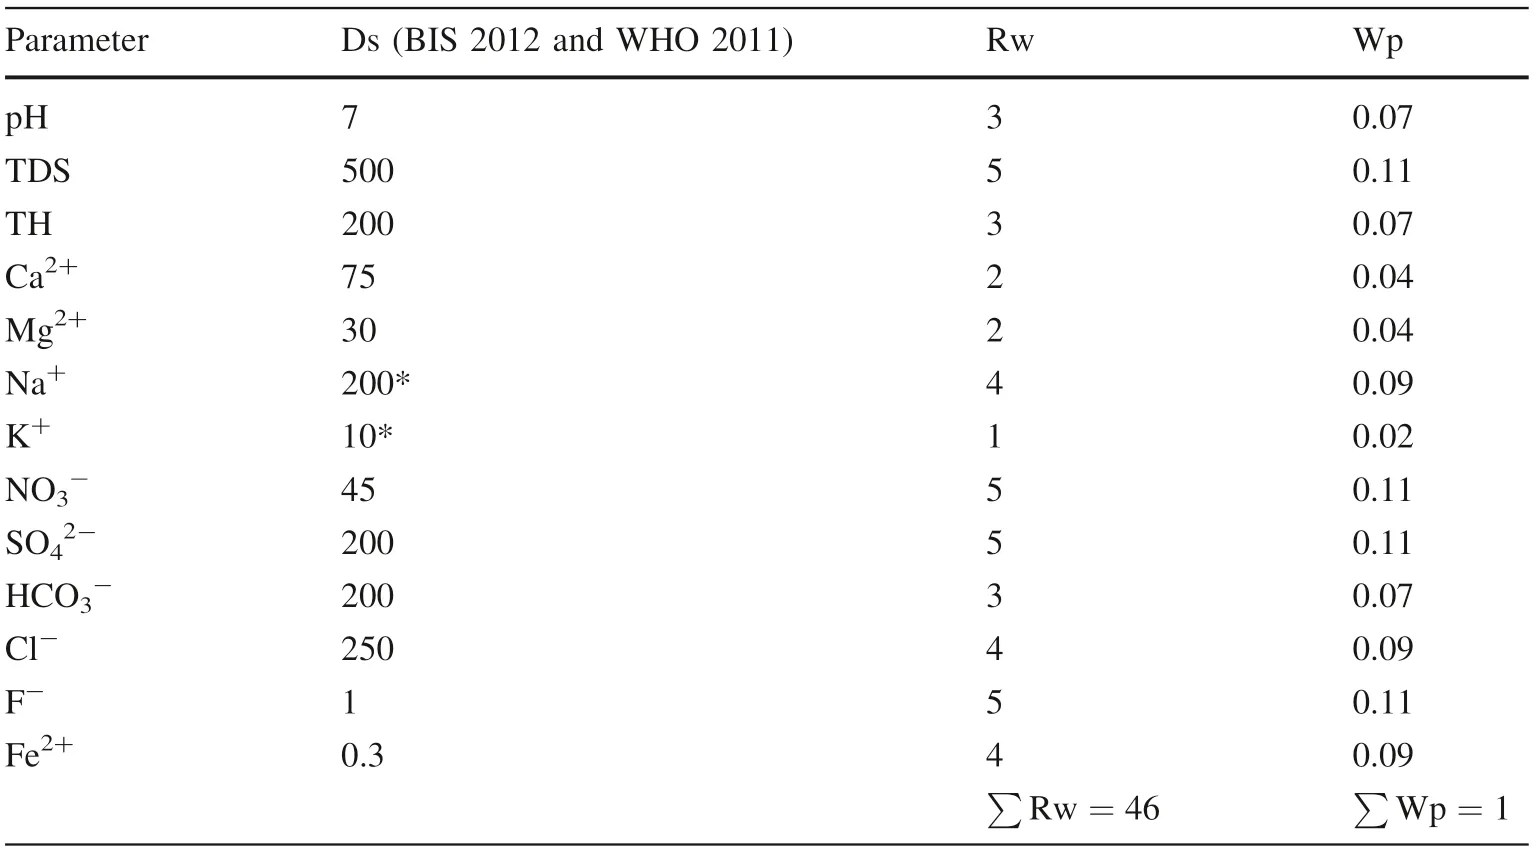
Table 1 Relative weight and weighted parameters used for PIG computation(units in mg L-1;pH in standard units;*Subba Rao 2012)
3.4 Water quality for irrigation
The groundwater quality for irrigation use is majorly reliant on concentrations of Ca,Na,Mg,and HCO-ions in irrigated water(Kadyampakeni et al.2018;Madhav et al.2018;Verma et al.2020b).Concentrations of these ions regulate most of the indices and ratios used for the evaluation of groundwater for irrigation.Some important indices and ratios:sodium absorption ratio(SAR),residual sodium carbonate(RSC),sodium soluble percentage(SSP),magnesium hazard ratio(MHR),Kelly ratio(KR),percent sodium (%Na),permeabilityindex (PI),and potential salinity(PS)are often used to assess the groundwater quality for irrigation(Richards 1954;Eaton 1950;Wilcox 1955;Kelly 1957;Szabolcs and Darab 1964;Doneen 1964).The following functions have been used to calculate the above-mentioned indices and ratios:
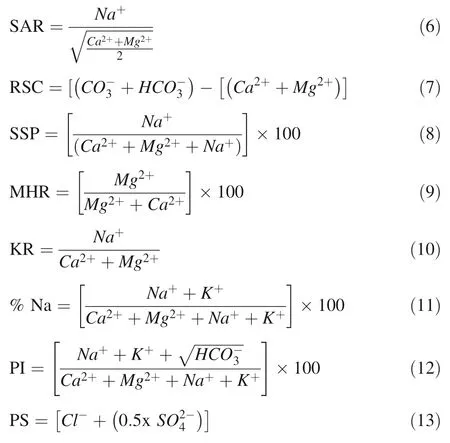
where concentrations of all ions are expressed in m eqL.
3.5 Human health risk assessment


where CGW represents concentration in groundwater of chemical element(F,NOand Fe)in mg L.IR means the ingestion rate of individuals in Ld.The IR standards for adultsand children is 2.5 and 0.78 Ld,respectively(Adimalla 2020).ED is exposure duration in years,has been assumed to be 6 and 70 years for children and adults,respectively(Adimalla 2019).EF is exposure frequency,for both adults and children,its value is 365 days/year(Rao 2020).ABW signif ies the average body weight in kg(for children it is 15 kg and for adults 65 kg,Adimalla 2020).AET designates the average exposure time,where the input value is taken as 2190 days for children and 25,550 for adults.
Reference dose(RfD)is used as a standard for noncancerous chemical elements whose prolonged in appropriate use causes hazards in which F,NOand Feare prevalent.However,the probability of health risk increases after the exposure dose exceeds the RfD,which is called the hazard quotient(HQ)and has been calculated using Eq.15(USEPA 1989).


4 Results and Discussion
4.1 Groundwater chemistry

In the study area,pH ranged between 7.8 and 8.5 with an average value of 8.2(Table 2).The nature of groundwater in the study area is mostly alkaline.Further,the spatial variation map of pH ref lects that the northwestern and some central regions have the highest pH values(Fig.2a).Likewise,EC varied between 531 and 3320μS cmwith a mean of 997.4μS cm(Table 2).Langenegger(1990)classif ication of EC,suggests that about 81.25%of samples are permissible type while about 6.25%and 12.5%sample are brackish and saline type,respectively(Table 3).Likewise,the concentrations of TDS in the region ranged from 256 to 2205 mg Lwith a mean of 678.7 mg L(Table 2).Freeze and Cherry’s(1979)classif ication of TDS indicates that about 81.25%of the samples are fresh while 18.75%of the samples are brackish(Table 3).Moreover,as per Davis and De Wiest(1966)classification,only 56.25%of the samples are desirable for drinking while about 31.25%of the samples are permissible for drinking when alternative options are not available(Table 3).About 12.25%of the samples are appropriate for irrigational usage in the region.The spatial variation map of TDS(Fig.2c),shows that in some western and eastern parts have elevated concentrations of TDS.The TH ranged between 145 and 670 mg Lwith a mean of 276.6 mg L(Table 2).According to the Sawyer and McCarty(1967)scale of TH,about 12.5%and 87.5%of the groundwater samples are very hard and hard type,correspondingly(Table 3).The high amount of TH is likely to be due to the high amounts of Mgand Caions are present in groundwater of the study area.Nevertheless,particularly high levels of Mgion helps to reduce the risk of heart disease(Rosenlund et al.2005).The spatial variation map of TH(Fig.2d),suggests that water quality is hard to very hard in some western and eastern parts of the Unnao.
The amount of Cavaried from 21 to 160 mg Lwith 61.1 mg Lmean value (Table 2).Moreover,all groundwater samples have been found to be under the maximum limit of BIS(2012)and WHO(2011).The spatial distribution map reveal that there is surplus Caions in the groundwater of the west-northern and middleeastern part(Fig.2e).Likewise,Mgconcentrations varied from 16 to 96 mg L,with 38.9 mg Lmean value in the study area.The spatial variation map shows that most of the eastern part has high concentrations of Mgin groundwater(Fig.2f).

Fig.2 Spatial variation maps of a pH;b EC;c TDS;d TH;e calcium;f magnesium
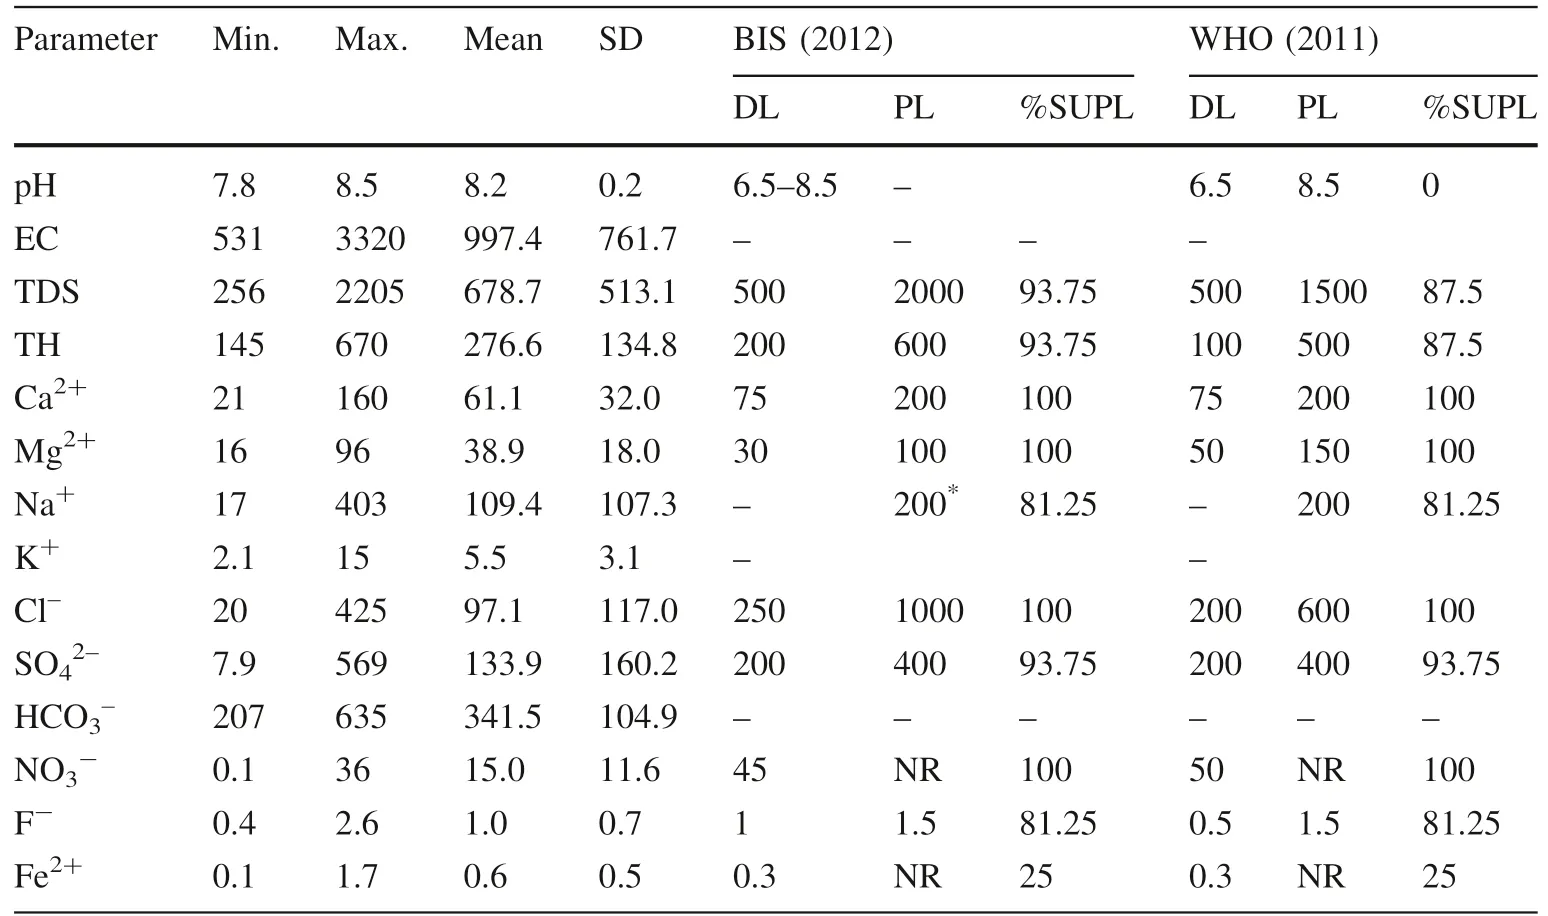
Parameter Min. Max. Mean SD BIS(2012) WHO(2011)DL PL %SUPL DL PL %SUPL pH 7.8 8.5 8.2 0.2 6.5–8.5 – 6.5 8.5 0 EC 531 3320 997.4 761.7– – – –TDS 256 2205 678.7 513.1 500 2000 93.75 500 1500 87.5 TH 145 670 276.6 134.8 200 600 93.75 100 500 87.5 Ca2+ 21 160 61.1 32.0 75 200 100 75 200 100 Mg2+ 16 96 38.9 18.0 30 100 100 50 150 100 Na+ 17 403 109.4 107.3– 200*81.25 – 200 81.25 K+ 2.1 15 5.5 3.1 – –Cl– 20 425 97.1 117.0 250 1000 100 200 600 100 SO42– 7.9 569 133.9 160.2 200 400 93.75 200 400 93.75 HCO3– 207 635 341.5 104.9– – – – – –NO3- 0.1 36 15.0 11.6 45 NR 100 50 NR 100 F- 0.4 2.6 1.0 0.7 1 1.5 81.25 0.5 1.5 81.25 Fe2+ 0.1 1.7 0.6 0.5 0.3 NR 25 0.3 NR 25

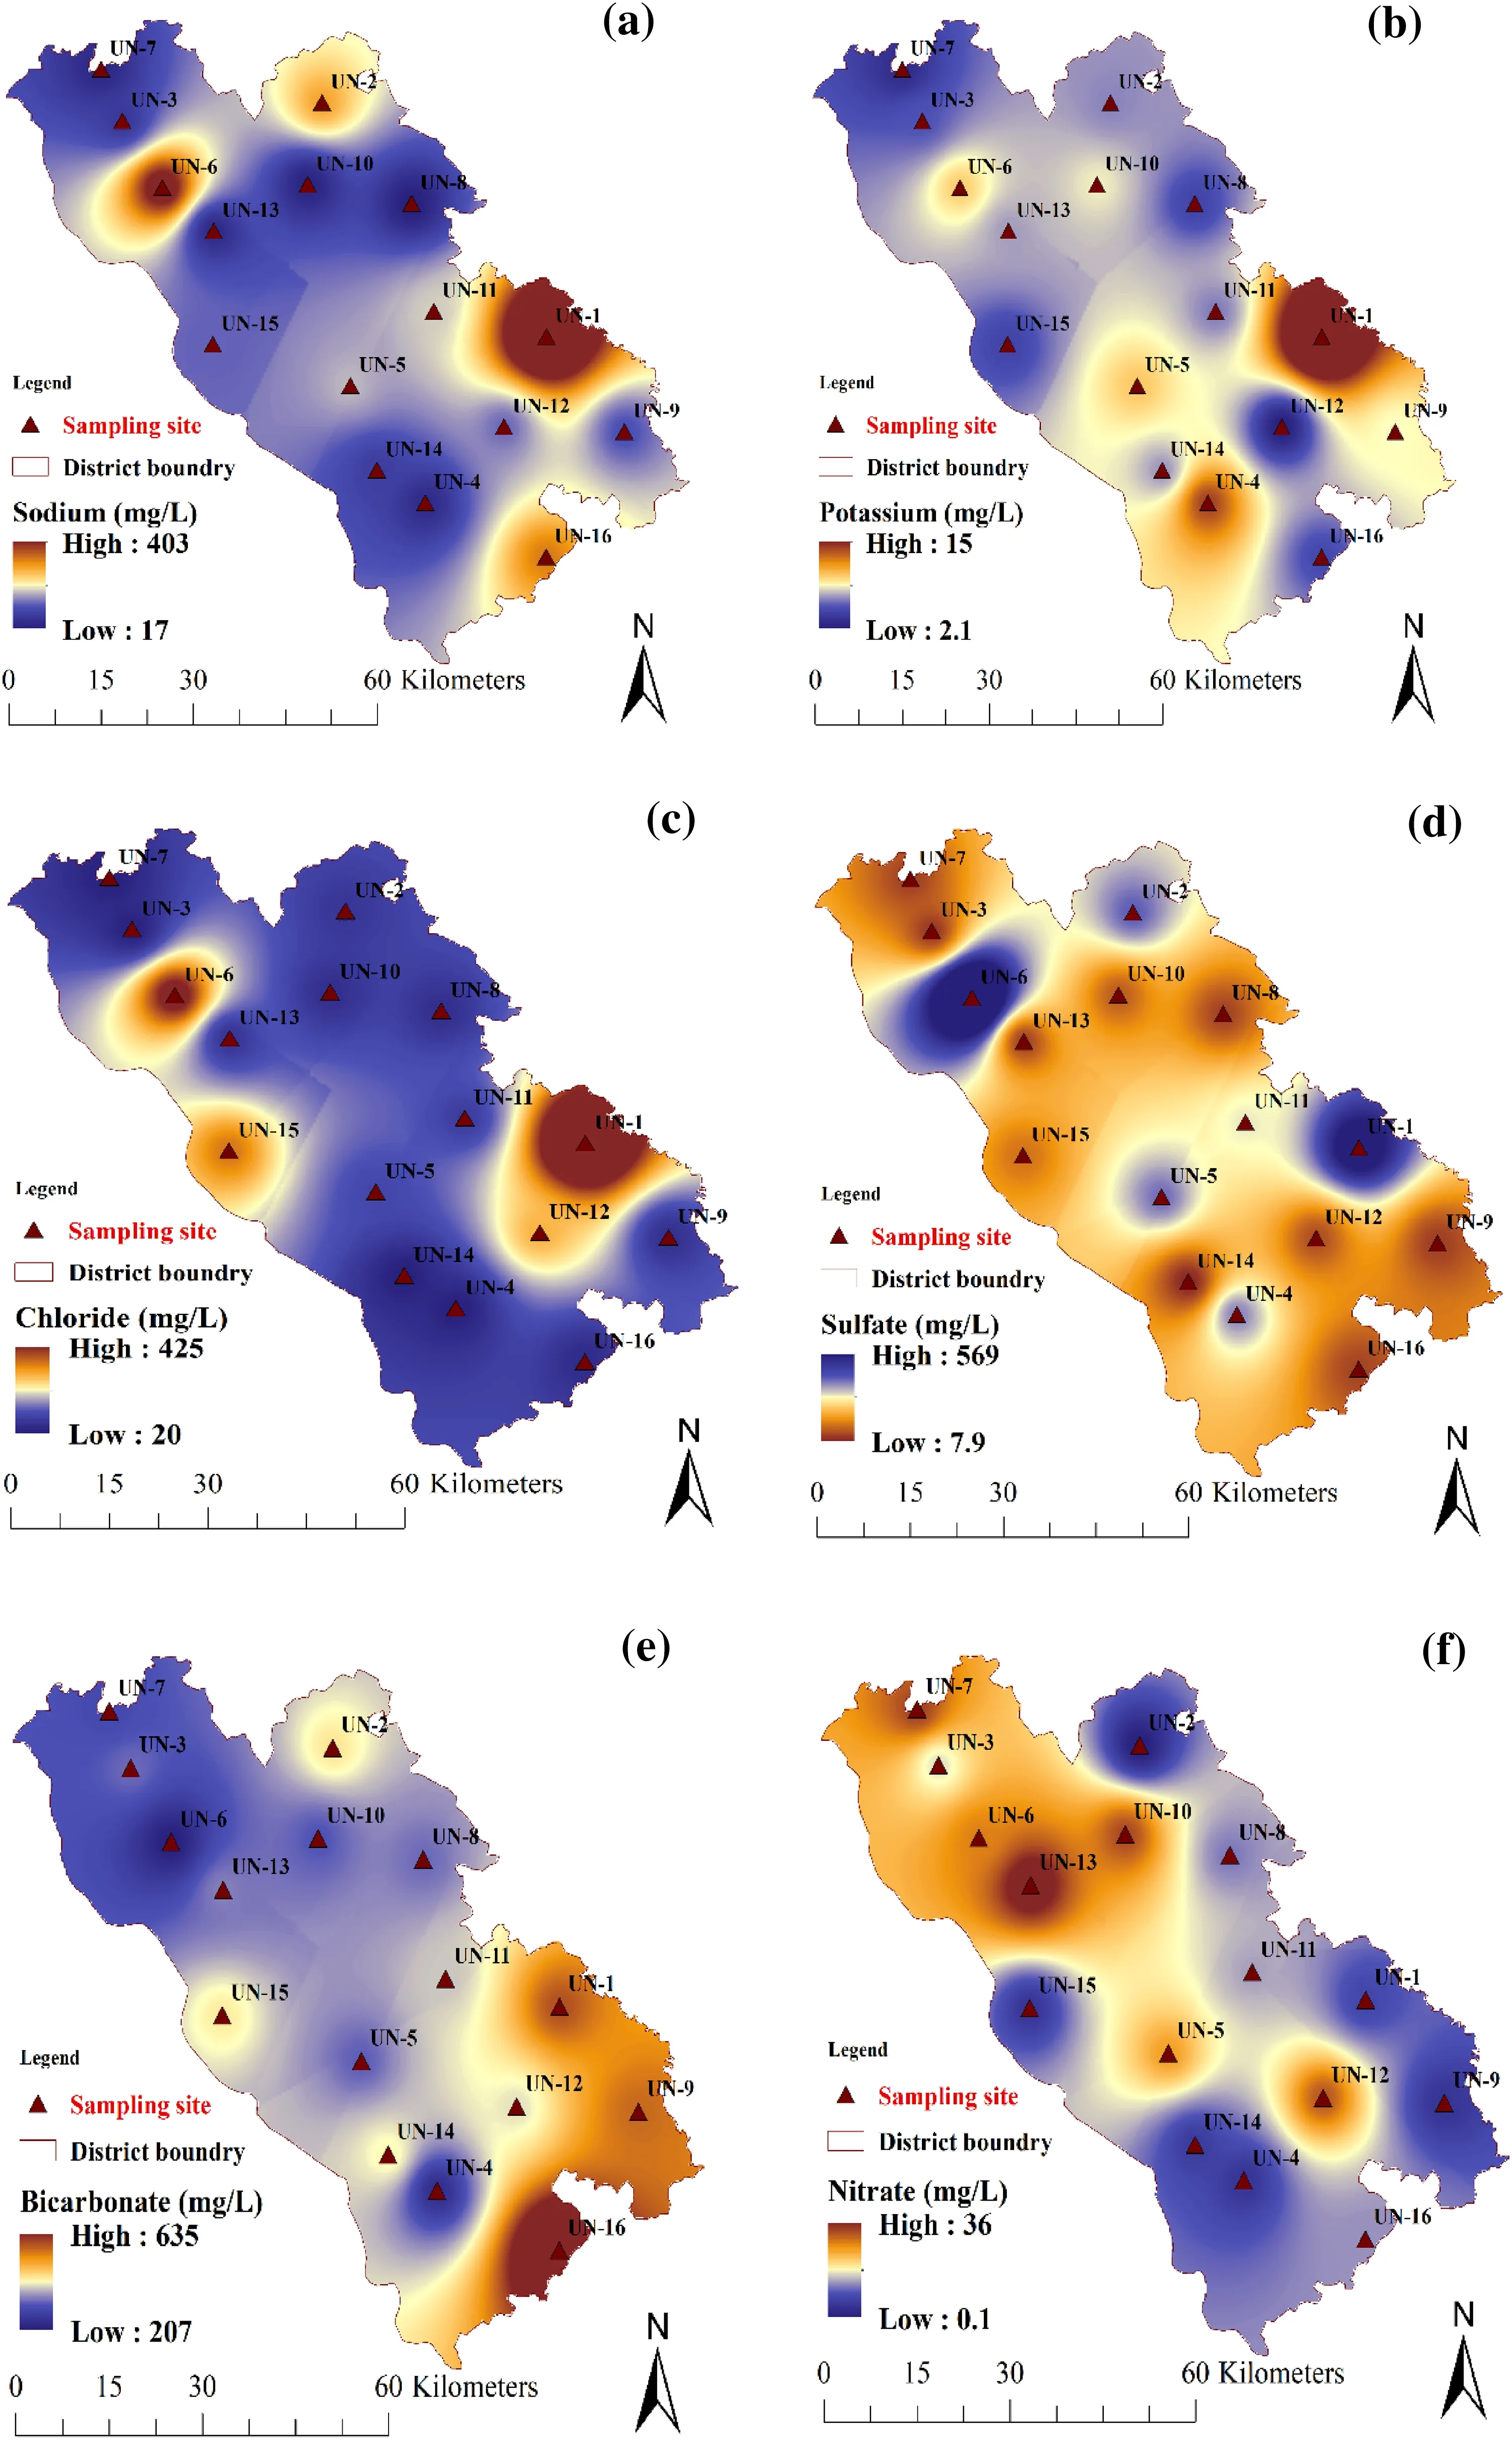
Fig.3 Spatial variation maps of a sodium;b potassium;c chloride;d sulfate;e bicarbonate;f nitrate
The mean value of Fis 1 mg Land concentrations ranged between 0.4 mg Land 2.6 mg L.The map of Fion concentrations indicate that the central eastern and southern regions are majorly Faffected areas in Unnao(Fig.4a).Likewise,the mean of Feis 0.6 mg Land concentrations ranged between 0.1 and 1.7 mg L(Table 2).Figure 4b reveal that most of the southern region of the investigation areas are affected by high Fecontent in groundwater(>0.3 mg L; BIS 2012;WHO 2011).

Fig.4 Spatial distribution maps of a f luoride b iron

Parameter Range Water type/Category No.of samples %of samples EC(μS cm-1)(Langenegger 1990) 0–333 Excellent – –333–500 Good – –500–1100 Permissible 13 81.25 1100–1500 Brackish 1 6.25 1500–10,000 Saline 2 12.5 TDS(mg L-1)(Davis and De Wiest 1966) <500 Desirable for drinking 9 56.25 500–1000 Permissible for drinking 5 31.25 1000–3000 Useful for irrigation 2 12.25>3000 Unf it for drinking and irrigation – –TDS(mg L-1)(Freeze and Cherry 1979) <1000 Fresh 13 81.25 1000–10,000 Brackish 3 18.75 10,000–100,000 Saline – –>100,000 Brine – –TH(mg L-1)(Sawyer and McCarty 1967) <75 Soft – –75–150 Moderately hard – –150–300 Hard 14 87.5>300 Very hard 2 12.5
4.2 Natural evolution of groundwater and water types
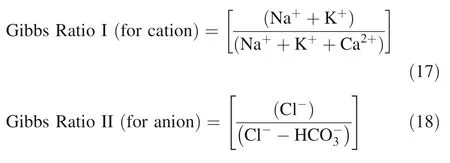
The Gibbs(1970)proposed logarithmic plots to comprehend the mechanisms governing groundwater chemistry and factors prevailing the major ion concentrations.It is a worldwide accepted graphical procedure(Ahamad et al.2018;Madhav et al.2018;Adimalla 2019;Verma et al.2020a,2020b),in which two plots:(a)TDS versus(Na+K)/(Na+K+Ca);(b)TDS versus Cl/(Cl+HCO)are plotted.Each plot is categorized in three different f ields:evaporation,precipitation,and rock dominance.The Gibbs ratio I(for cations)and II(for anions)has been computed using Eqs.17 and 18,respectively.Both plots(Fig.5a and b)indicates that ion chemistry of groundwateris primarily regulated by rockweathering or host rock-water interaction processesin the study area.

Fig.5 Gibbs plots a(Na++K+)/(Na++K++Ca2+)versus TDS;b Cl-/(Cl-+HCO3-)versus TDS


Furthermore,Schoeller(1977)developed a method to evaluate the ion-exchange process during water residence and movement in the host rock and in the unsaturated zone.Therefore,two different indices as chloro-alkaline indices(CAI-I,and II)were computed using Eqs.19 and 20,respectively.Negative values for both CAI-I and II designate about the incidence of forward ion-exchange,whereas positive values designate the occurrence of reverse ionexchange(Schoeller 1977).The results of Figs.7a and 7b show that there is the dominance of reverse ion-exchange processes rather than the forward ion-exchange processes in discharging alkalies elements(Na+K).However,about 56.25%of samples showing negative values of CAII,indicates that forward ion exchange processes also played a vital role in governing hydro-geo-chemistry of groundwater in a few locations of the study region(Fig.7b).

Fig.7 Chloro alkaline indices plots of a CAI-I vs.groundwater samples,b CAI-II vs.groundwater samples


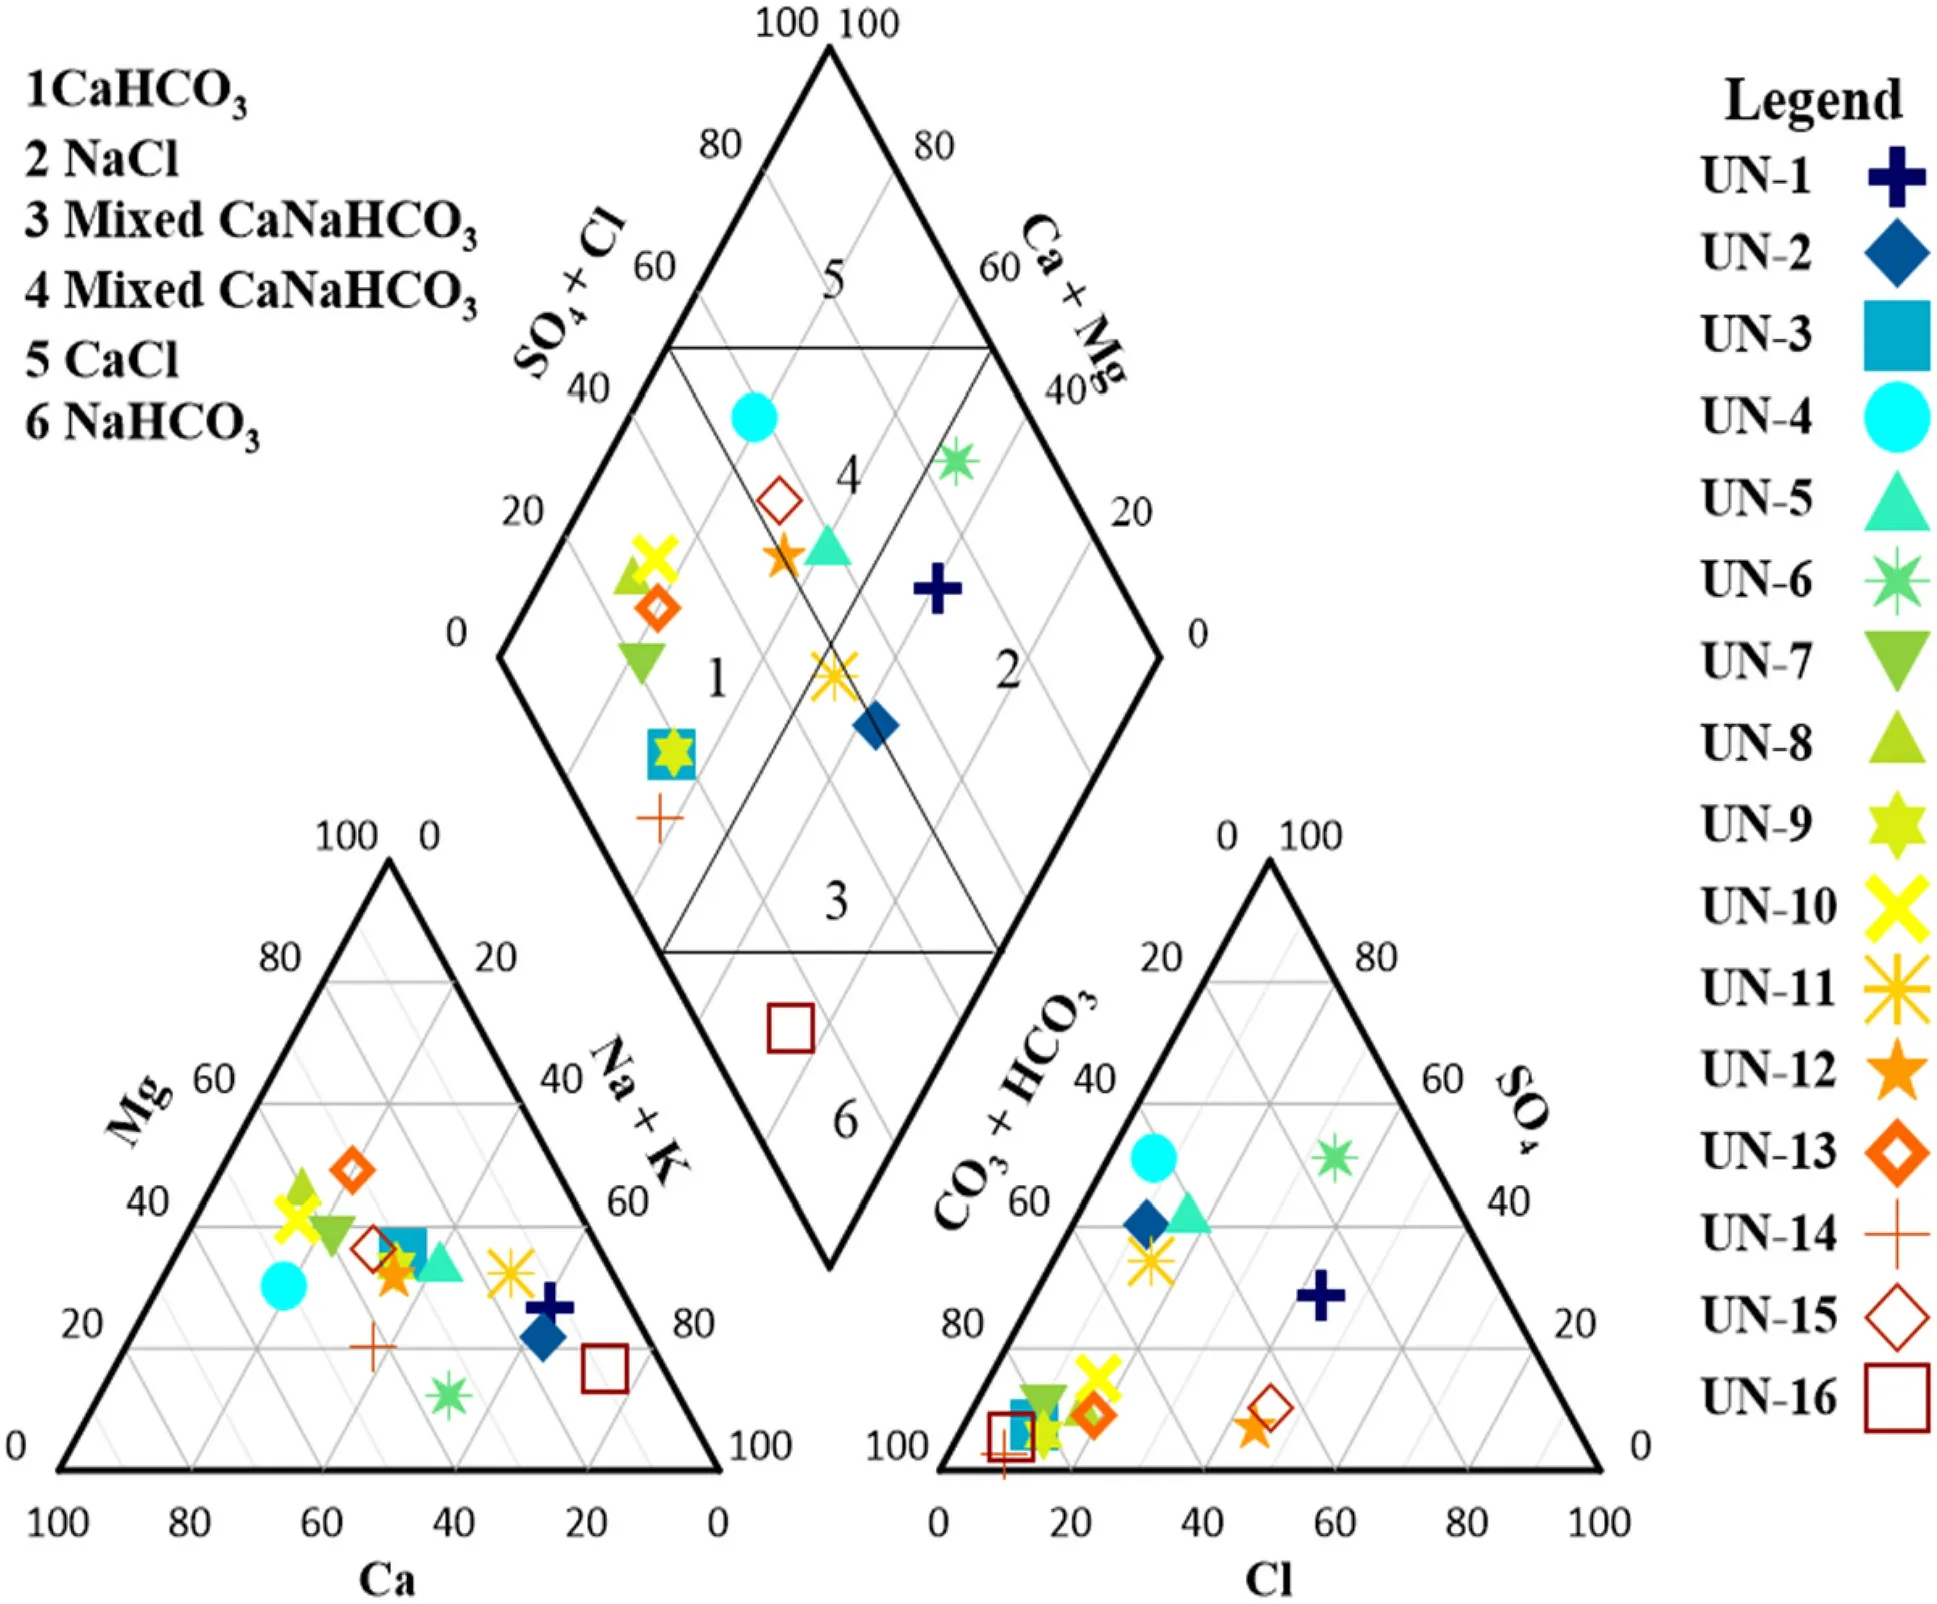
Fig.8 Piper plot showing different hydrochemical facies in Unnao
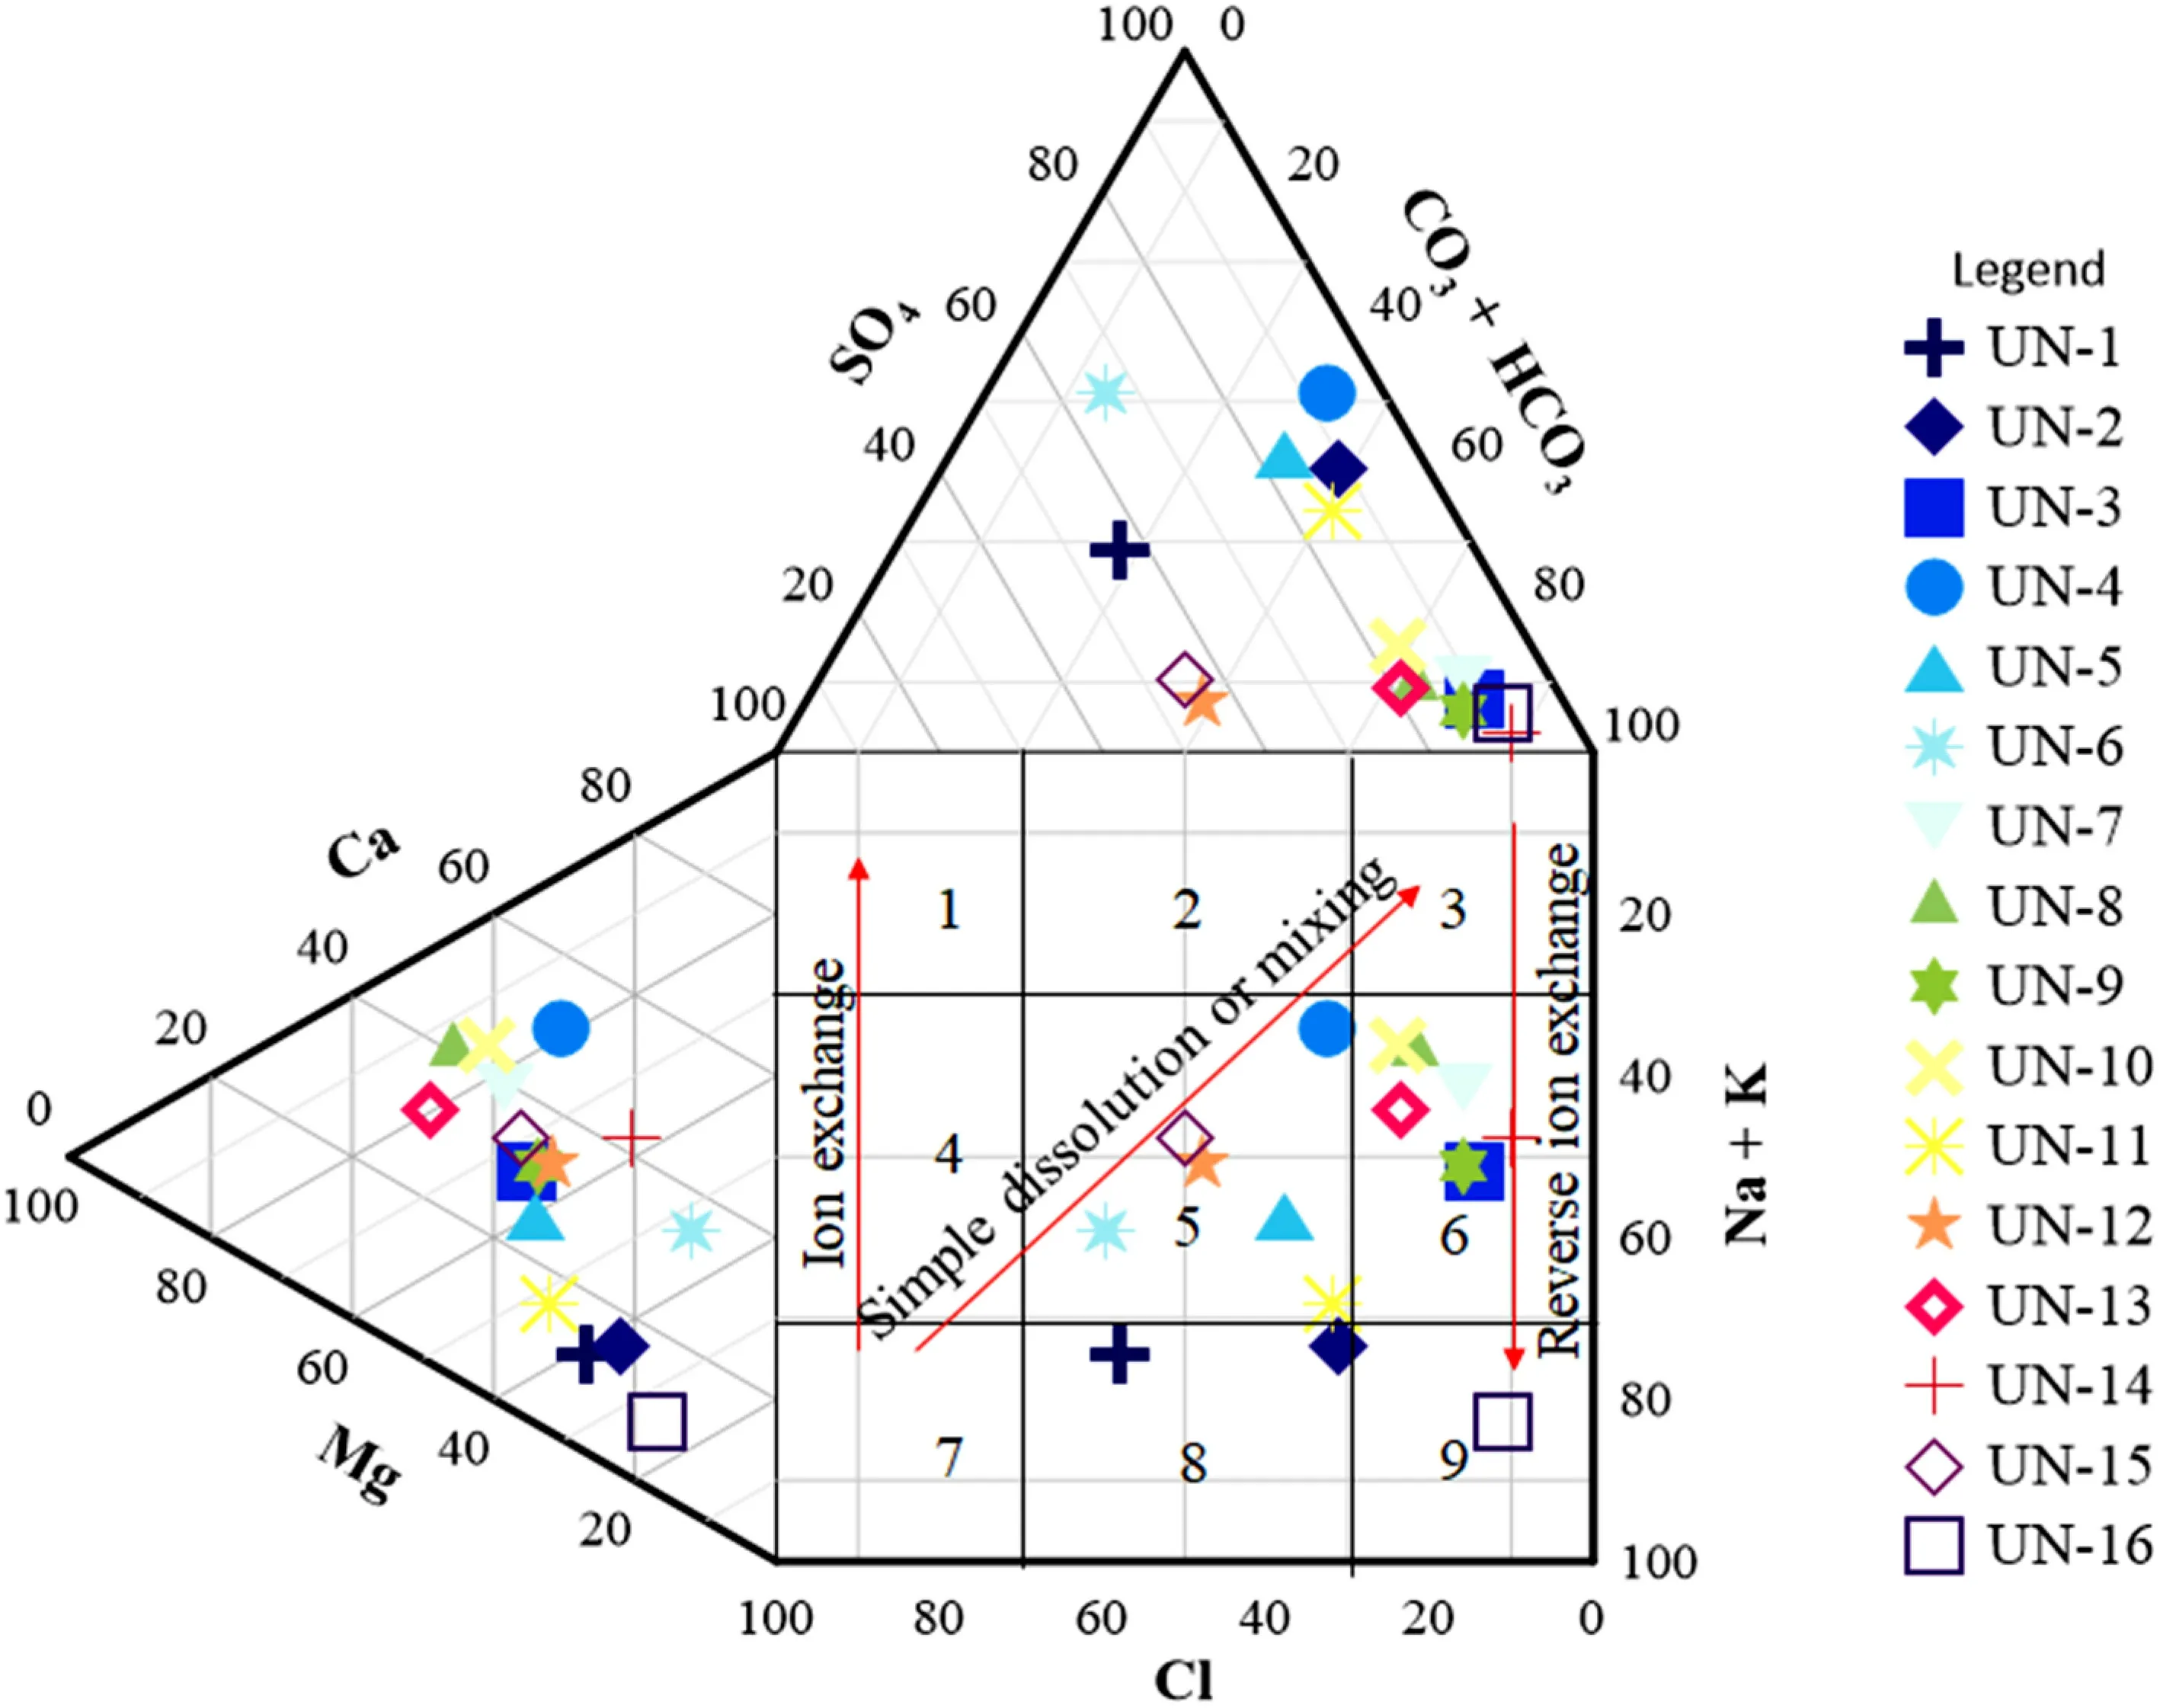
Fig.9 Durov plot showing ionexchange processes in Unnao
4.3 Evaluation of groundwater pollution

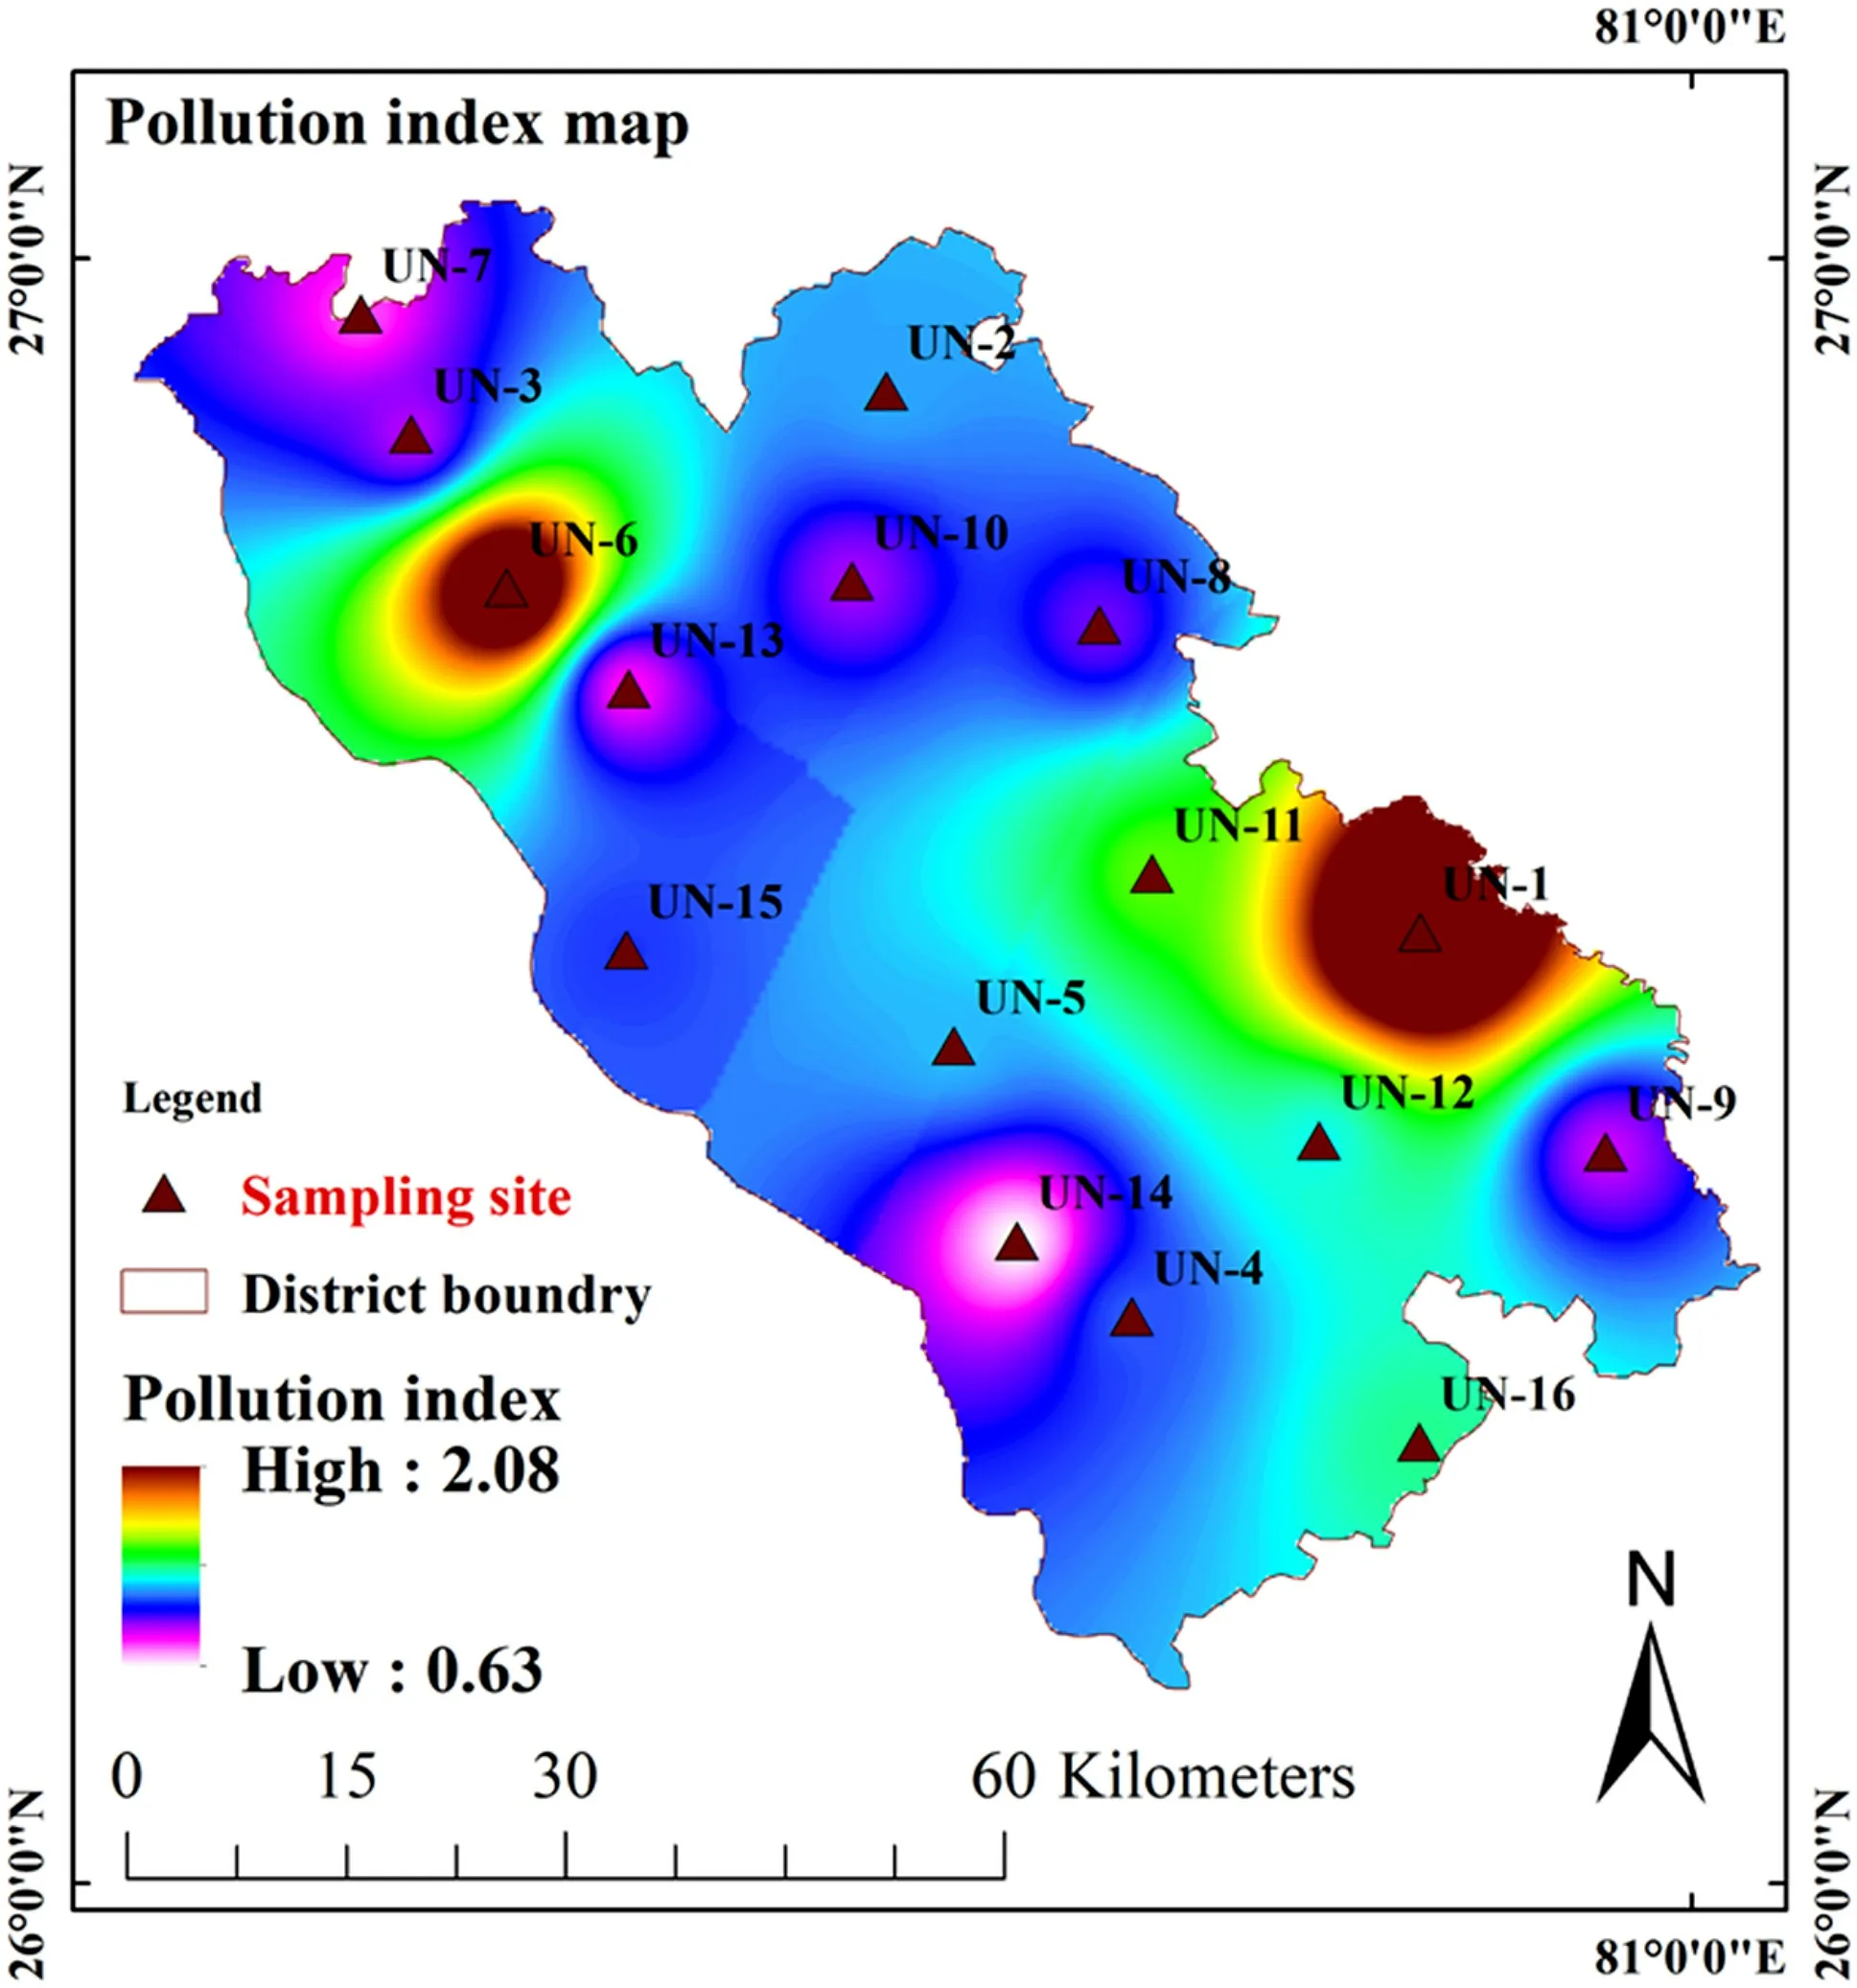
Fig.10 Pollution index map of Unnao district

Table 5 Classif ication of groundwater based on PIG in Unnao
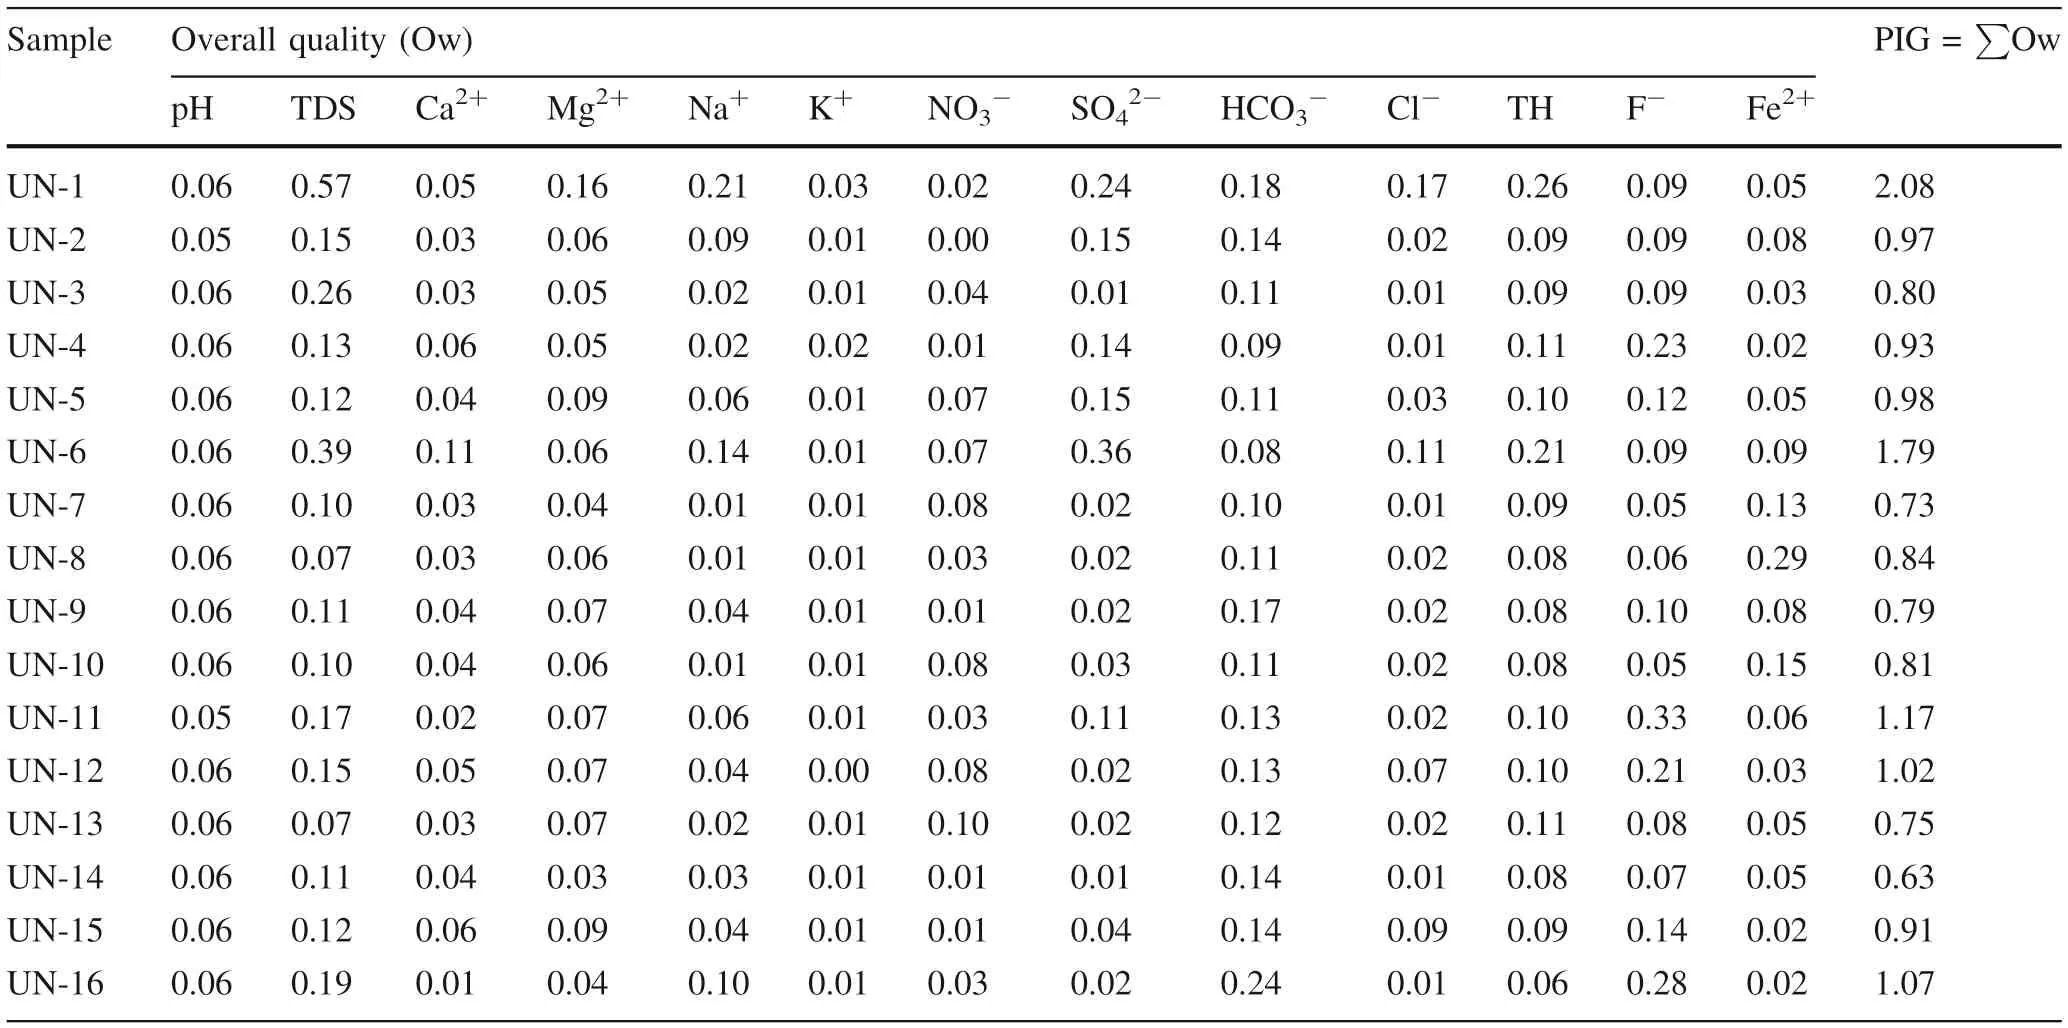
Sample Overall quality(Ow) PIG=∑Ow pH TDS Ca2+ Mg2+ Na+ K+ NO3- SO42- HCO3- Cl- TH F- Fe2+UN-1 0.06 0.57 0.05 0.16 0.21 0.03 0.02 0.24 0.18 0.17 0.26 0.09 0.05 2.08 UN-2 0.05 0.15 0.03 0.06 0.09 0.01 0.00 0.15 0.14 0.02 0.09 0.09 0.08 0.97 UN-3 0.06 0.26 0.03 0.05 0.02 0.01 0.04 0.01 0.11 0.01 0.09 0.09 0.03 0.80 UN-4 0.06 0.13 0.06 0.05 0.02 0.02 0.01 0.14 0.09 0.01 0.11 0.23 0.02 0.93 UN-5 0.06 0.12 0.04 0.09 0.06 0.01 0.07 0.15 0.11 0.03 0.10 0.12 0.05 0.98 UN-6 0.06 0.39 0.11 0.06 0.14 0.01 0.07 0.36 0.08 0.11 0.21 0.09 0.09 1.79 UN-7 0.06 0.10 0.03 0.04 0.01 0.01 0.08 0.02 0.10 0.01 0.09 0.05 0.13 0.73 UN-8 0.06 0.07 0.03 0.06 0.01 0.01 0.03 0.02 0.11 0.02 0.08 0.06 0.29 0.84 UN-9 0.06 0.11 0.04 0.07 0.04 0.01 0.01 0.02 0.17 0.02 0.08 0.10 0.08 0.79 UN-10 0.06 0.10 0.04 0.06 0.01 0.01 0.08 0.03 0.11 0.02 0.08 0.05 0.15 0.81 UN-11 0.05 0.17 0.02 0.07 0.06 0.01 0.03 0.11 0.13 0.02 0.10 0.33 0.06 1.17 UN-12 0.06 0.15 0.05 0.07 0.04 0.00 0.08 0.02 0.13 0.07 0.10 0.21 0.03 1.02 UN-13 0.06 0.07 0.03 0.07 0.02 0.01 0.10 0.02 0.12 0.02 0.11 0.08 0.05 0.75 UN-14 0.06 0.11 0.04 0.03 0.03 0.01 0.01 0.01 0.14 0.01 0.08 0.07 0.05 0.63 UN-15 0.06 0.12 0.06 0.09 0.04 0.01 0.01 0.04 0.14 0.09 0.09 0.14 0.02 0.91 UN-16 0.06 0.19 0.01 0.04 0.10 0.01 0.03 0.02 0.24 0.01 0.06 0.28 0.02 1.07
4.4 Human health risk assessment


Table 7 Descriptive statistics of computed irrigation indices values

Fig.12 Health risk map based on THI for adults in Unnao

Fig.13 Health risk map based on THI for childrens in Unnao

Sample ID Adult Children ADD(NO3-)ADD(F-)ADD(Fe2+)HQ(NO3-)HQ(F-)HQ(Fe2+)THI ADD(NO3-)ADD(F-)ADD(Fe2+)HQ(NO3-)HQ(F-)HQ(Fe2+)THI UN-1 0.24 0.03 0.02 0.15 0.43 0.03 0.61 0.32 0.03 0.03 0.20 0.58 0.04 0.82 UN-2 0.00 0.03 0.01 0.00 0.44 0.02 0.46 0.01 0.04 0.02 0.00 0.60 0.02 0.62 UN-3 0.56 0.03 0.03 0.35 0.44 0.04 0.83 0.75 0.04 0.04 0.47 0.59 0.06 1.12 UN-4 0.14 0.07 0.06 0.09 1.16 0.09 1.33 0.19 0.09 0.08 0.12 1.57 0.12 1.80 UN-5 0.88 0.03 0.02 0.55 0.58 0.03 1.16 1.20 0.05 0.03 0.75 0.78 0.04 1.57 UN-6 0.96 0.03 0.01 0.60 0.46 0.02 1.08 1.30 0.04 0.01 0.81 0.62 0.02 1.46 UN-7 1.13 0.02 0.01 0.71 0.25 0.01 0.97 1.53 0.02 0.01 0.96 0.34 0.01 1.31 UN-8 0.39 0.02 0.00 0.24 0.28 0.00 0.53 0.53 0.02 0.00 0.33 0.38 0.01 0.71 UN-9 0.14 0.03 0.01 0.09 0.50 0.02 0.60 0.19 0.04 0.02 0.12 0.68 0.02 0.82 UN-10 1.12 0.02 0.01 0.70 0.26 0.01 0.96 1.51 0.02 0.01 0.94 0.35 0.01 1.30 UN-11 0.46 0.10 0.02 0.29 1.67 0.02 1.98 0.62 0.14 0.02 0.39 2.25 0.03 2.67 UN-12 1.08 0.06 0.03 0.67 1.06 0.05 1.78 1.46 0.09 0.05 0.91 1.43 0.07 2.41 UN-13 1.38 0.03 0.02 0.87 0.42 0.03 1.31 1.87 0.03 0.03 1.17 0.56 0.04 1.77 UN-14 0.18 0.02 0.02 0.11 0.36 0.03 0.50 0.24 0.03 0.03 0.15 0.49 0.04 0.67 UN-15 0.15 0.04 0.04 0.09 0.69 0.06 0.84 0.20 0.06 0.06 0.12 0.94 0.08 1.14 UN-16 0.43 0.08 0.07 0.27 1.38 0.09 1.74 0.59 0.11 0.09 0.37 1.86 0.13 2.36 Min. 0.00 0.02 0.00 0.00 0.25 0.00 0.46 0.01 0.02 0.00 0.00 0.34 0.01 0.62 Max. 1.38 0.10 0.06 0.87 1.67 0.09 1.98 1.87 0.14 0.08 1.17 2.25 0.12 2.67 Mean 0.62 0.04 0.02 0.39 0.59 0.03 1.01 0.84 0.05 0.03 0.52 0.80 0.04 1.36
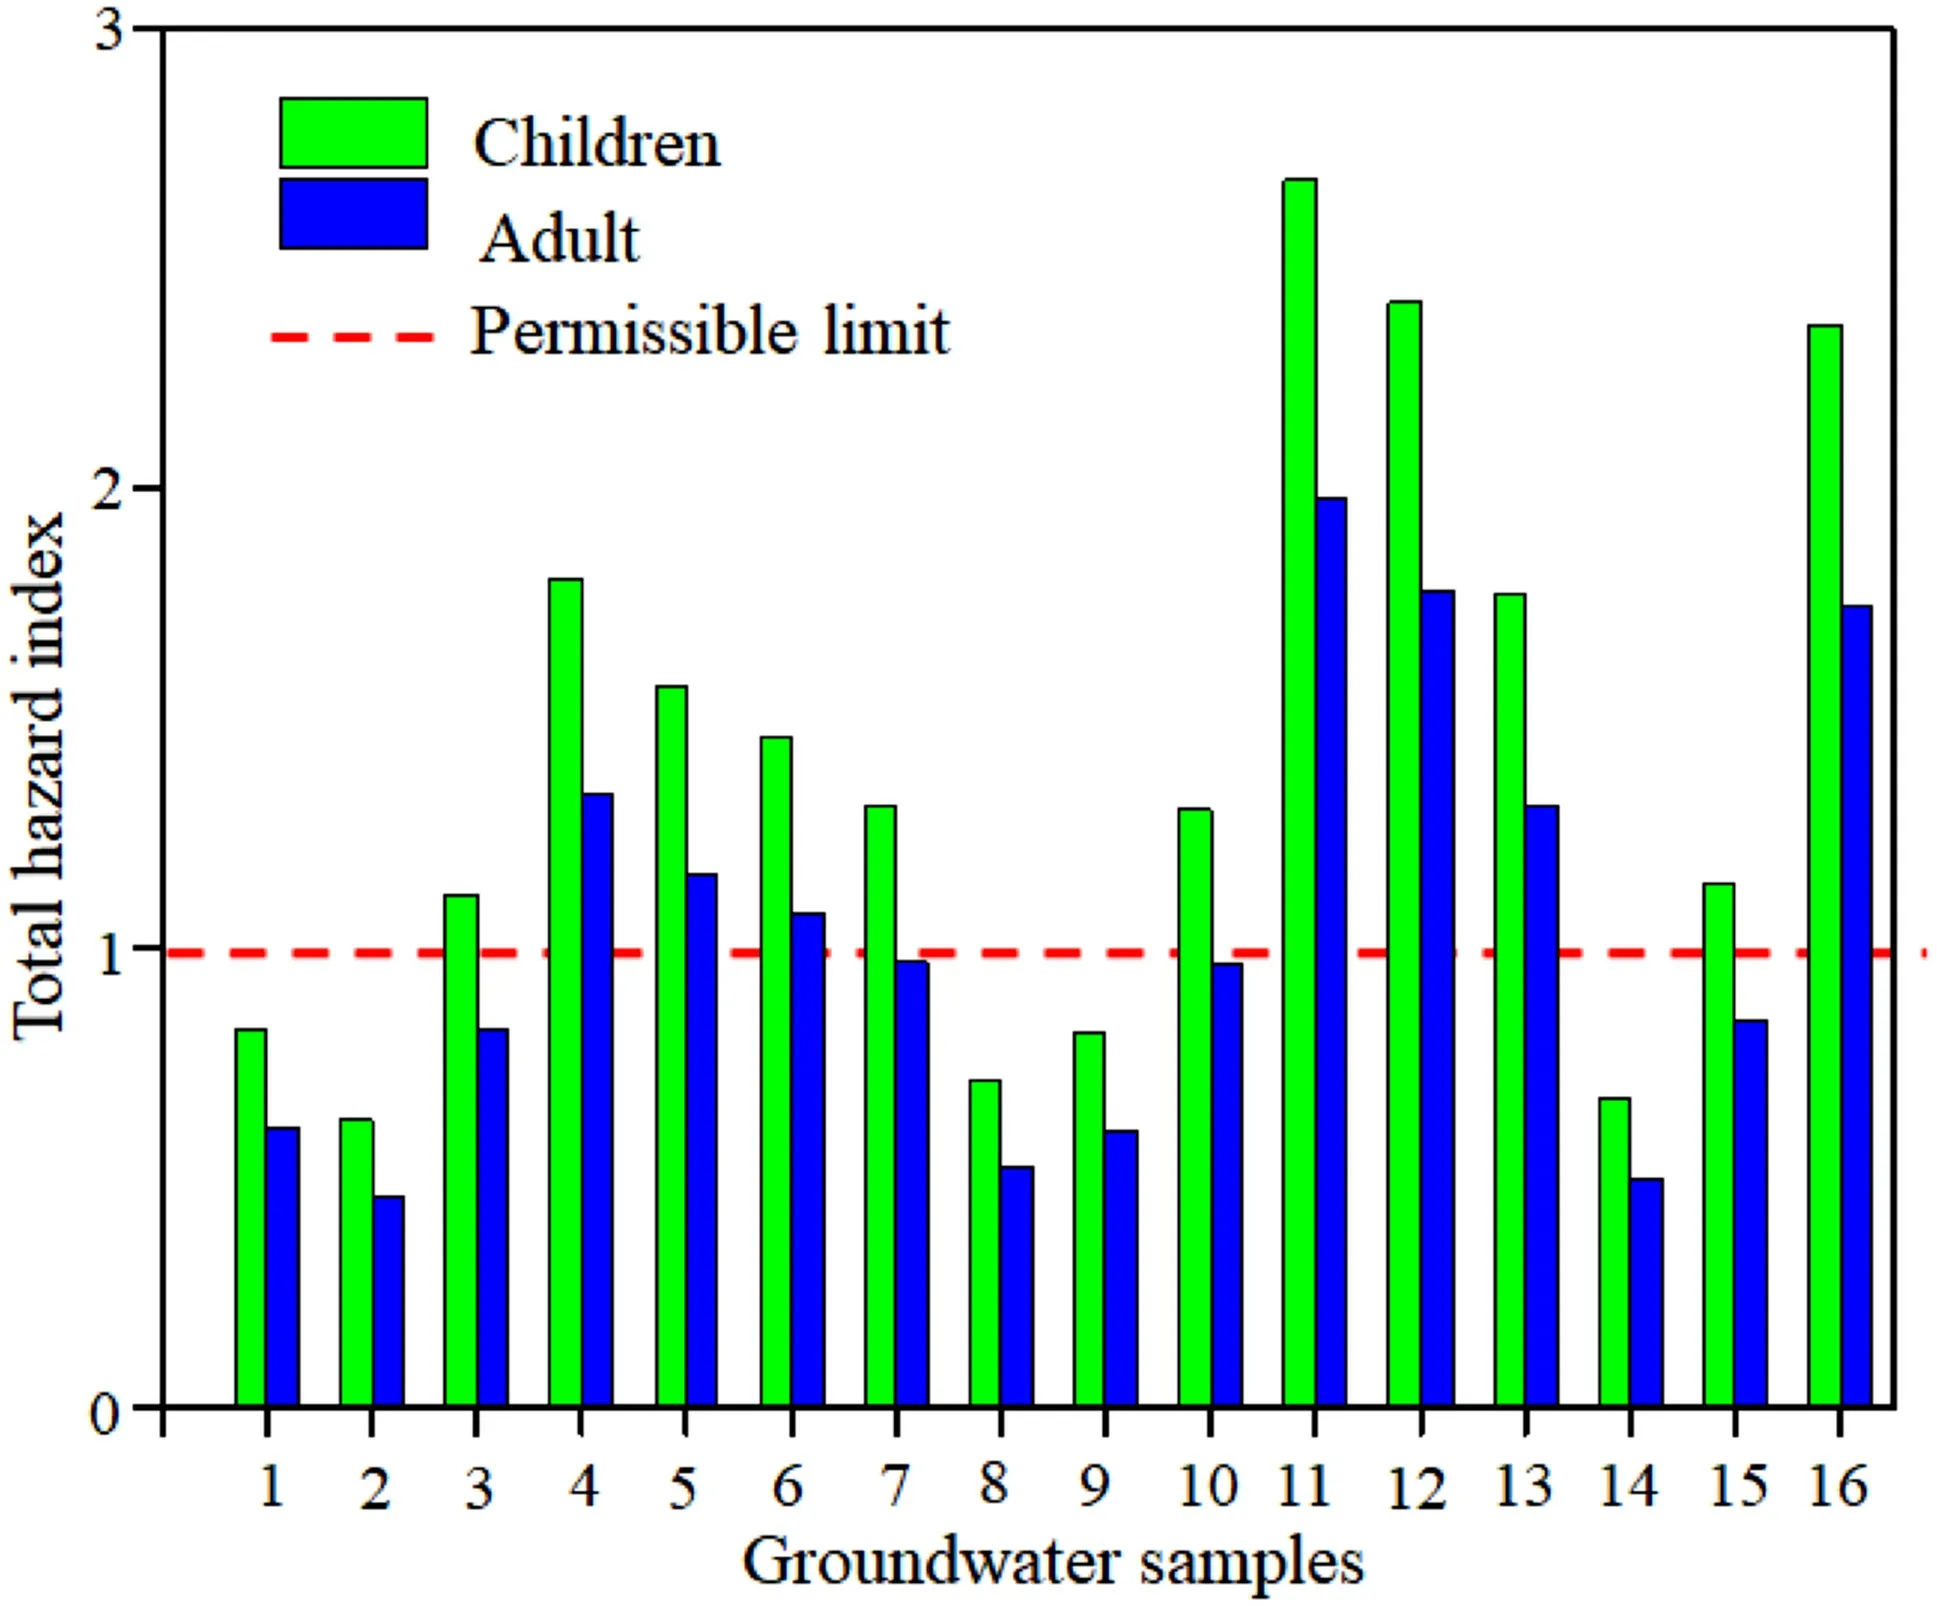
Fig.11 Graphical projection of THI values in adults and children in Unnao
4.5 Evaluation of groundwater for irrigation
The cultivation is a major source of income for the livelihood of the residents of the Unnao.For high crop yield,groundwater quality should be suitable for irrigation,however,the use of poor quality water adversely affects the crop yield as well as soil properties.About 76%of the irrigational purposes are met through groundwater resources in Unnao(CGWB 2013).Thus,the groundwater was evaluated for irrigational suitability in the study area.The computed values of indices and ratios are presented in Table 7,and the categorization/status of groundwater quality for irrigational use is shown in Table 8.
The current investigation area has a high amount of sodium in the groundwater in certain parts which makes the soil alkaline while high salt concentration in groundwater forms the saline soil(Todd and Mays 1980).Both salinity and sodium hazards originate from saline and alkaline soils,respectively.Therefore,the sodium absorption ratio(SAR)is calculated using Eq.6,which signif ies sodium hazards,while EC values refers to salinity hazards in groundwater.SAR values ranged between 0.5 and 7.3 with 2.6 mean value in Unnao(Table 7).The United States salinity laboratory (USSL)diagram (Richards 1954)between EC versus SAR has 16 different classes to show the suitability of groundwater for irrigational use(Fig.14).It indicates that about 56.25%of groundwater samples are of C2-S1 class,suggesting moderate salinity hazards and low sodium hazards.About 25%of the samples are of C3-S1 class,which indicates high salinity hazard and low sodium hazard,while about 6.25%and 12.5%of the samples are of C3-S2 and C4-S2 class,respectively(Fig.14).The continuous use of this type of groundwater(C3-S1,C3-S2,and C4-S2)may affect the plant growth,includes osmotic effects,specif ic ion toxicity,and nutritional disorders(La¨uchli and Epstein 1990;Hanson et al.2006).
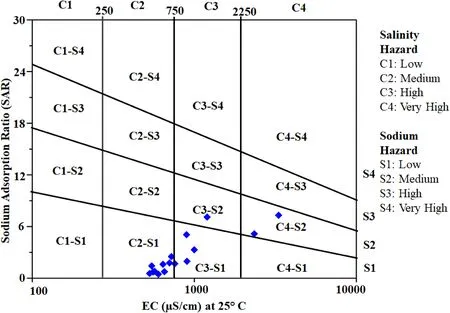
Fig.14 USSL diagram;EC vs SAR
Typically,carbonate and bicarbonate ions are important in irrigation water as Caand Mgcarbonate and tend to precipitate in the soil which benef its the crop in growth(Richard 1954).However,the absorption of high sodium content by soil particles from water,and reduction of Mgand Caions from the soil,decreases the inf iltration rate,hydraulic conductivity,structural stability of soil,aeration and permeability(Eaton 1950).Due to these poor physical properties of the soil,the formation of sodic soil begins,and as a result crop productivity decreases.Therefore,RSC has been estimated using Eq.7.The mean of RSC values is-0.7 and varied between-7.4 and 7.4 in the current study area(Table 7).Eaton(1950)categorization based on RSC values suggests that about 87.5%of the samples(Table 8)have a good water quality for irrigational use.However,around 6.25%of the samples(Table 8)are doubtful whileabout 6.25%are unsuitable for irrigational use.

Parameter Range Category/status(sample number) No.of samples Percent of samples SAR(Richards 1954) 0-10 E(1-16) 16 100 10-18 G – –18-26 D – –>26 U – –EC(Wilcox 1955) <250 E – –250-750 G(3-5,7-10,13,14) 9 56.25 750-2250 P(2,11,12,15,16) 5 31.25>2250 D(1,6) 2 12.5 RSC(Eaton 1950) <1.25 G(1-13,15) 14 87.5 1.25-2.5 D(14) 1 6.25>2.5 U(16) 1 6.25 SSP(Wilcox 1955) <20 E(4,8,10,13) 4 25 20-40 G(3,5,7,9,12,14,15) 7 43.75 40-80 M(1,2,6,11,16) 5 31.25>80 U – –MHR(Szabolcs and Darab 1964) <50 S(4,6,7,10,12,14) 6 37.5>50 U(1-3,5,8,9,11,13,15,16) 10 62.5 KR(Kelly 1957) <1 S(3–5,7–10,12–15) 11 68.75 1-2 M(1,2,6,11) 4 25>2 U(16) 1 6.25%Na(Wilcox 1955) <20 E(4,8,10,13) 4 25 20-40 G(3,7,9,12,14,15) 6 37.5 40-60 P(5,6,11) 3 18.75 60-80 D(1,2,16) 3 18.75>80 U – –PI(Doneen 1964) <80 G(1–16) 16 100 80-100 M – –100-120 P – –PS(Doneen 1964) <3 S(3,4,7-10,13,14,16) 9 56.25>3 U(1,2,5,6,11,12,15) 7 43.75
The groundwater having>50 SSP value indicatesthe occurrence of Naprecipitation in the soil,as a result,soil quality deteriorates(Kadyampakeni et al.2018).Thus,SSP is also an important index for assessing groundwater suitability for irrigational use,calculated using Eq.8.SSP values varied from 12.6 to 74.3 with an average of 36.9 in the study area(Table 7).The SSP categorization of(Wilcox 1955)of groundwater for irrigation,suggests that about 25%of the samples are of excellent type(Table 8).About 43.75%and 31.25%of the samples are of the good and marginal type for irrigational purposes,respectively(Table 8).Further,groundwater containing high amounts of Caand Mgaffects soil quality,however excess Mgin irrigational water has a more adverse effect on crop productivity in comparison to Caions(Szabolcs and Darab 1964).Therefore,Szabolcs and Darab(1964)proposed a ratio to quantify the amount of Mgions as MHR in groundwater,calculated using Eq.9.They reported that the groundwater having>50%MHR value is not suitable for irrigational use.The MHR values range from 25.9 to 68.7 with 51.9 average in the study area(Table 7).Szabolcs and Darab(1964)classif ication of groundwater demarcated that about 37.5%of the samples are suitable while about 62.5%of samples are not suitable for irrigational use(Table 8).Likewise,another criterion KR proposed by Kelly(1957)has been calculated to assessthe water quality for irrigational useusing Eq.10.The KR value ranges from 0.1 to 2.9 with 0.8 mean.Kelly’s classif ication indicated that around 68.75%samples of water are suitable for irrigational use while about 25%and 6.25%samples are marginal and unsuitable for irrigational use,correspondingly(Table 8).
The reduction in permeability of soil is a result of the cation exchange process(between Naand Ca-Mg)between irrigated water and soil,which eventually alters the soil structure(Wilcox 1955).Todd and Mays(1980)suggested that 60%is the maximal limit of%Nain groundwater for irrigation.Therefore,%Nais calculated as an index for evaluating irrigational water suitability using Eq.11.The values of%Naranges between 14 and 74.5 with an average of 37.8 in the region(Table 7).The results of Table 8 suggest that around 25%of the samples are excellent,whereas 37.5%of the samples are good for irrigation,and about 18.75%of the samples are permissible and doubtful for irrigation,respectively.The EC versus%Naplot indicates that,about 56.25%and 18.75%of groundwater samples are of excellent to good and good to permissible for irrigation,respectively(Fig.15).However,about 12.5%of the groundwater samples are of permissible to doubtful while about 6.25%of the samples are doubtful to unsuitable and unsuitable for irrigation use,respectively(Fig.15).
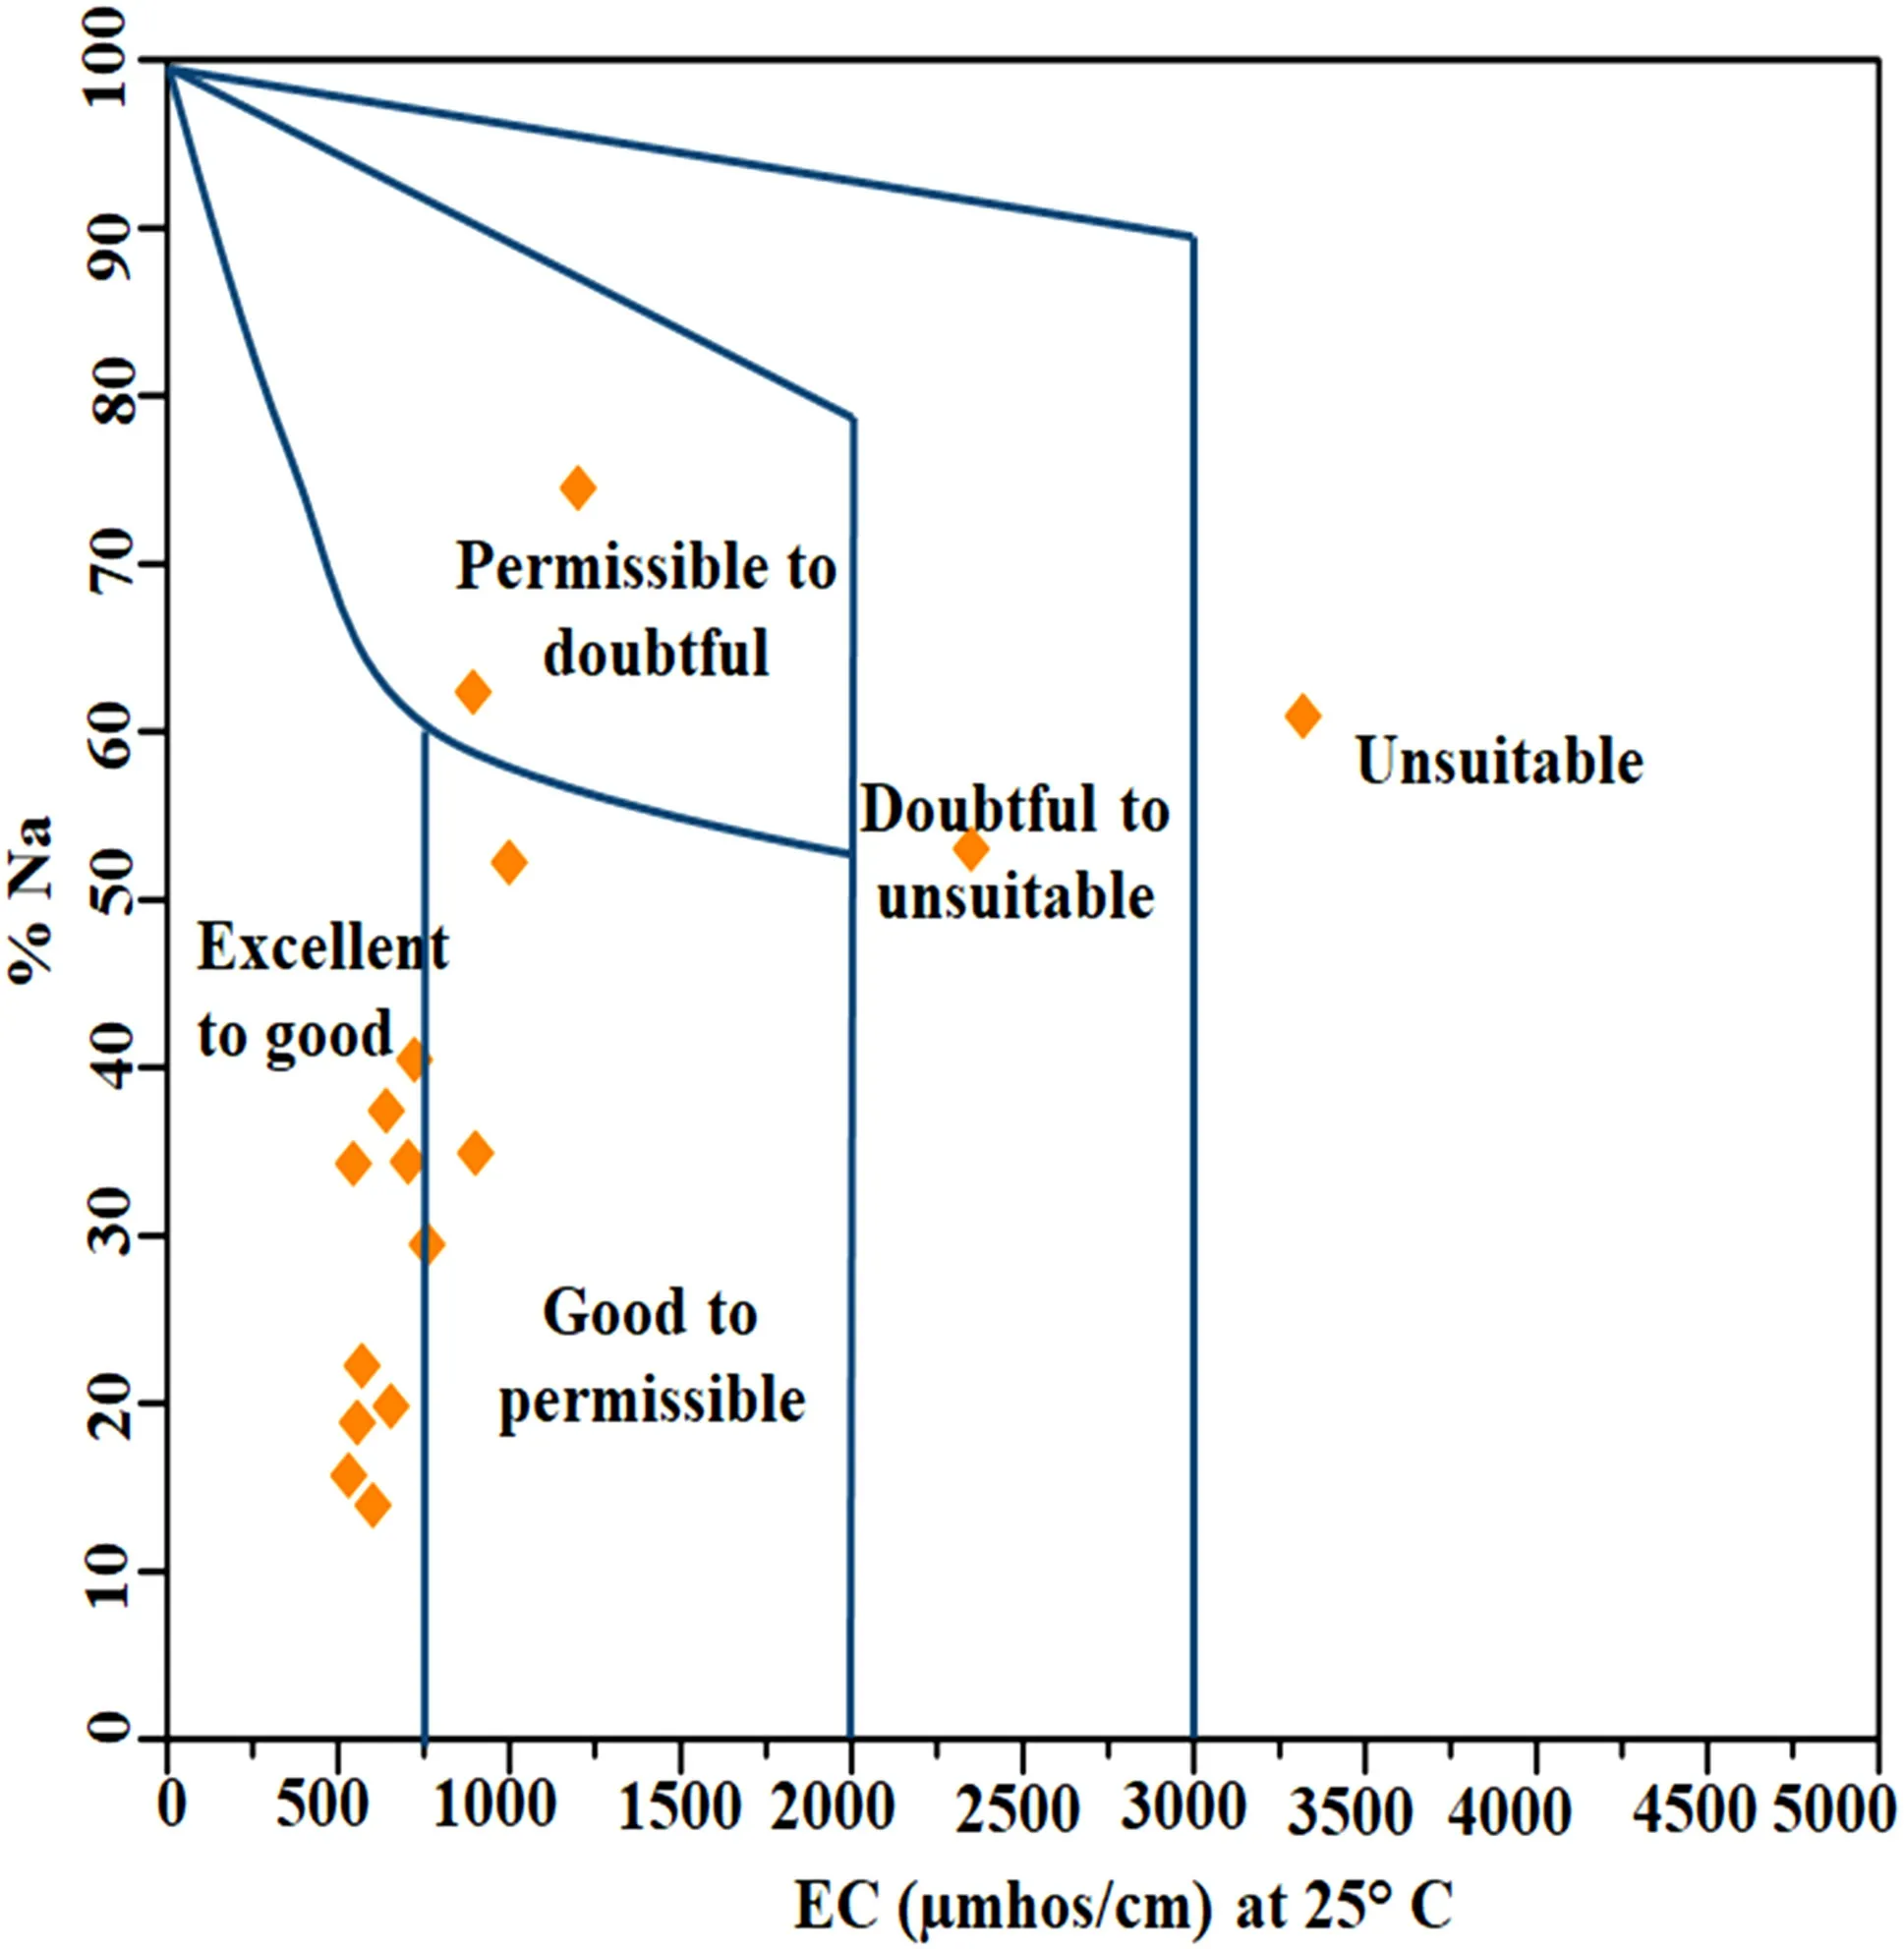
Fig.15 Wilcox plot;EC vs%Na
The maximum permeability of soil brings the development of plants through root water uptake.Therefore,PI is another criterion to appraise the suitability of water for irrigational use,calculated using Eq.12.Doneen(1964)proposed a graph between total ion concentration(TC,meqL)and PI values are very useful to comprehend the groundwater suitability for irrigation.The PI values range between 20.2 and 39.7 with a mean of 30.3 in the study area(Table 7).As per Doneen’s classif ication of groundwater for irrigation suitability,all the samples(100%)are suitable for irrigational use.The plot indicates that about 75%of the samples show maximum permeability(Class I)while about 25%of the samples show 75%of maximum permeability(Class II;Fig.16).Furthermore,potential salinity(PS)is also proposed criterion by Doneen(1964)for evaluating the groundwater quality for irrigational use.As per this criterion,the PS value in groundwater should be<3 for irrigational use.Hence,considering the importance of PS in evaluation of groundwater for irrigation,it has been computed using Eq.13.The mean value of PS is 4.1 and ranges from 0.6 to 16 in the study area(Table 7).About 56.25%of samples show suitability while around 43.75%of samples show unsuitability for irrigational use in the region(Table 8).

Fig.16 Doneen plot;Permeability index(PI)versus total concentration(TC)
5 Conclusion
Groundwater is major and only source for drinking and irrigational use in Unnao.Physio-chemical parameters concentrations in groundwater samples were compared to WHO and BIS standards.The observed data of F,NO,and Feconcentrations of different sites were used to def ine hazard quotient and total hazard index for adults and children.The following conclusions have been brought out from this study:
· The general hydrochemical analysis shows that overall water quality is good for domestic use,except in some samples where high concentrations of Fand Fewere found.The nature of groundwater was alkaline(>7.5)and hard to very-hard type.
· The Gibbs plot revealed that the concentrations of major ions were regulated by host rock-water interaction,especially silicate weathering,whereas the Piper plot indicated that Ca-HCOwas the dominant hydrochemical facies in the area.Durov plot and various bivariate plots indicated that reverse ionexchange processes were predominant in the region.
· Based on the PIG,about 6.25%of samples indicated moderate groundwater pollution,while 6.25%of samples revealed high pollution,towards the east southern and northwestern regions of Unnao.
· Based on the,SAR,RSC,PI,and PS revealed that 100%,87.5%,100%,and about 56.25%of the samples were suitable for irrigation use,respectively,while as per MHR,only 37.5%of the samples were suitable for irrigational use.
· The USSL diagram indicated that only 56.25%of groundwater samples were suitable for irrigation without any salinity control measures.The Wilcox plot suggested that about 56.25% and 18.75% of the groundwater samples were of excellent to good and good to permissible for irrigation,respectively.The Doneen plot suggested that 75%of the samples were maximum permeable while the remaining 25%of the samples were 75%permeable for irrigation use.
Acknowledgement
The Technical Education Quality Improvement Programe(TEQIP),phase I and II are duly acknowledged for providing scholarship during the work.Compliance with ethical standards
Conf lict of interest
The authors declare that they have no known conf lict of interest.杂志排行
Acta Geochimica的其它文章
- Validating the deep time carbonate carbon isotope records:effect of benthic f lux on seaf loor carbonate
- Petrology and geochemical framework of dolerites dykes of Temte´,North Cameroon,Central Africa
- Interaction of Ca2+and soil humic acid characterized by a joint experimental platform of potentiometric titration,UV-visible spectroscopy,and f luorescence spectroscopy
- Trace and rare earth element geochemistry of the black and grey shales of the Calabar Flank,Southeastern Nigeria:constraints on the depositional environment and the degree of metal enrichment
- Geochronological and geochemical comparison of Precambrian meta-maf ic volcanics in Zhongtiaoshan and Lu¨liangshan Regions in Shanxi,North China Craton
- Mineralogy and geochemistry of sands of the lower course of the Sanaga River,Cameroon:implications for weathering,provenance,and tectonic setting
