Mineralogy and geochemistry of sands of the lower course of the Sanaga River,Cameroon:implications for weathering,provenance,and tectonic setting
2021-07-02MarieThereseNangaBineliVincentLaurentOnanaSylvieDesireNoaTangYvesRobertBikoyGeorgesEmmanuelEkodeck
Marie The´re`se Nanga Bineli·Vincent Laurent Onana·Sylvie De´sire´e Noa Tang·Yves Robert Bikoy·Georges Emmanuel Ekodeck
Abstract This study focuses on the mineralogy and bulk chemical composition of 19 sediment samples,collected from the Sanaga River bed,between Nanga-Eboko and the Atlantic Ocean in Cameroon,to infer provenance,weathering,and tectonic setting.The textural analysis revealed that these sediments are mainly coarse-grained sands.X-ray diffraction and heavy mineral analyses show that these sands are made of quartz,microcline,plagioclase,muscovite,ilmenite,anatase,magnetite,opaques,and epidote.The Index of Chemical Variability values(1.07–2.68)indicates that the sands are immature.The Chemical Index of Alteration(53–66%),Plagioclase Index of Alteration(PIA;57–75%),and Maf ic Index of Alteration(54–67%)values revealed a moderate intensity of weathering for these sediments.According to the compositional maturity diagram,the sands are mainly litharenites.The studied sands show enrichment in light rare earth elements relative to heavy rare earth elements and a negative anomaly in Eu(Eu/Eu*=0.32–0.83).These sands were derived from felsic metamorphic rocks dated Meso to Neoproterozoic from the Pan-African (700–1000 Ma)domain of south Cameroon.Th/U ratios(mean=5.40;n=19)reveal that these sands originating from felsic source rocks and are low to moderately recycled.On the tectonic discrimination diagrams,all the samples are plotted in the rift and passive margin domains,which is consistent with the tectonic history of Pan African in southern Cameroon.
Keywords Central Africa·Sanaga River sediments·Heavy minerals·Major and trace elements·Source rocks·Rift and passive setting
1 Introduction
Rivers are natural f lowing watercourses that carry eroded materials from continental areas to oceans and seas.The sediments they transport make it possible to understand evolution processes at the continental interface.Rivers cover large parts of continental surfaces and constitute geological and environmental records of the tectonic and climatic conditions in a river basin.The textural and mineralogical changes induced by weathering and fractionation phenomena during sedimentary processes lead to geochemical heterogeneity of river sediments during their genesis,transport,and deposition within sedimentary basins.However,geochemical data of river sediments are of high importance for the study of provenance,weathering,climate change,and continental crust(Maharana et al.2018).For decades,the origin of the sediments and the mechanisms that contribute to their deposition has been the subject of numerous works(Bhuiyan et al.2011;Armstrong-Altrin et al.2015;Bhaskar et al.2015;Garzanti and Resentini 2016;Silva et al.2016;Maharana et al.2018).The above mentioned have demonstrated that immobile and rare earth elements are generally concentrated in the f ine fraction of sediments,in primary accessory minerals(e.g.apatite,zircon)and some secondary minerals like kaolinite(Bhuiyan et al.2011).Rare-earth element concentrations in sediments depend on the geochemical composition of the source rocks.Trace elements such as Y,Th,Zr,Hf,Nb,Sc,Co,and Cr are considered to be good tracers for identifying the provenance of sediments(Armstrong-Altrin et al.2015;Herna´ndez-Hinojosa et al.2018;Ramoz-Va´squez and Armstrong-Altrin 2019).Grain size is the most important factor for controlling variability and sediment composition(Garzanti et al.2011;Basu 1976 in von Eynatten et al.2016).In Central Africa,studies have been carried out on river sediment deposits and corroborated the key results obtained in other geographical areas in the world (Ndome et al. 2014; Ndjigui et al.2014,2015,2018;Mbale et al.2019).Central Africa is a region of the world where the hydrographical network is dense and highly dissected,and where large rivers are observed,like the Sanaga River in Cameroon.The sediments of this river have been the subject of little study.This river,which is 920 km long,runs along an E-W shear zone materialized by a fault called‘‘Sanaga Fault;SF’’.In Central Africa,the Sanaga watershed is the largest fully Cameroonian river basin(Dzana et al.2010).With an area of 133 000 km,this river basin covers about 25%of Cameroon’s surface area(Sangen et al.2010)and is drained by the Sanaga River which,due to its hydroelectric potential,is the second important river after the Congo River(4700 km),in Central Africa.The Sanaga River which drains almost a quarter(65,000 km/year)of water resources(Dzana et al.2010)of Cameroon undergoes an intense sand extraction activity. Approximately 600,000 mof sand is extracted each year from the bed of this river(Dzana et al.2010).Nevertheless,studies on sediments from river beds in Central Africa are scarce(Silva et al.2016).These studies will also help to understand the processes that control their composition,to know the geological and environmental information they have archived.This study aims to determine the origin,degree of weathering,and tectonic environment of the Sanaga River sediments,from mineralogical data,as well as major and trace element concentrations.
2 Study area
The study area is located in the Sanaga watershed,and it corresponds to the Sanaga River bed,between Nanga-Eboko and the Atlantic Ocean(Fig.1).The current climate is of tropical type with two seasons in the upper course of the Sanaga River and of equatorial type in its lower course.The rainfall in this watershed is between 1400 and 4000 mm(Ndam Ngoupayou et al.2016).The studied sediments are bed sands of the Sanaga River that f lows along the SF.This SSW-NNE-oriented fault occurred in the Proterozoic during the Pan-African orogeny(Ndougsa-Mbarga et al.2012;Regard et al.,2016;Ngapna et al.,2018;Messanga et al.2019)and is subject to post-Pan African reactivations(Moussango et al.2018).It is one of the main mega-structures in Central Africa that strongly inf luences the evolution of coastal sedimentary basins in Cameroon(Djomeni et al.2011).The Sanaga River is 920 km long and has three subdivisions from upstream to downstream(Sangen et al.2010).In its upper course,270 km long,Sanaga River is called Djerem.Its source is in the Adamawa plateau,between 1000 and 1200 m above the Atlantic Ocean(Nzeukou et al.2013).The middle course of Sanaga River begins in the Goyoum region,slightly downstream of the conf luence of Lom and Djerem Rivers and extends to Edea.In this part,the Sanaga River f lows over a distance of 583 km and its major tributary is the Mbam River.The Mbam River drains all the western part of the basin and its major tributary is the Noun River.The lower branch of the Sanaga River is relatively short(67 km)and extends from the bottom of the Edea Falls to the Atlantic Ocean.The Sanaga River drains a succession of plateaus limited to the west by the Cameroonian ridge and,to the north,by the Adamawa plateaus.The transition from the plateau area to the coastal plain is materialized by a series of falls and rapids interspersed with low-slope areas.The Sanaga watershed rests entirely on the Precambrian basement,covered in its upper borders by Cretaceous volcanic and towards the Atlantic coast by sediments of the Douala Basin.The Phanerozoic formations of the Douala Basin cap Neoproterozoic gneisses and granitoids(Ngon Ngon et al.2016)which are basement formations of the Sanaga River basin.Panafrican metamorphic include low-grade metamorphics (phyllites,shales,and siliceous facies represented by quartzites generally interbedded in shales)of the Lom series at the northeastern extremity of the Sanaga River basin and the medium to high-grade gneissic rocks of the Yaounde group.Granitic gneisses are most typical of the Panafrican basement of West Cameroon and Adamawa parts of the Sanaga river basin.

Fig.1 Geology map of study area showing sample location(after Tchakounte´et al.2017)
3 Materials and methods
The length of the lower course Sanaga River for this study is about 429 km between Nanga-Eboko and the Atlantic Ocean.The different sampling points are 25 km apart along the river.Seventeen sand samples were collected in the Sanaga River(Fig.2).Nine samples are located in the South Cameroonian Plateau domain and eight in the coastal plain area.Two samples were collected in the major tributaries of the Sanaga River,which are Mbam and Ndje´ke´Rivers,in the South Cameroonian Plateau(Fig.2).All the studied samples were collected in the active channel of rivers using a sampler to prevent the f ine fraction from being lost in the collection.These samples were dried in an oven at a temperature of 70°C for 24 h at the Engineering Geology Laboratory of the University of Yaounde´I.After drying,the bulk samples were homogenized and subjected to a grain size analysis according to NF P94-068 standard(AFNOR 1998)at the National Laboratory of Civil Engineering(LABOGENIE)and to mineralogical and geochemical analyses.Samples selected for mineralogical and geochemical analyses were sieved and only the fraction of sandØ<2000μm in diameter was immersed in hydrogen peroxide(HO)for 24 h to eliminate the organic matter.

Fig.2 Longitudinal prof ile of the Sanaga River
The organic matter extracted,samples were parboiled again for 24 h before being crushed at the Engineering Geology Laboratory of the University of Yaounde´I.The powders obtained with a diameter<80μm,were subjected to mineralogical analyses at the Geosciences Laboratories of the Ontario Geological Survey in Sudbury,Canada.Mineralogical analyses were performed by X-ray diffraction using Co radiation X-ray diffractometer at 40 kV and 45 mA.Semi-quantitative analyses were carried out according to the method described by Yvon et al.(1982).The extraction of heavy minerals was performed on the 200–125μm fraction according to the method described by Duplaix(1958)and Parfenoff et al.(1970).Major element concentrations were determined by X-ray f luorescence(XRF-M01)at the Geosciences Laboratories of the Ontario Geological Survey in Sudbury(Canada).Samples were f irst heated at 110°C for 6 h and melted with lithium tetraborate before being analyzed using analytical PAN AXIOS Advanced PW 4400.The International Reference Material(INTL)used is SY-4 and the in-house standard(IHST)is QS-1.The relative error varies between 0.2 and 2%.Concentrations of trace elements were determined by mass spectrometry using Perkin Elmer Elan 9000 ICP-MS.The analysis was carried out according to the IMC-100 method.The INTL used was GSP-2 and the IHST was MRB-29.Zirconium data were determined by X-ray f luorescence(XRF-M02)in some samples(SA22,SA23,SA25,SA28,SA30,SA33,and ND)because its concentrations were higher than the detection limit(1450 ppm)in the ICP-MS analysis.The relative error varies between 0.007 and 10%.
4 Results
4.1 Texture and mineralogy
The mean grain size(Mz)values range from-0.85 to 2.12 φ.Seventy-four percent of the studied sediments are coarse-grained sands(-0.85 to 0.74φ),16%represent medium-grained(1.03 to 1.32φ)sands,and 10%are f inegrained sands(2.06 to 2.12φ;Table 1).
These sands consist of quartz,microcline,plagioclases,muscovite,ilmenite,anatase,and magnetite(Table 1).The proportions are high in quartz(69–87 wt.%),moderate in microcline(9–15 wt.%),and low in plagioclases(~4 wt.%),muscovite(~3 wt.%),ilmenite(~2 wt.%),anatase,and magnetite(~1 wt.%).Heavy minerals(Table 2)are mainly opaques(~50 wt.%)and epidote(~20 wt.%).Garnet,kyanite,sillimanite,zoisite,tourmaline,zircon,and augite are in low proportions(2–10 wt.%),while proportions in apatite,andalusite,diopside,staurolite hornblende,peridot,and clinozoisite are very low(~1 wt.%).
4.2 Geochemistry
4.2.1 Major element concentrations
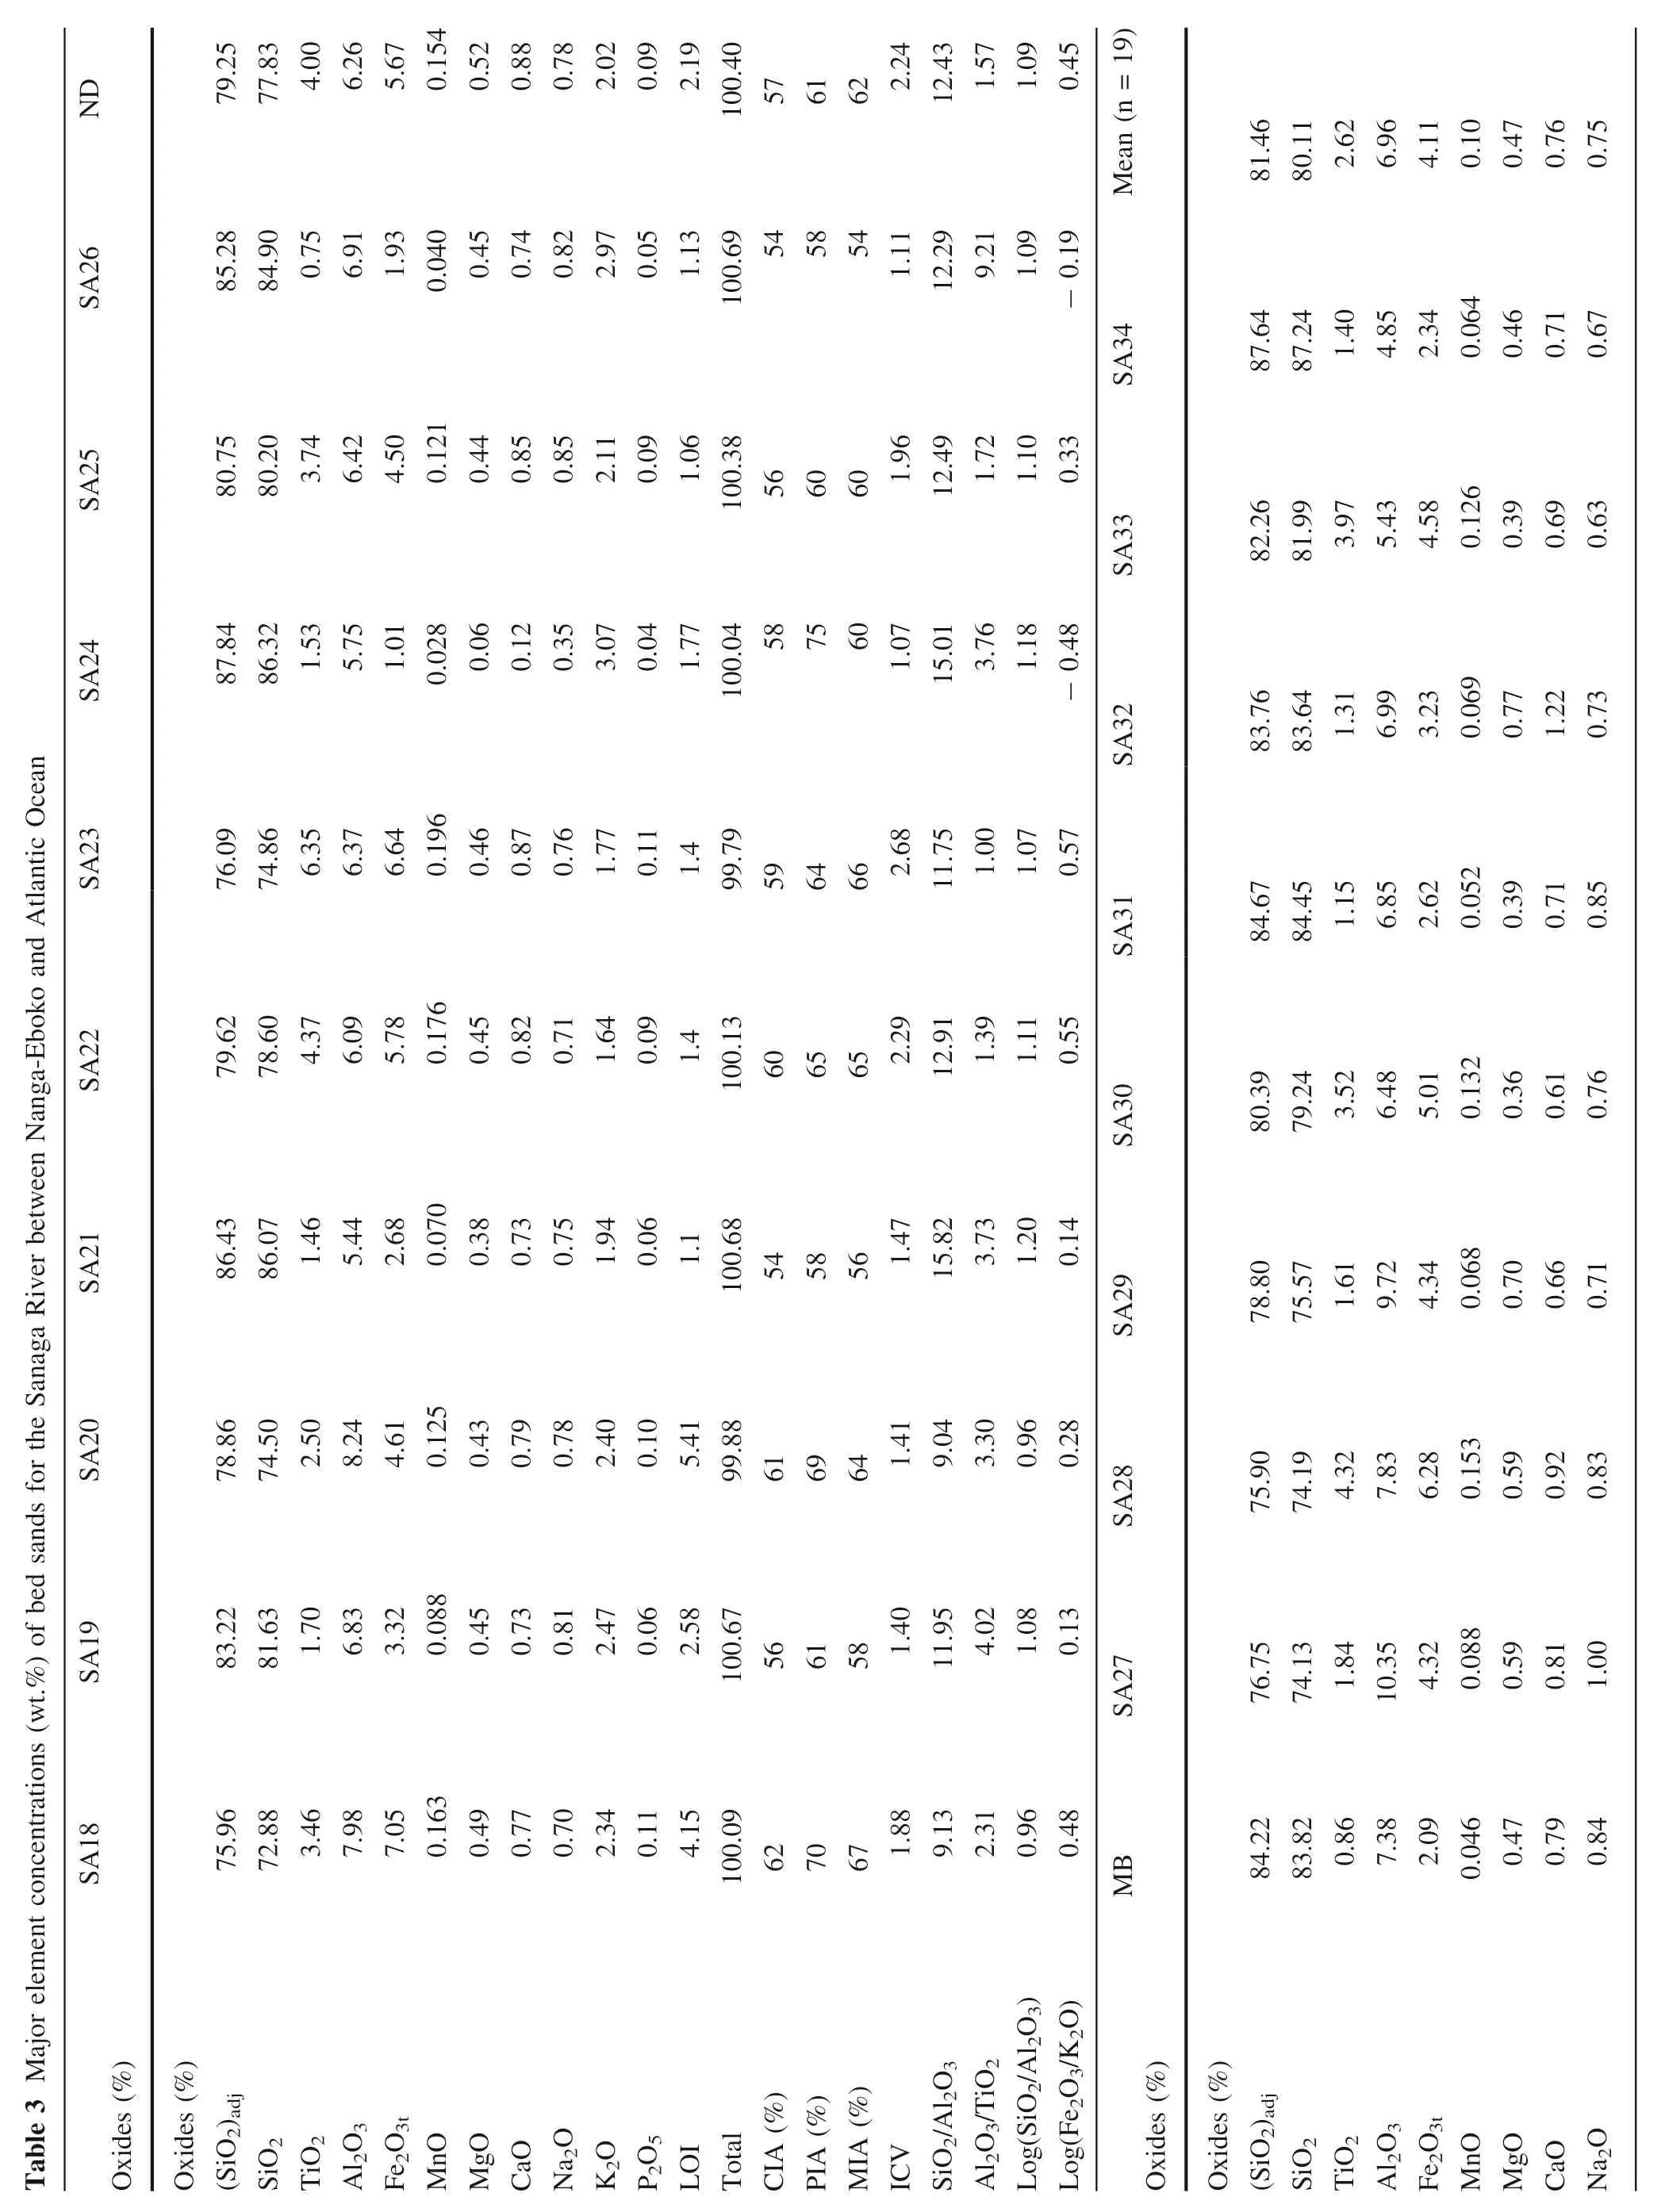
Major element concentrations are listed in Table 3.The studied sands are characterized by high SiOconcentrations(72.88–87.24 wt.%).The concentrations of AlO(4.85–10.35 wt.%)and FeO(1.01–7.05 wt%)are low to moderate.KO(1.64–3.38 wt.%),TiO(0.75–6.35 wt.%),and LOI(0.74–4.4 wt.%)concentrations are relatively low while those in MgO,CaO,NaO,and MnO are also very low(<1.00 wt.%).SiOand KO concentrations are similar to those of UCC while FeOconcentrations are highly variable and different(Rudnick and Gao 2003;Fig.3).The studied sands are enriched in TiOand MnO with respect to UCC and depleted in AlO,MgO,CaO,NaO,and PO.According to the compositional maturity diagram of Herron (1988),the studied sands are classif ied as litharenites(Fig.4)
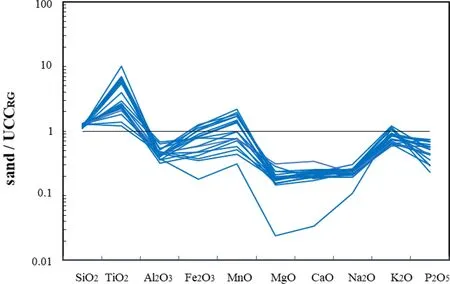
Fig.3 Multi-element diagram for major element concentrations for the Sanaga River bed sands between Nanga-Eboko and Atlantic Ocean normalized against UCC(after Rudnick and Gao 2003)
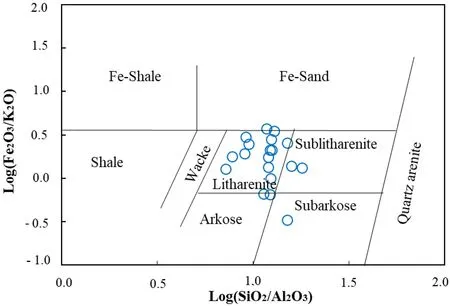
Fig.4 Geochemical classif ication for the Sanaga River bed sands using log(SiO2/Al2O3)-log(Fe2O3/K 2O)diagram(after Herron 1988)
4.2.2 Trace element concentrations
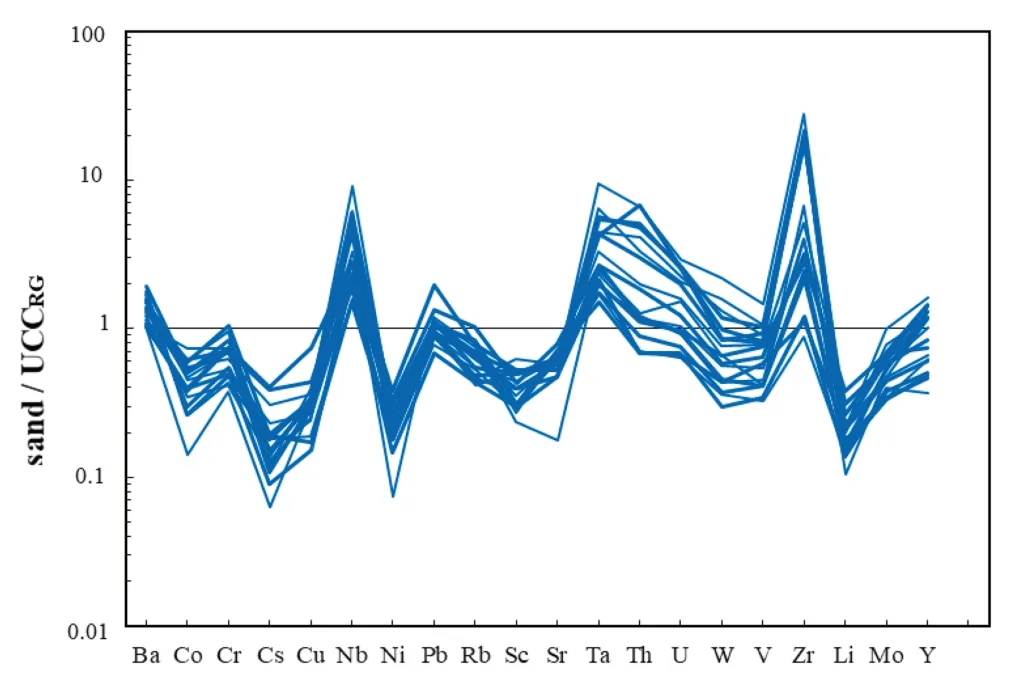
Trace element concentrations are shown in Table 4.Trace element patterns normalized with respect to UCC(Rudnick and Gao 2003;Fig.5)show enrichment in Ba,Nb,Ta,Th,U,and Zr,and depletion in Co,Cr,Cs,Cu,Ni,Pb,Rb,Sc,Sr,Li,and Mo.Some trace elements such as W,V,and Y exhibit a contrasting behaviour;some materials are enriched in these elements while others are depleted.TiOand FeOare strongly linked(r=0.85,n=19).Strong statistical correlations exist between POand U,Nb,Mo(r=0.72,0.71,0.83,respectively,n=19).Some transition metals such as Cr,V,Co,and Sc are closely related to TiO(r=0.77,0.94,0.72,0.70,respectively,n=19)and FeO(r=0.91,0.94,0.92,0.76,respectively,n=19)as well as with PO(r=0.85,0.90,0.89,0.79,respectively,n=19).
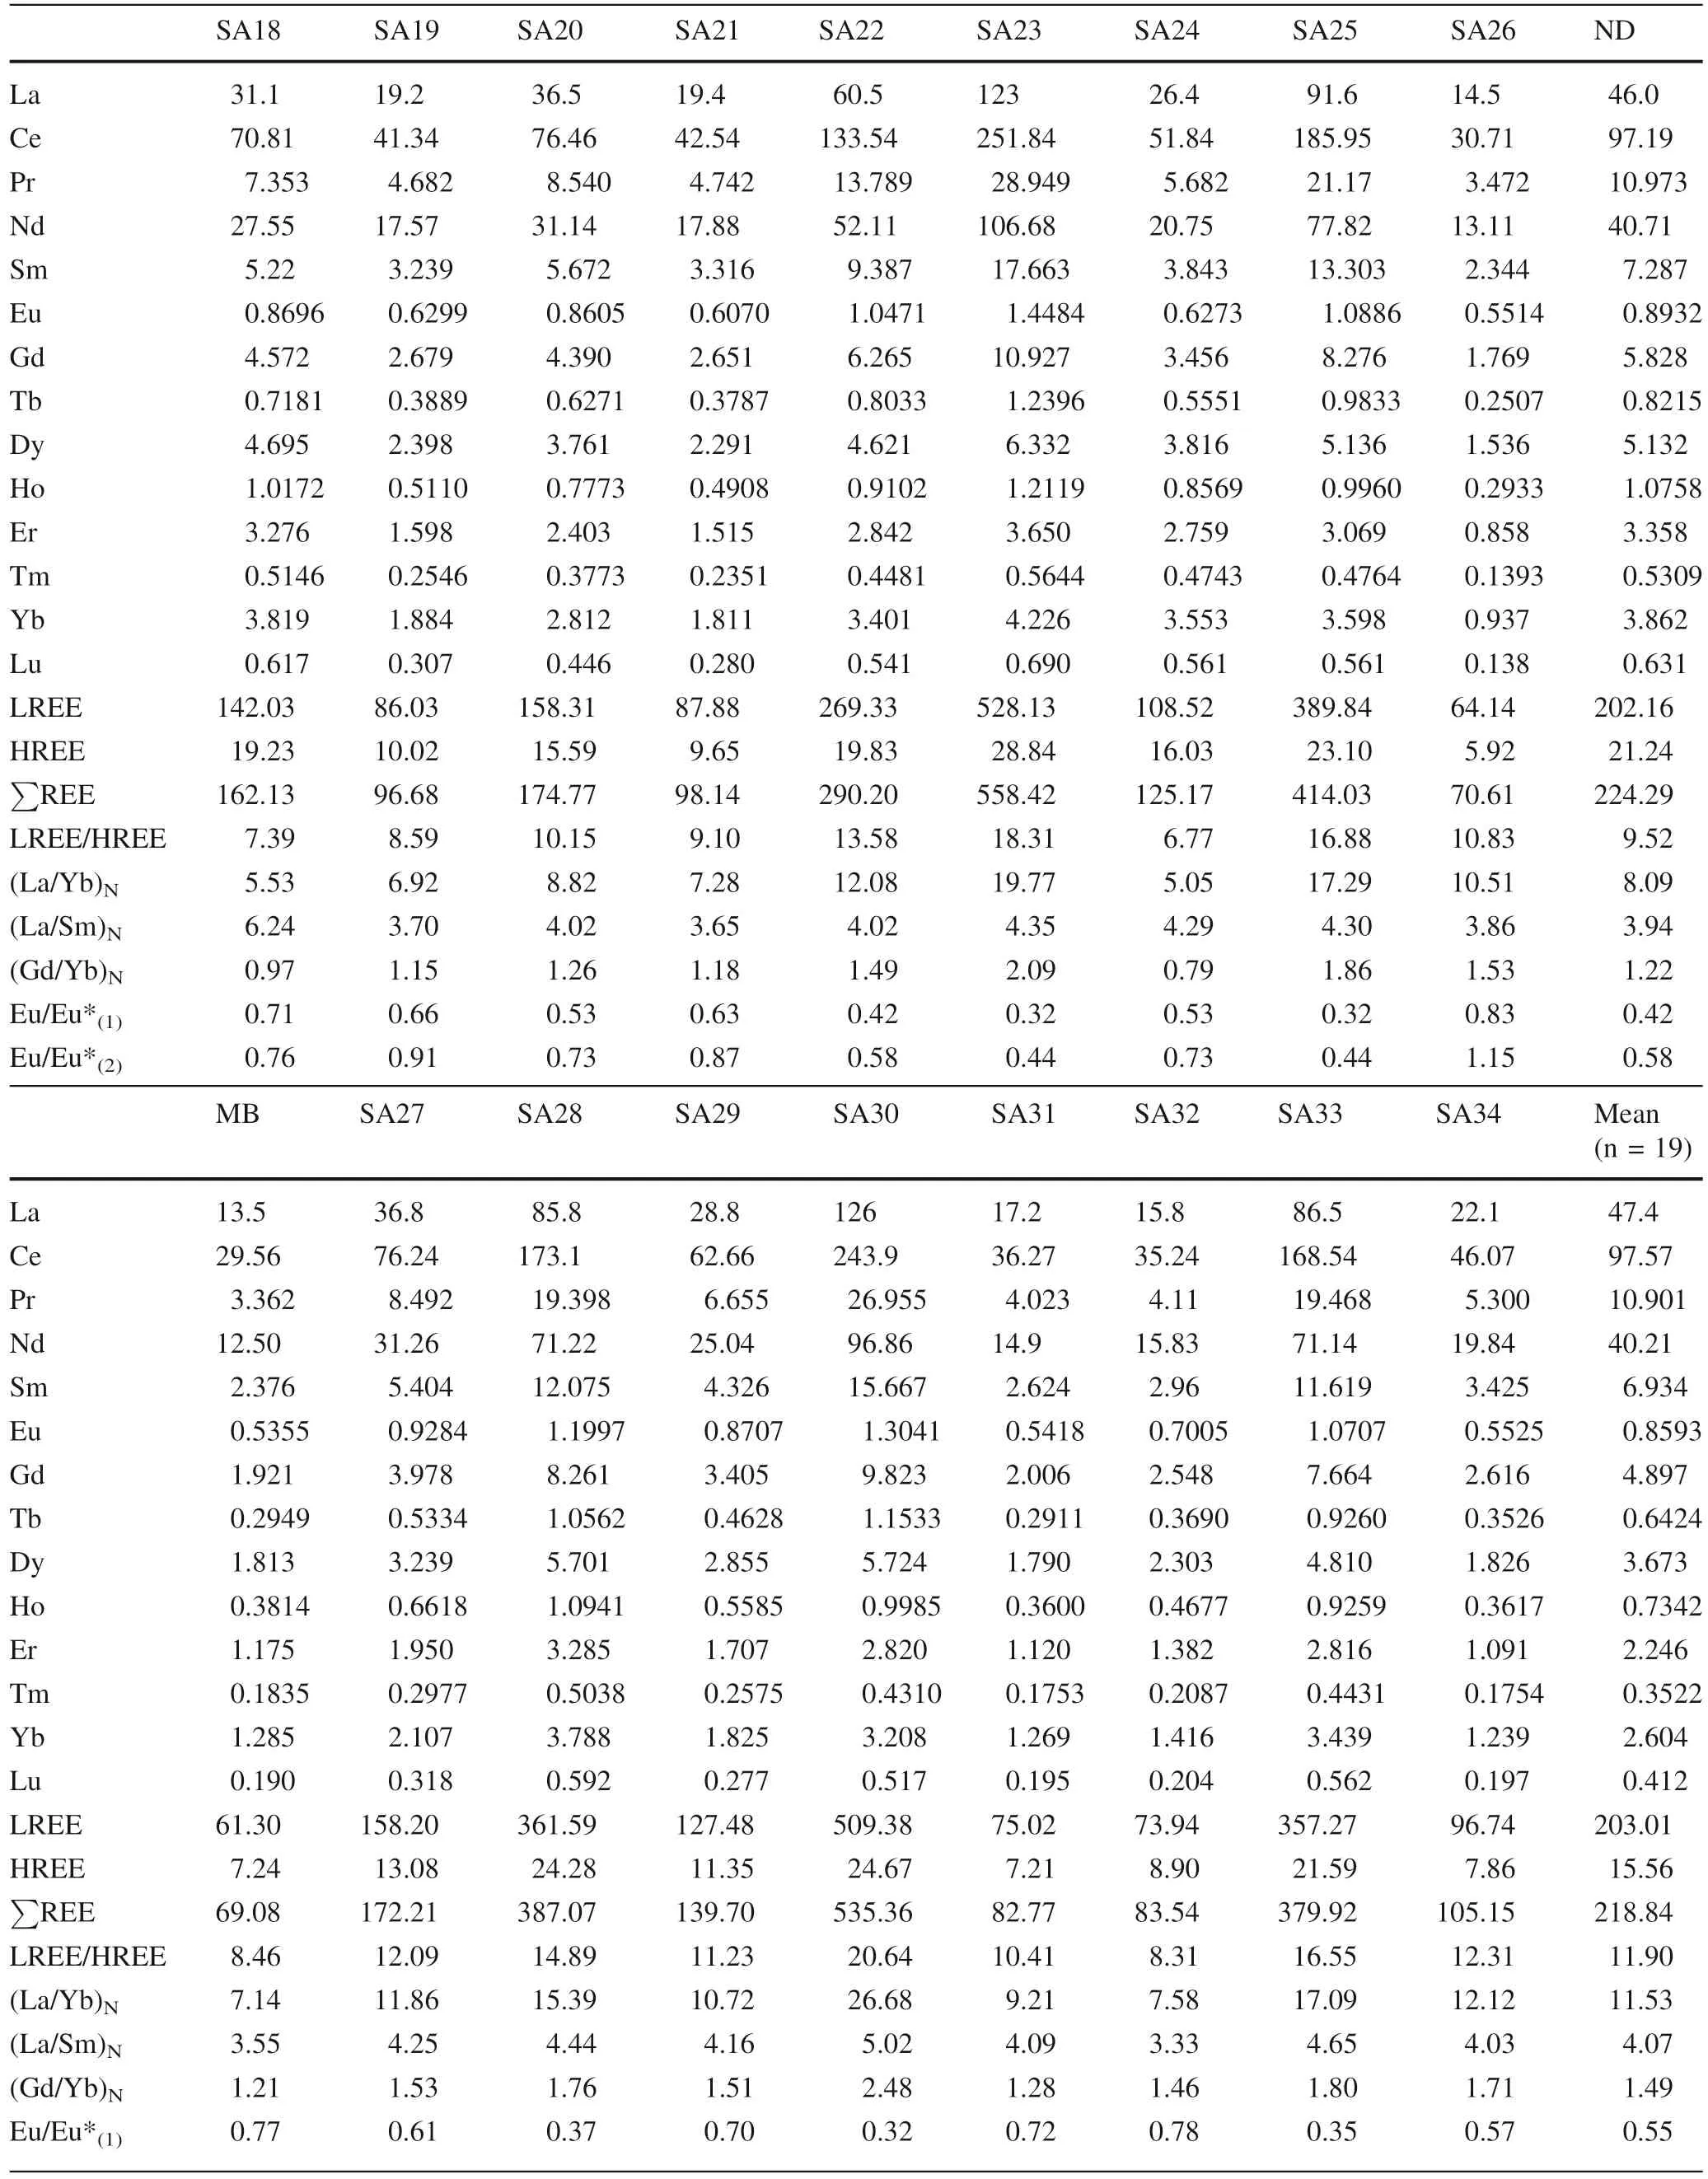
4.2.3 Rare earth element(REE)concentrations
REE concentrations are shown in Table 5.REE concentrations range between 69 and 558 ppm.LREE/HREE ratios range between 6.77 and 20.64.(La/Yb)values oscillate between 5.05 and 26.68.REE patterns normalized with respect to chondrite show negative Eu anomalies(Eu/Eu*=0.32–0.83;Fig.6a).These Eu anomalies are also observed in REE patterns normalized with respect to UCC(Rudnick and Gao 2003;Fig.6b).REE patterns(Figs.7,8)also indicate the existence of 02 groups of sands,the REEenriched sands with relatively strong Eu anomalies(Eu/Eu*=0.32–0.42)and the REE-depleted sands with medium to weak Eu anomalies(Eu/Eu*=0.53–0.83).REEenriched sands(∑REE:161–556 ppm;SA 18,SA 20,SA 22,SA 23,SA 25,SA 27,SA 28,SA 30,SA 33,and ND)have the highest TiO(1.84–6.35 wt.%),FeO(4.32–7.05 wt.%),and Zr(618–5330 ppm)contents.The average TiO,FeO,and Zr contents in these sands are 3.81,5.44 wt.%,and 3090 ppm,respectively.REE-depleted sands(∑REE:68–138 ppm;SA 19,SA 21,SA 24,SA 26,SA 29,SA 31,SA 32,SA 34,and MB)have lower TiO(0.75–1.70 wt.%),FeO(1.01–4.34 wt.%),and Zr(171–784 ppm)contents,except for sample SA 24 which has a relatively high Zr content(1224 ppm).The average TiO,FeO,and Zr contents in these sands are 1.31 wt.%,2.62 wt.%,and 536 ppm,respectively.REE-enriched materials have,therefore,the highest TiO,FeO,and Zr contents.

Fig.6 Chondrite-normalized REE distribution patterns(after McDonough and Sun 1995)a and UCC-normalized REE distribution patterns(after Rudnick and Gao 2003)for the lower course of Sanaga River bed sands between Nanga-Eboko and Atlantic Ocean

Table1Mineralogicalcomposition(%)andgrainsizedataofbedsandsfortheSanagaRiverbetweenNanga-EbokoandAtlanticOcean Mean(n=19)78104231198 10.90 89.08 0.02 0.46 SA34 8738111.85 1.03––10078.18 19.97 SA33 83 9 3 3 3––10015.30 69.25 15.45 1.12 SA32 83 3 9 2 2 1–99 0.60 99.40 0.00 0.74 SA31 8410212––9910.45 89.55 0.00 0.30 SA3075 1431497 0.53––17.50 81.97-0.26 SA29 7313542––960.80 98.63 0.57 0.69 SA28 77 123 24–199 5.50 94.39 0.11 0.06 SA27 6915633–2984.20 95.63 0.17 0.15 MB 7512431––950.35 99.65 0.00 2.12 75 1161599 ND 0.05––21.45 78.50-0.29 SA26 78112331–990.05 99.95 0.00 2.06 SA25 77 105 33––97 6.55 93.45 0.00 0.51 SA24 828114––970.45 97.26 2.29 1.32 SA23809413299 0.14–17.80 82.06-0.25 SA2281 9 43 298 0.32–23.15 76.53-0.41 SA21 8582211–990.85 99.12 0.03 0.51 SA207611 5 1 3 0~0.4197 17.00 82.68 0.32-0.33 SA19 77114441~0.52 1003.75 96.09 0.16 0.43 SA18708523492 0.01–14.60 85.39-0.85 Quartz Microcline Plagioclase Muscovite Ilmenite Anatase Magnetite Total Gravel Sand Fines Mz Gravel(4–2mm),Sand(2–0.0625mm),Fines(<0.0625mm),afterWentworth(1922);Mz:meangrainsize(inφunits)
5 Discussion
5.1 Sediment maturity and recycling
The index of compositional variability(ICV=[(CaO+KO+NaO+FeO+MgO+MnO+TiO)/AlO];Cox et al.,1995)has been extensively used in many works to assess the sediment composition or to estimate the original composition of sediments(Armstrong-Altrin et al.2015;Rosales-Hoz et al.2017;Tawf ik et al.2017;Armstrong-Altrin et al.2018;Maharana et al.2018;Ndjigui et al.2018,2019).The ICV values above 0.85(Post-Archean Australian Shale value)indicate immature sediments,while values below 0.85 characterize mature sediments(Purevjav and Roser 2013).Similarly,ICV values below 1 indicate the presence of clay minerals,while values greater than 1 indicate the presence of feldspars,amphiboles,and pyroxenes in rocks(Cox et al.1995).The studied sands have ICV values between 1.07 and 2.68(Table 3a).These high ICV and CIA values indicate that these sands are immature(Fig.7).The high TiOconcentrations relative to UCC corroborate the presence of anatase and ilmenite(r=0.85,n=19).Statistically,correlations between SiO,AlO,and LOI indicate that most of SiOis concentrated in quartz and not in feldspars and muscovite.The HFSEs are associated with FeOin ilmenite.Some of these trace elements are present in apatite as indicated by the strong correlations between POand U,Nb,Mo.Chromium,V,Co,and Sc are closely related to TiOand FeOin anatase and ilmenite as well as with POin apatite.These sands still contain minerals from source rocks as indicated by their mineralogy and therefore have undergone low to moderate recycling(Fig.8;Armstrong-Altrin et al.2015,2017;Nagarajan et al.2017;Anaya-Gregorio et al.2018).

Fig.7 ICV versus CIA diagram for the Sanaga River bed sands(after Nesbitt and Young 1984;Cox et al.1995)

Fig.8 Zr/Sc versus Th/Sc bivariate diagram illustrating sediment recycling(McLennan et al.1993)
5.2 Weathering

Mean(n=19)SA34SA33 504220142112121211115 503220–8–10–1–11––––5 483318–10–111––11––––4 SA32SA31 472520–41542113–1––6 502225–2–621–22–––15 SA30 51 12210–8–91–––1–1––5 Table2Concentrationofheavyminerals(%)ofbedsandsfortheSanagaRiverbetweenNanga-EbokoandAtlanticOcean SA29SA28SA27MBNDSA26SA25SA24SA23SA22SA21SA20SA19SA18 573212–4–8211–4––––6 396118–5–1721114––––5 325233–3–151–111––––6 42 3 140–2 1 5 1–––––––1 5 50––20–––105––21111–5 72312–2–15–––1–––––4 43612–––41–1––1––––5 525315–42931–11–1–14 516318–221031–11––––4 515225–4143–––1––––5 4321441–––2–––––––––536–24–4022–1–3––––5 55412205121020300014 551–4–3415318––11215 Opaques Zircon Zoisite Epidote Clinozoisite Garnet Anatase Disthene Sillimanite Andalusite Augite Diopside Tourmaline Apatite Staurotide Peridot Hornblende Undetermined
NDSA26SA25 79.25 77.83 4.00 6.26 5.67 0.154 0.52 0.88 0.78 2.02 0.09 2.19 100.40 5761622.24 12.43 1.57 1.09 0.45 85.28 84.90 0.75 6.91 1.93 0.040 0.45 0.74 0.82 2.97 0.05 1.13 100.69 54 58 54 1.11 12.29 9.21 1.09-0.19 80.75 80.20 3.74 6.42 4.50 0.121 0.44 0.85 0.85 2.11 0.09 1.06 100.38 566060 1.96 12.49 1.72 1.10 0.33 Mean(n=19)SA34SA33 81.46 80.11 2.62 6.96 4.11 0.10 0.47 0.76 0.75 87.64 87.24 1.40 4.85 2.34 0.064 0.46 0.71 0.67 82.26 81.99 3.97 5.43 4.58 0.126 0.39 0.69 0.63 Table3Majorelementconcentrations(wt.%)ofbedsandsfortheSanagaRiverbetweenNanga-EbokoandAtlanticOcean SA24SA23SA22SA21SA20SA19SA18 Oxides(%)87.84 86.32 1.53 5.75 1.01 0.028 0.06 0.12 0.35 3.07 0.04 1.77 100.04587560 1.07 15.01 3.76 1.18-0.48 76.09 74.86 6.35 6.37 6.64 0.196 0.46 0.87 0.76 1.77 0.11 1.4 99.79 59 64 662.68 11.75 1.00 1.07 0.57 79.62 78.60 4.37 6.09 5.78 0.176 0.45 0.82 0.71 1.64 0.09 1.4 100.13 6065652.29 12.91 1.39 1.11 0.55 86.43 86.07 1.46 5.44 2.68 0.070 0.38 0.73 0.75 1.94 0.06 1.1 100.68 54 58 561.47 15.82 3.73 1.20 0.14 78.86 74.50 2.50 8.24 4.61 0.125 0.43 0.79 0.78 2.40 0.10 5.41 99.88 616964 1.41 9.04 3.30 0.96 0.28 83.22 81.63 1.70 6.83 3.32 0.088 0.45 0.73 0.81 2.47 0.06 2.58 100.67 566158 1.40 11.95 4.02 1.08 0.13 75.96 72.88 3.46 7.98 7.05 0.163 0.49 0.77 0.70 2.34 0.11 4.15 100.09 62 70 671.88 9.13 2.31 0.96 0.48 Oxides(%)(SiO2)adj SiO2 TiO2 Al 2O3 Fe2O3t MnO MgO CaO Na2O K2O P2O5 LOI Total CIA(%)PIA(%)MIA(%)ICV SiO2/Al 2O3 Al 2O3/TiO2 Log(SiO2/Al 2O3)Log(Fe2O3/K2O)SA32SA31SA30SA29SA28SA27MB Oxides(%)83.76 83.64 1.31 6.99 3.23 0.069 0.77 1.22 0.73 84.67 84.45 1.15 6.85 2.62 0.052 0.39 0.71 0.85 80.39 79.24 3.52 6.48 5.01 0.132 0.36 0.61 0.76 78.80 75.57 1.61 9.72 4.34 0.068 0.70 0.66 0.71 75.90 74.19 4.32 7.83 6.28 0.153 0.59 0.92 0.83 76.75 74.13 1.84 10.35 4.32 0.088 0.59 0.81 1.00 84.22 83.82 0.86 7.38 2.09 0.046 0.47 0.79 0.84 Oxides(%)(SiO2)adj SiO2 TiO2 Al 2O3 Fe2O3t MnO MgO CaO Na2O
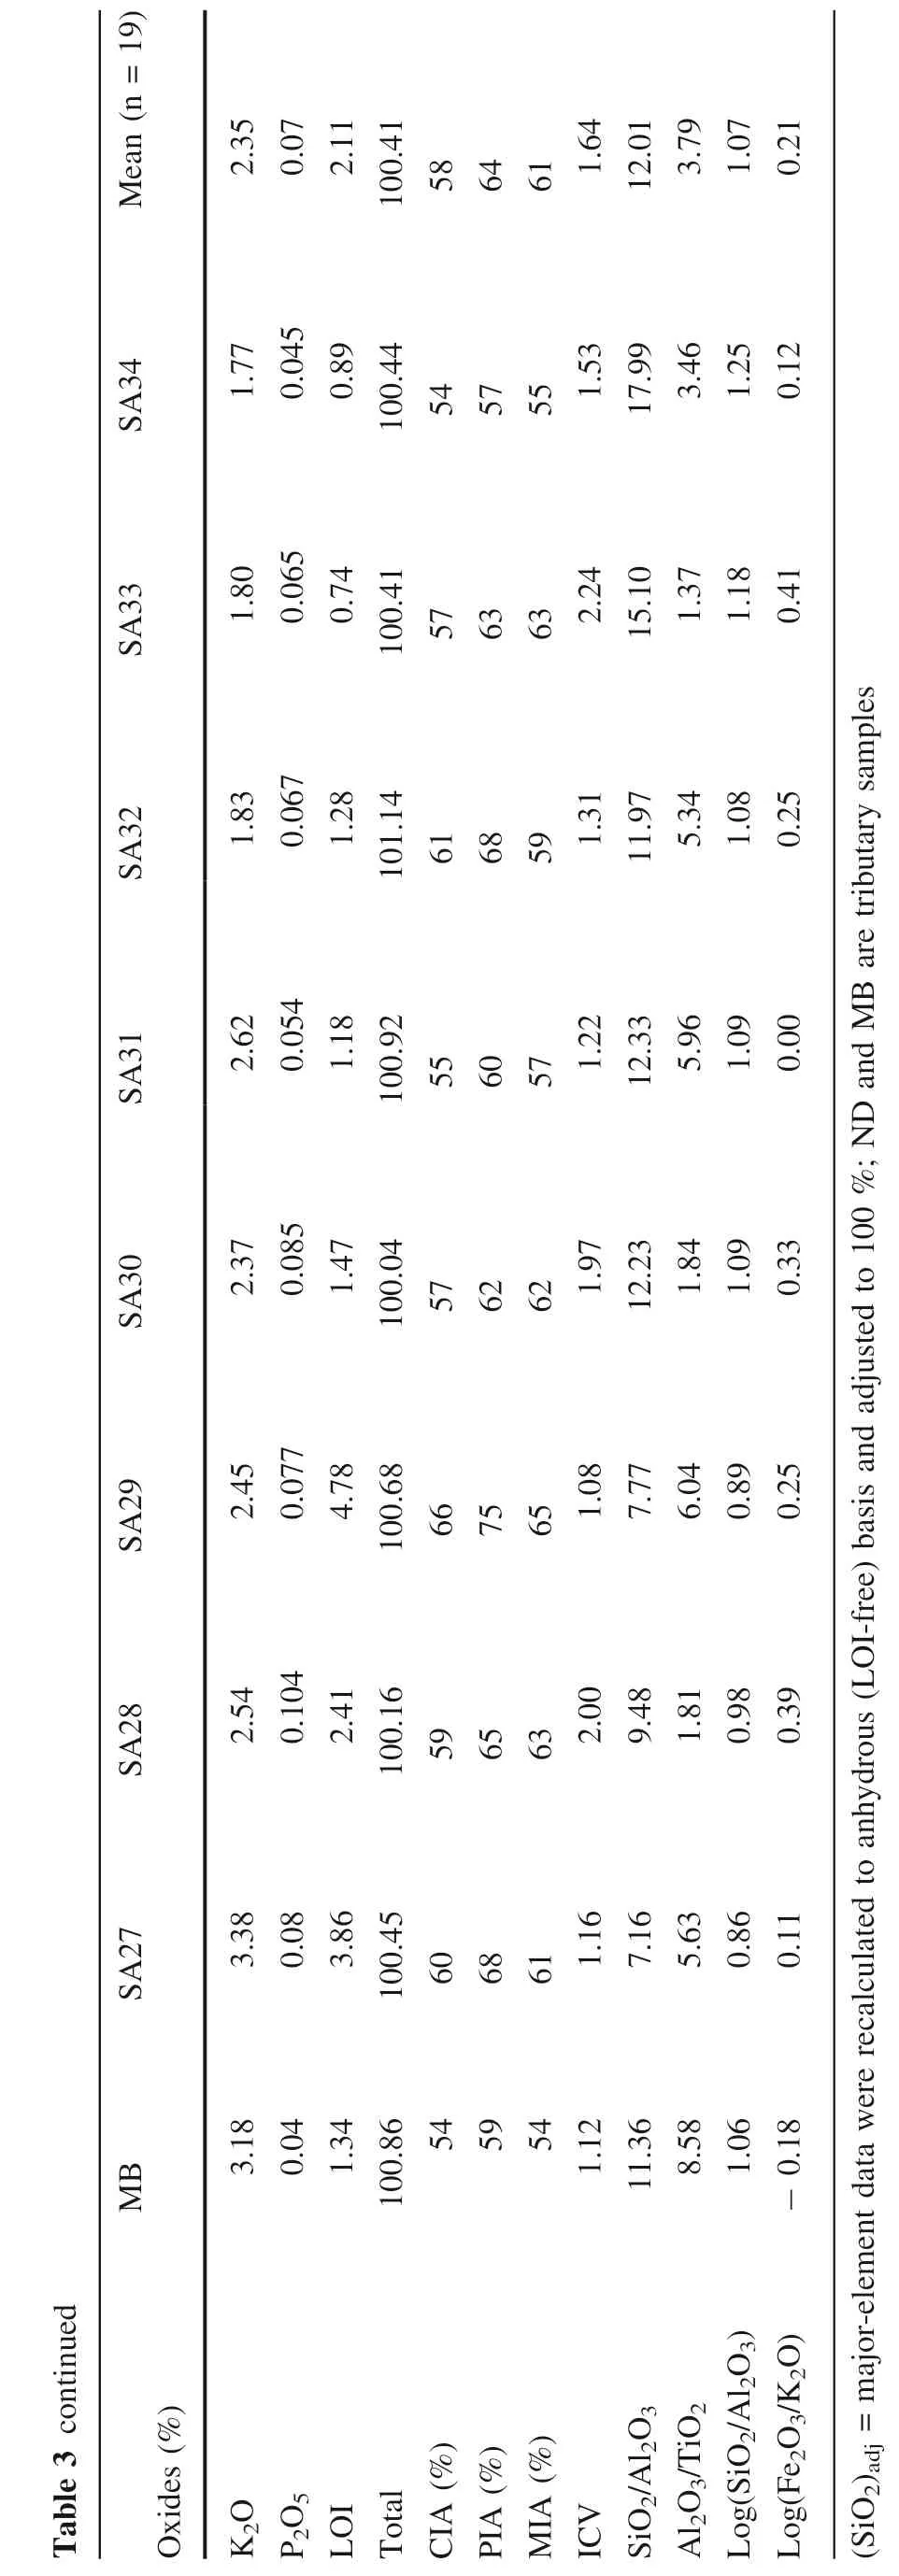
Table3continued Mean(n=19)2.35 0.07 2.11 100.41 586461 1.64 12.01 3.79 1.07 0.21 SA341.77 0.045 0.89 100.44 545755 1.53 17.99 3.46 1.25 0.12 SA331.80 0.065 0.74 100.41 5763632.24 15.10 1.37 1.18 0.41 SA321.83 0.067 1.28 101.14 61 68 591.31 11.97 5.34 1.08 0.25 SA312.62 0.054 1.18 100.92 5560571.22 12.33 5.96 1.09 0.00 SA302.37 0.085 1.47 100.04 5762621.97 12.23 1.84 1.09 0.33 SA292.45 0.077 4.78 100.68 667565 1.08 7.77 6.04 0.89 0.25 SA282.54 0.104 2.41 100.16 596563 2.00 9.48 1.81 0.98 0.39 SA273.38 0.08 3.86 100.45 6068611.16 7.16 5.63 0.86 0.11 MB 3.18 0.04 1.34 100.86545954 1.12 11.36 8.58 1.06-0.18 Oxides(%)K2O P2O5 LOI Total CIA(%)PIA(%)MIA(%)ICV SiO2/Al 2O3 Al 2O3/TiO2 Log(SiO2/Al 2O3)Log(Fe2O3/K2O)aretributarysamples(SiO2)adj=major-elementdatawererecalculatedtoanhydrous(LOI-free)basisandadjustedto100%;NDandMB
The ICV values(1.07–2.68)of the studied sands indicate that the weathering degree is low to moderate.Numerous weathering indices have been proposed to evaluate the mobility of elements during chemical weathering(Babechuk et al.2014).These weathering indices are commonly used to determine the intensity of weathering(Armstrong-
Altrin et al.2015,2018;Schneider et al.2015;Garzanti and Resentini 2016;Maharana et al.2018;Ndjigui et al.2018,2019;Ngueutchoua et al.2019).In general,weathering indices compare the concentration of an immobile element relative to that of mobile elements(Garzanti and Resentini 2016).The chemical index of alteration(CIA;Nesbitt and Young 1982),which allows a quantitative determination of weathering degree of a material,is the most commonly used.This index evaluates the progressive hydrolysis of feldspars to clay minerals(Bhaskar et al.2015).CIA values vary between 40 and 100%and its formula(in molar proportions)is as follows:

where,CaO*represents the amount CaO in silicates.
For CaO*calculation,if the mole fraction of CaO≤NaO,then the value of CaO*is equal to CaO,but if CaO≥NaO,then the value of CaO*is equal to NaO(McLennan et al.1993;Bock et al.1998).

SA18 SA19 SA20 SA21 SA22 SA23 SA24 SA25 SA26 ND LILE Ba 928.5 972.1 982.2 758.4 655.6 710.2 644 816 1047.1 805.8 Sr 214.1 208.5 209.1 195.3 168.5 183 56.8 200.6 218.9 184.1 Rb 55.13 56.8 57.16 43.06 34.33 37.74 60.81 44.87 66.28 44.85 Li 7.4 5.5 7.7 4.3 4.8 5.2 2.5 5.2 3.4 6.3 Cs 1.168 0.94 1.259 0.541 0.497 0.573 0.257 0.63 0.741 0.739 HFSE Th 10.665 11.887 19.934 12.314 33.2 66.234 12.747 41.605 7.1 30.597 U 6.307 2.705 4.137 2.413 5.377 7.74 3.969 5.89 1.659 5.318 Nb 46.941 27.884 39.105 23.972 72.51 106.413 33.349 60.495 18.878 54.843 Ta 2.273 2.039 2.902 1.704 5.691 8.402 2.168 3.968 1.506 3.835 Zr 1425 784 983 755 3516 5330 1284 3879 171 3438 Hf >29 19.51 25.3 18.88 >29 >29 >29 >29 4.58 >29 Mo 0.98 0.53 0.65 0.38 0.88 1.13 0.53 0.67 0.45 0.72 W 1.46 1.07 1.45 0.82 3.01 4.21 1.27 2.5 0.68 1.58 Pb 23.69 16.39 18.43 13.26 16.68 16.90 20.14 15.69 17.19 18.90 Y 29.36 13.92 21.34 13.06 25.2 33.9 24.39 27.19 7.67 29.6 Th/U 1.69 4.39 4.82 5.10 6.17 8.56 3.21 7.06 4.28 5.75 Transition metals Cr 87 49 58 38 68 88 35 64 40 66 V 114.3 52.5 75.1 43.5 103.4 143 40.2 87.4 31.8 89.9 Ni 15 11.7 12.7 8.3 9.9 12.1 3.5 8.9 8.4 10.9 Cu 17.4 7.3 9.9 6.9 10.9 9.5 8.1 6.6 5.2 9.3 Co 11.08 7.87 9.58 6 12.65 10.53 2.47 8.11 4.49 10.57 Sc 5.1 4.9 6.8 4.2 7.2 8.7 3.3 6.2 3.8 7.1 MB SA27 SA28 SA29 SA30 SA31 SA32 SA33 SA34 Mean(n=19)LILE Ba 1110.6 1210.9 939 866.3 856.9 935.7 678.8 648 639 852.90 Sr 227.8 252.3 203 166.3 184.9 206.7 182.3 151 150.3 187.55 Rb 68.44 84.85 55.81 65.16 51.49 55 39.7 37.67 36.07 52.38 Li 3.3 7.5 5.1 9.1 4.0 3.7 5.1 3.6 3.9 5.14 Cs 0.785 1.581 0.796 1.641 0.614 0.616 0.483 0.444 0.368 0.77 HFSE Th 6.883 18.552 48.198 11.738 68.366 9.066 6.93 51.14 11.323 25.18 U 1.809 3.263 7.034 2.526 6.834 2.001 1.762 6.741 2.561 4.21 Nb 17.677 32.573 70.083 33.521 52.055 22.052 26.914 65.525 25.605 43.71 Ta 1.322 2.36 4.951 2.368 3.753 1.519 1.858 4.729 1.77 3.11 Zr 231 618 4165 546 3707 478 214 3846 422 1883 Hf 6.19 16.62 >29 13.83 >29 11.97 5.53 >29 11.15 13.36 Mo 0.43 0.65 0.79 0.77 0.6 0.39 0.5 0.62 0.38 0.63 W 0.57 1.1 2.25 1.24 1.61 0.7 0.83 1.88 0.86 1.53 Pb 17.97 22.75 19.06 33.66 17.97 15.58 15.09 15.26 11.55 18.22 Y 10.59 17.640 30.310 15.590 27.670 9.840 12.670 25.020 10.130 20.33 Th/U 3.80 5.69 6.85 4.65 10.00 4.53 3.93 7.59 4.42 5.73 Transition metals Cr 45 64 96 69 78 50 68 69 46 62.00 V 33.4 62.4 99.4 73 78.4 39.8 56 80 40.1 70.72 Ni 9.1 15.6 14 18 9.9 8.5 12.5 8.4 6.9 10.75

MB SA27 SA28 SA29 SA30 SA31 SA32 SA33 SA34 Mean(n=19)Cu 4.8 12.2 9.1 20.5 8.7 8.8 8.1 8.5 4.2 9.26 Co 4.58 9.14 10.33 8.72 8.64 5.11 6.77 6.6 6.87 7.90 Sc 4.3 6 7 7.3 5.5 4.1 6.9 5.5 4.2 5.69
CIA values between 50 and 60%indicate a low degree of weathering,while those between 60 and 80%indicate a moderate degree of weathering.CIA values above 80%indicate extreme weathering degree.The CIA parameter also gives an idea of the paleoclimate in the source environment(Nesbitt and Young 1982).The abundance of aluminous clay minerals indicates an intense chemical weathering in tropical or equatorial climates.CIA values of weathering materials in tropical or equatorial climates vary between 80 and 100%.In glacial environments,where mechanical disaggregation predominates,CIA values are~50%(Nesbitt and Young 1982).The studied sands have CIA values between 53 and 66%,with an average of 58%(n=19).This average value,close to that of UCC(50%;Bhuiyan et al.2011),indicates a low weathering degree of the studied sands.However,few samples(SA18 and SA20,SA27,SA29,and SA32)have CIA values greater than 60%indicating moderate weathering.These materials have undergone moderate weathering.Their parent rocks are thus low to moderately weathered.
Plagioclase index of alteration(PIA)is generally used to measure the degree of alteration of the source rock(Bhaskar et al.2015).PIA values can be determined using the relationship proposed by Fedo et al.(1995):

The minimum value of this parameter is~50%.The maximum value of PIA is equal to 100%and indicates complete plagioclase hydrolysis with the formation of kaolinite and gibbsite.PIA values around 50%indicate very low plagioclase hydrolysis(Bhaskar et al.2015).The PIA value of Post-Archean Australian Shale(PAAS)is 79%(Bah and Hiroaki,2016).The studied sands have PIA values between 57 and 75%,with an average of 64%(n=19).This value indicates a moderate weathering degree.
The Maf ic Index of Alteration(MIA)is a chemical weathering proxy proposed by Babechuk et al.(2014)that extends the equation of CIA to take into account the maf ic elements Mg and Fe,based on the fact that maf ic minerals(e.g.garnet,pyroxene,olivine,epidote)are also susceptible to chemical weathering.
The MIA formula(in molar proportions)is as follows:

MIA increasing index values indicate progressively more altered rock,as it is the case with CIA.A value of 100 indicates complete removal of the mobile elements contained in feldspars and ferromagnesian minerals.MIA values range between 54 and 67%,with an average of 61%(n=19),thus indicating a moderate weathering degree of ferromagnesian minerals.
CIA,PIA,and MIA values indicate a moderate weathering degree.This result is corroborated by the abundance of quartz,feldspars,and some ferromagnesian minerals(e.g.garnet and epidote)in the studied sands.However,the Sanaga River f lows in the tropical and equatorial zones in which the weathering phenomenon is intense.The moderate weathering degree of the studied materials is probably related to the predominance of sands from nearby source rocks.
SA18 SA19 SA20 SA21 SA22 SA23 SA24 SA25 SA26 ND La 31.1 19.2 36.5 19.4 60.5 123 26.4 91.6 14.5 46.0 Ce 70.81 41.34 76.46 42.54 133.54 251.84 51.84 185.95 30.71 97.19 Pr 7.353 4.682 8.540 4.742 13.789 28.949 5.682 21.17 3.472 10.973 Nd 27.55 17.57 31.14 17.88 52.11 106.68 20.75 77.82 13.11 40.71 Sm 5.22 3.239 5.672 3.316 9.387 17.663 3.843 13.303 2.344 7.287 Eu 0.8696 0.6299 0.8605 0.6070 1.0471 1.4484 0.6273 1.0886 0.5514 0.8932 Gd 4.572 2.679 4.390 2.651 6.265 10.927 3.456 8.276 1.769 5.828 Tb 0.7181 0.3889 0.6271 0.3787 0.8033 1.2396 0.5551 0.9833 0.2507 0.8215 Dy 4.695 2.398 3.761 2.291 4.621 6.332 3.816 5.136 1.536 5.132 Ho 1.0172 0.5110 0.7773 0.4908 0.9102 1.2119 0.8569 0.9960 0.2933 1.0758 Er 3.276 1.598 2.403 1.515 2.842 3.650 2.759 3.069 0.858 3.358 Tm 0.5146 0.2546 0.3773 0.2351 0.4481 0.5644 0.4743 0.4764 0.1393 0.5309 Yb 3.819 1.884 2.812 1.811 3.401 4.226 3.553 3.598 0.937 3.862 Lu 0.617 0.307 0.446 0.280 0.541 0.690 0.561 0.561 0.138 0.631 LREE 142.03 86.03 158.31 87.88 269.33 528.13 108.52 389.84 64.14 202.16 HREE 19.23 10.02 15.59 9.65 19.83 28.84 16.03 23.10 5.92 21.24∑REE 162.13 96.68 174.77 98.14 290.20 558.42 125.17 414.03 70.61 224.29 LREE/HREE 7.39 8.59 10.15 9.10 13.58 18.31 6.77 16.88 10.83 9.52(La/Yb)N 5.53 6.92 8.82 7.28 12.08 19.77 5.05 17.29 10.51 8.09(La/Sm)N 6.24 3.70 4.02 3.65 4.02 4.35 4.29 4.30 3.86 3.94(Gd/Yb)N 0.97 1.15 1.26 1.18 1.49 2.09 0.79 1.86 1.53 1.22 Eu/Eu*(1) 0.71 0.66 0.53 0.63 0.42 0.32 0.53 0.32 0.83 0.42 Eu/Eu*(2) 0.76 0.91 0.73 0.87 0.58 0.44 0.73 0.44 1.15 0.58 MB SA27 SA28 SA29 SA30 SA31 SA32 SA33 SA34 Mean(n=19)La 13.5 36.8 85.8 28.8 126 17.2 15.8 86.5 22.1 47.4 Ce 29.56 76.24 173.1 62.66 243.9 36.27 35.24 168.54 46.07 97.57 Pr 3.362 8.492 19.398 6.655 26.955 4.023 4.11 19.468 5.300 10.901 Nd 12.50 31.26 71.22 25.04 96.86 14.9 15.83 71.14 19.84 40.21 Sm 2.376 5.404 12.075 4.326 15.667 2.624 2.96 11.619 3.425 6.934 Eu 0.5355 0.9284 1.1997 0.8707 1.3041 0.5418 0.7005 1.0707 0.5525 0.8593 Gd 1.921 3.978 8.261 3.405 9.823 2.006 2.548 7.664 2.616 4.897 Tb 0.2949 0.5334 1.0562 0.4628 1.1533 0.2911 0.3690 0.9260 0.3526 0.6424 Dy 1.813 3.239 5.701 2.855 5.724 1.790 2.303 4.810 1.826 3.673 Ho 0.3814 0.6618 1.0941 0.5585 0.9985 0.3600 0.4677 0.9259 0.3617 0.7342 Er 1.175 1.950 3.285 1.707 2.820 1.120 1.382 2.816 1.091 2.246 Tm 0.1835 0.2977 0.5038 0.2575 0.4310 0.1753 0.2087 0.4431 0.1754 0.3522 Yb 1.285 2.107 3.788 1.825 3.208 1.269 1.416 3.439 1.239 2.604 Lu 0.190 0.318 0.592 0.277 0.517 0.195 0.204 0.562 0.197 0.412 LREE 61.30 158.20 361.59 127.48 509.38 75.02 73.94 357.27 96.74 203.01 HREE 7.24 13.08 24.28 11.35 24.67 7.21 8.90 21.59 7.86 15.56∑REE 69.08 172.21 387.07 139.70 535.36 82.77 83.54 379.92 105.15 218.84 LREE/HREE 8.46 12.09 14.89 11.23 20.64 10.41 8.31 16.55 12.31 11.90(La/Yb)N 7.14 11.86 15.39 10.72 26.68 9.21 7.58 17.09 12.12 11.53(La/Sm)N 3.55 4.25 4.44 4.16 5.02 4.09 3.33 4.65 4.03 4.07(Gd/Yb)N 1.21 1.53 1.76 1.51 2.48 1.28 1.46 1.80 1.71 1.49 Eu/Eu*(1) 0.77 0.61 0.37 0.70 0.32 0.72 0.78 0.35 0.57 0.55

MB SA27 SA28 SA29 SA30 SA31 SA32 SA33 SA34 Mean(n=19)Eu/Eu*(2) 1.07 0.85 0.51 0.97 0.45 1.01 1.09 0.48 0.79 0.76
5.3 Provenance
Geochemical analysis data and discrimination diagrams permit to identify possible source rock provenance(Schneider et al.2015;Armstrong-Altrin et al.2017,2018,2019;Maharana et al.2018).Trace elements such as Y,Cr,Th,Hf,Nb,and Ti are among the most reliable indicators of the source rock provenance(Cullers 2000).The distribution of immobile elements such as La and Th,enriched in silicic rocks,and Co and Cr,enriched in basic rocks,are also extensively used to determine the felsic or maf ic source of sediments(Armstrong-Altrin et al.2017;Madhavaraju et al.2018;Velmurugan et al.2019).REE concentrations are also used to derive the source of sediments(Cullers et al.1988).Sediments derived from the Upper continental crust are characterized by LREE enrichment.Maf ic rocks have a low LREE/HREE ratio,except for alkaline basalts,and show no Eu anomalies.By contrast,felsic rocks generally have a high LREE/HREE ratio and a negative Eu anomaly(Cullers et al.1988).Comparisons of the REE spectra of sedimentary rocks with those of source rocks also help determine the nature of source rocks(Taylor and McLennan 1985).The studied sands show enrichment in LREE relative to HREE and a negative anomaly in Eu(Eu/Eu*=0.32–0.83).These sands probably derive from felsic source rocks.This result agrees with the low Cr(35–96 ppm)and Ni(3–18 ppm)concentrations in the studied sediments.La/Sc,La/Co,Th/Sc,and Cr/Th ratios are different in felsic and maf ic rocks(Table 6).These ratios can be used to estimate the average composition of the provenance(Cullers et al.1988;Guo et al.2018;Maharana et al.2018).
Th/U ratio is also widely used in the determination of weathering degree and recycling of sedimentary rocks(Roddaz et al.2006).In sedimentary rocks,Th/U values greater than 4 indicate intense weathering in the source environment or recycled sediments(Bhuiyan et al.2011).Th/U values in Upper continental crust rocks are generally between 3.5 and 4(McLennan et al.1993).Th/U ratios of the studied sands are between 1.69 and 10.00,for an average of 5.40(n=19).This result conf irms that the studied sediments have undergone low to moderate recycling(Bhuiyan et al.2011).
Th/Covs.
La/Sc diagram which characterizes the geochemical composition of the source rock reveals that the studied sands derive from silicic source rocks.This result corroborates high SiOconcentrations(72.88–87.24 wt.%)in the studied sediments(Fig.9).The discrimination diagram of Roser and Korsch(1988)indicates four sources of possible sources of sediments:maf ic,felsic,intermediate,and quartzose.According to this diagram,the studied sands are of quartzose sedimentary origin(Fig.10).This result corroborates that of Fig.11 which shows that the studied sands derive from felsic source rocks.At the exception of zircons(Table 2)whose provenance is just linked to acidic rocks,other heavy minerals are consistent with metamorphic rocks:Andalousite is typical of contact metamorphism which,within the Sanaga watershed,is found in the Lom series.Epidotes,garnet,anatase,alumina silicates are common minerals of the Yaounde group.It appears that the major provider of heavy minerals and thus sediments are syn-to post-tectonic granitoids(600–500 Ma),pre-to syntectonic orthogneisses(660–600 Ma),and Meso to Neoproterozoic metasediments(700–1000 Ma;Tchakounte´et al.2017),which outcrop along the Sanaga River(Table 7;Fig.12).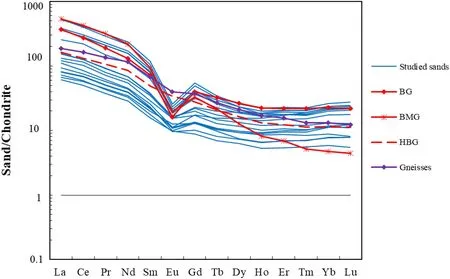
Fig.12 Comparison of the chondrite-normalized REE patterns of the Sanaga River bed sands with those of possible source rocks from the study area
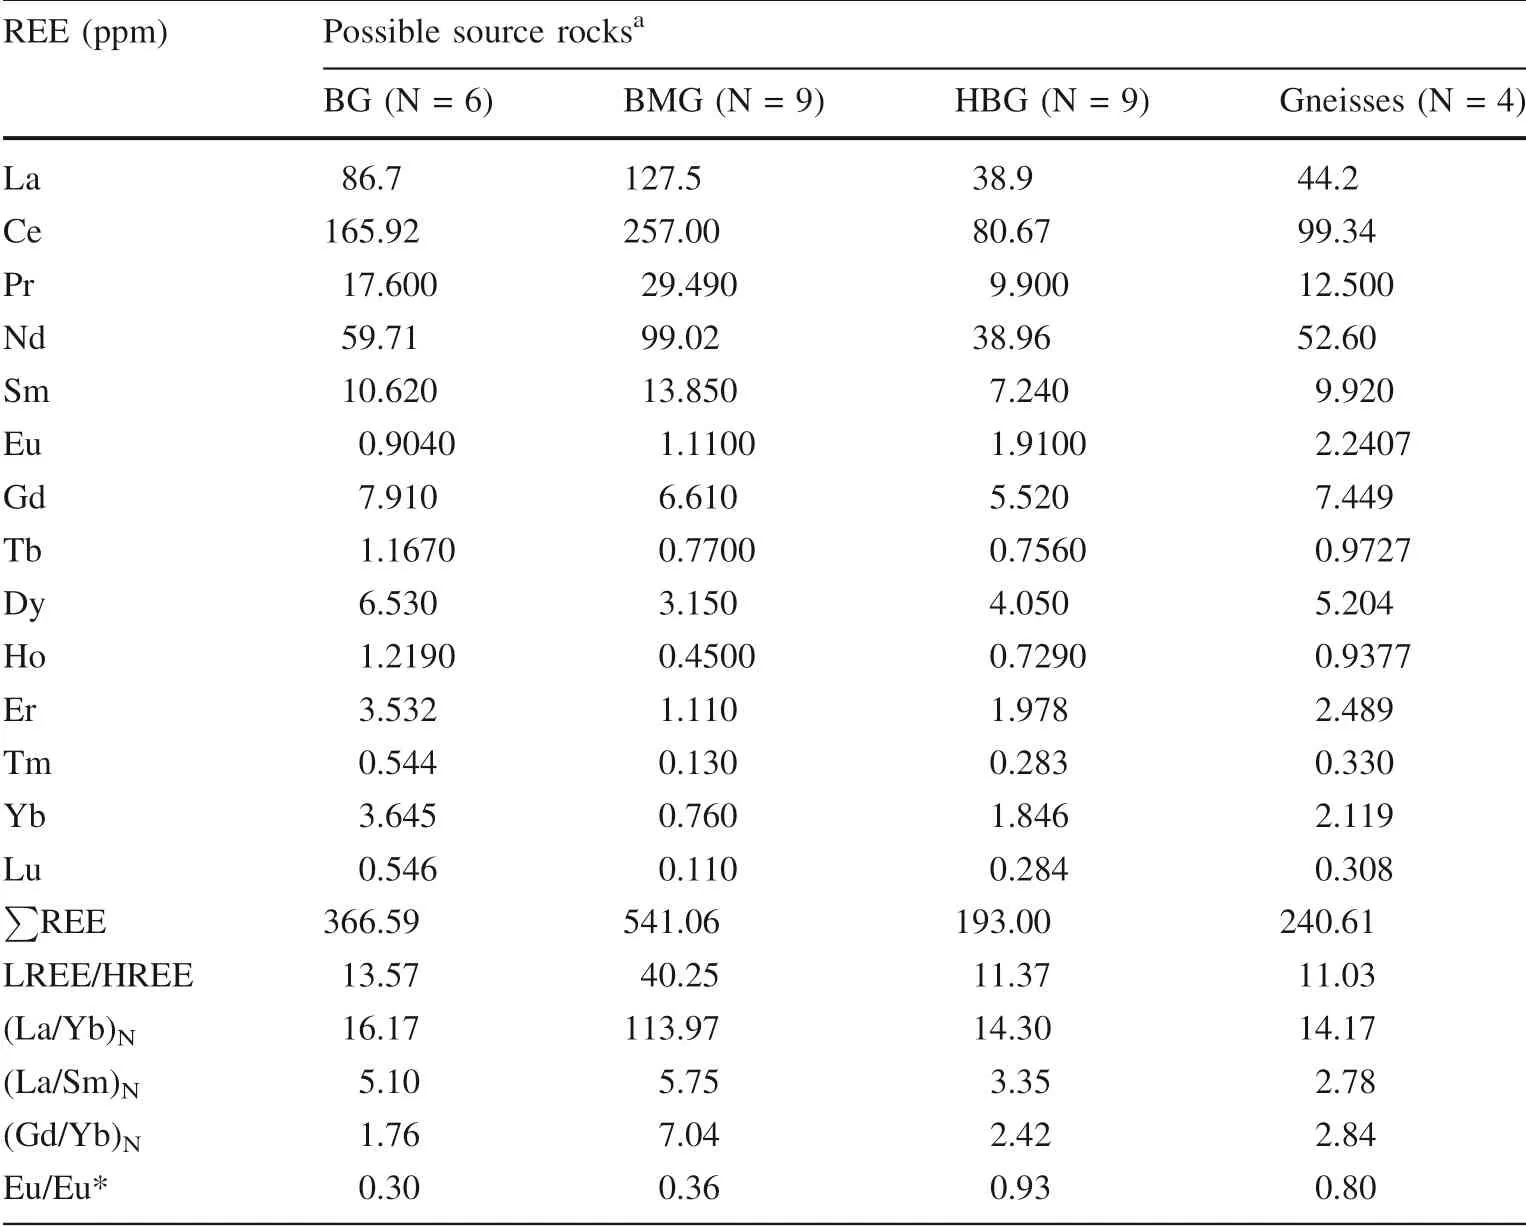
Table 7 Representative REE concentrations(ppm)of possible source rocks from the study area

Fig.9 Th/Co versus.La/Sc diagram of geochemical characterization of rock sources(after Cullers 2002)

Fig.10 Classif ication plot of discriminant functions F1 and F2 for the Sanaga River bed sands between Nanga-Eboko and Atlantic Ocean.Provenance f ields are from Roser and Korsch(1988).F1=(–1.73×TiO2)+(0.607×Al2O3)+(0.760×Fe2O3t)+(–1.500×MgO)+(0.616×CaO)+(0.509×Na2O)+(–1.224×K2O)–9.090;F2=(0.445×TiO2)+(0.070×Al2O3)+(–0.250×Fe2O3t)+(–1.142×MgO)+(0.438×CaO)+(1.475×Na2O)+(1.426×K2O)–6.861

Fig.11 Al2O3/TiO2 vs.(SiO2)adj plot of the Sanaga River bed sands(after Armstrong-Altrin 2009)

Elemental ratio Sanaga sandsa Sediments from felsic sourcesb Sediments from maf ic sourcesb La/Sc 2.29–15.73 2.50–16.3 0.43–0.86 La/Co 2.33–14.58 1.80–13.8 0.14–0.38 Th/Sc 1.00–12.43 0.84–20.5 0.05–0.22 Cr/Th 1.3–9.81 avr-15 25–100
5.4 Tectonic setting
Geochemical data of clastic sediments represent a veritable archive that allows determining not only the degree of weathering and provenance of their source rocks but also the geotectonic environment in which these rocks have been formed(Armstrong-Altrin et al.2015;Etemad-Saeed et al.2015;Ramos-Vazquez et al.2018;Rivera-Go´mez et al.2020).To better understand the geotectonic environment in which source rocks have been formed,Verma and Armtrong-Altrin(2013)propose two discriminant functions depending on whether the sediments have high SiO[(SiO)=63–95 wt.%]or low SiOconcentrations[(SiO)=35–63 wt.%].Verma and Armtrong-Altrin(2013)discrimination functional diagrams based solely on major element data def ine three main types of tectonic environments:island arc,rift,and collision zones(Fig.13).Identically,Verma and Armstrong Altrin(2016)discrimination diagrams enable the discrimination of sediments derived from passive and active margin settings from the major element(Fig.14a)and the combination of major and trace element data(Fig.14b).In these diagrams,the active margin f ield represents the sediments derived from arc and collision setting,and the passive margin represents a rift setting.All the studied sediments have high SiOconcentrations(>63%).On the tectonic discrimination diagrams,all the samples are plotted in the rift and passive margin domains(Figs.13,14),which is consistent with thetectonic history of Pan African in Southern Cameroon(Moussango et al.2018).On the geodynamic point of view Pan-African domain of south Cameroon prolongs to the East the passive Atlantic margin of the Africa continent.The Sanaga River basin which f lows following an ENEWSW direction to the Atlantic Ocean straddles three different domains of the Pan-African belt of Cameroon:the southern domain represented by metamorphic formations of the Yaounde´group;the Adamawa and the West Cameroon domains composed of granitoids and gneisses.The SF which corresponds to a linear N70°E oriented segment of the Sanaga River(Ngapna et al.2018)certainly played as a good facilitator in the driven of sands of Pan-African age(1000–500 Ma;Tchakounte´et al.2017).

Fig.13 Discriminant-function multi-dimensional diagram for highsiliclastic sediments of the Sanaga River bed sands(after Verma and Armstrong-Altrin 2013).The subscript m1 in DF1 and DF2 represents the high-silica diagram based on loge-ratios of major-elements.The discriminant function equations are:DF1(Arc-Rift-Col)m1=(-0.263×In(TiO2/SiO2)adj)+(0.604×In(Al2O3/SiO2)adj)+(-1.725×In(Fe2O3t/SiO2)adj)+(0.660× In(MnO/SiO2)adj)+ (2.191×In(MgO/SiO2)adj)+(0.144×In(CaO/SiO2)adj)+(-1.304×In(Na2O/SiO2)adj)+ (0.054× In(K2O/SiO2)adj)+(-0.330×In(P2O5/SiO2)adj)+1.588;DF2(Arc-Rift-Col)m1=(-1.196×In(TiO2/SiO2)adj)+(1.604×In(Al2O3/SiO2)adj)+(0.303×In(Fe2O3t/SiO2)adj)+(0.436×In(MnO/SiO2)adj)+(0.838×In(MgO/SiO2)adj)+(-0.407×In(CaO/SiO2)adj)+(1.021×In(Na2O/SiO2)adj)+(-1.706×In(K2O/SiO2)adj)+(-0.126×In(P2O5/SiO2)adj)-1.068

Fig.14 Evaluation of the new multidimensional discriminant function diagrams for the discrimination of active(A)and passive(P)margin settings from sediments of the Sanaga River bed sands.a Major element(M)based diagram;DF(A-P)M=(3.0005×ilr1Tim)+(2.8243×ilr2Alm)+(-1.596×ilr3FeM)+(-0.7056×ilr4MnM)+(-0.3044×ilr5MgM)+(0.6277×ilr6CaM)+(-1.1838×ilr7NaM)+(1.5915×ilr8KM)+(0.1526×ilr9PM)-5.9948;(b)Combined major and trace element(MT)based diagram DF(A-P)MT=(3.2683×ilr1TiMT)+(5.3873×ilr2AlMT)+(1.5546×ilr3FeMT)+(3.2166×ilr4MnMT)+(4.7542×ilr5MgMT)+(2.0390×ilr6CaMT)+(4.0490×ilr7NaMT)+(3.1505×ilr8KMT)+(2.3688×ilr9PMT)+(2.8354×ilr10CrMT)+(0.9011×ilr11NbMT)+(1.9128×ilr12NiMT)+(2.9094×ilr13VMT)+(4.1507×ilr14YMT)+(3.4871×ilr15ZrMT)-3.2088(after Verma and Armstrong-Altrin 2016)
6 Conclusions
The mineralogical and geochemical study of bed sediments of the lower course of Sanaga River between Nanga-Eboko and the Atlantic Ocean shows that:(1)the sediments are mainly coarse-grained sands composed of quartz,microcline,plagioclase,muscovite,ilmenite,anatase,magnetite,opaques,and epidote;(2)these immature sands derive from moderately weathered rocks;(3)and are mainly litharenites originating from Pan-African age(1000–500 Ma)granitoids,orthogneisses,and metasediments from south Cameroon emplaced in a passive margin.Isotope data are needed to conf irm this;and(4)the REE enrichment and the relatively strong Eu anomalies observed in these sediments are due to the high anatase,ilmenite,and zircon contents in these sands.
Acknowledgement
s We express our gratitude to the GeoLabs(Sudbury-Canada)for mineralogical and geochemical analyses.We also thank anonymous reviewers who have greatly improved the quality of this paper.Data availability material
All data are available upon request.Compliance with ethical standards
Conf lict of interest
There is no conf lict of interest.Code availability
Not applicable.杂志排行
Acta Geochimica的其它文章
- Validating the deep time carbonate carbon isotope records:effect of benthic f lux on seaf loor carbonate
- Petrology and geochemical framework of dolerites dykes of Temte´,North Cameroon,Central Africa
- Interaction of Ca2+and soil humic acid characterized by a joint experimental platform of potentiometric titration,UV-visible spectroscopy,and f luorescence spectroscopy
- Trace and rare earth element geochemistry of the black and grey shales of the Calabar Flank,Southeastern Nigeria:constraints on the depositional environment and the degree of metal enrichment
- Geochronological and geochemical comparison of Precambrian meta-maf ic volcanics in Zhongtiaoshan and Lu¨liangshan Regions in Shanxi,North China Craton
- Episodic crustal growth and reworking at the southeastern margin of the North China Craton:evidence from zircon U-Pb and Lu-Hf isotopes of Archean tonalite-trondhjemite-granodiorite gneisses in the Bengbu-Wuhe area
