Contagion dynamics on adaptive multiplex networks with awareness-dependent rewiring*
2021-05-24XiaoLongPeng彭小龙andYiDanZhang张译丹
Xiao-Long Peng(彭小龙) and Yi-Dan Zhang(张译丹)
1Complex Systems Research Center,Shanxi University,Taiyuan 030006,China
2Shanxi Key Laboratory of Mathematical Techniques and Big Data Analysis on Disease Control and Prevention,Shanxi University,Taiyuan 030006,China
3School of Mathematical Sciences,Shanxi University,Taiyuan 030006,China
Keywords: epidemic spreading,awareness diffusion,adaptive rewiring,multiplex networks
1. Introduction
Nowadays, the communication networks, through media such as telephones, emails, Facebook, Twitter and Wechat,provide people easy access to information about the emergence or outbreaks of infectious diseases. In many cases,public health communications concerning the risk of infections have a beneficial effect on human behavior.[1]For example,during the COVID-19 pandemic, the World Health Organization has disseminated information on health issues such as quarantining, social distancing, regulating international travelers,closing schools,and operating public transportation and workplaces. People who receive the disease information become aware of the transmission risk and tend to change their behavior to reduce their susceptibility to infections.[2]In this way, social contagion[3–5]of human awareness about infections influences the biological contagion.[1]
In literature, many works have been devoted to understanding the impact of human awareness on infectious disease spread. For example,Funk et al.[6]formulated a network model to study how the spread of awareness, prompted by first-hand information about a disease case,affects the disease spread. Along the same lines, Wu et al.[7]proposed a continuous heterogeneous mean-field model to study the impact of contact,local and global awareness on the epidemic spread on scale-free networks. These models are based on a simplex network structure by simply assuming that the physical contact network layer(for disease transmission)and the information network layer (for awareness propagation) are identical in that their connections among the individuals coincide with each layer.In reality,however,the information network,where the individuals communicate information about disease cases,is often topologically different from the face-to-face contact network, where the disease can be transmitted through infectious contacts. To address this problem, Granell et al.[8]pioneered the study of competing dynamics between awareness and disease spreading processes on a multiplex network consisting of two network layers, in which the nodes represent the same entities in both layers while edges in different layers stand for different types of social relationships.[9]Their multiplex network framework was applied to a susceptible-infectedsusceptible(SIS)[10]disease transmission that confers no immunity and a unaware-aware-unaware(UAU)information diffusion process.Granell et al.[8]utilized a microscopic Markov chain approach to obtain the threshold condition for the disease outbreak. Interestingly, they discovered a metacritical point for the epidemic threshold. They further considered the general case where the awareness does not guarantee complete immunization and infection does not confer instant awareness of it. Also, the impact of mass media on the epidemic prevalence was incorporated.[11]
The pioneering work by Granell et al. has prompted a number of supplementary studies on the competing processes of disease and awareness on multiplex networks. For instance,Guo et al.[12]proposed a local awareness-controlled SIS epidemic model on multiplex networks. Interestingly, they observed two-stage effects on epidemic threshold and epidemic prevalence. Kan and Zhang[13]investigated the combined effects of awareness spread and self-initiated awareness behavior on the SIS disease dynamics. More recently, Xia et al.[14–16]extended the multiplex network model of awarenessdisease dynamics to a susceptible-infected-recovered(SIR)[10]epidemic process that allows permanent immunity after infection. All of these models have employed the microscopic Markov chain approach by Granell et al.[8,11]to identify the epidemic threshold as the largest eigenvalue of a matrix operator that includes information about the network structure and the density of aware individuals(who know about the infection risk)in the steady state.[12–16]
The above models considered the impact of behavioral response to disease information by simply integrating the impact into a reduced susceptibility for aware susceptibles (i.e.,susceptible individuals who are aware of the disease). Nevertheless, they did not actually account for the human behavioral changes that can reshape the underlying contact network, which in turn results in the coevolution of epidemics and network topology.[17–29]The failure of the heterogeneous mean-field approximation and microscopic Markov chain approaches to reflect the network evolution (due to behavioral changes in response to infection threat) is rooted in the lack of time evolution of edges in the total-degree-based approximation frameworks. To eliminate this shortcoming, Gross et al.[17]proposed an adaptive network epidemic model with adaptive rewiring of dangerous links, in which susceptible nodes are allowed to break away from their infected neighbors and reconnect towards other noninfected nodes. Despite the low complexity in the analytical formalism, this adaptive epidemic model revealed rich dynamical properties, such as bistability, oscillations and first-order phase transitions.[17,28]However,the low-dimensional formalism,in general,does not provide with high accuracy the time evolution of the disease progression and the underlying network topology. To this end,Marceau et al.[20]introduced an improved compartmental formalism in which nodes are classified into groups according to their total degree(namely,the total number of their neighbors)and their infectious degree (namely, the number of their infected neighbors).Since this formalism features the number of active neighbors associated with the state of infectiousness,in the rest of this paper we call it the effective degree formalism.Cai et al.[30]successfully addressed the dynamical correlation problem of the SIS epidemic model on complex networks by combing the heterogeneous mean-field theory[31–33]and the effective degree model. Ma et al.[34]applied the effective degree formalism to both the SIS and the SIR epidemic models and found that these two effective degree epidemic models give rise to different epidemic thresholds. Zhou et al.[35]have recently utilized the effective degree formalism in the study of disease and awareness spreading dynamics on multiplex networks,where excellent agreement was observed between theoretical predictions and stochastic simulations for the spreading dynamics.The authors further developed a partial effective degree theory with a mixture of the effective degree formalism for the contact network layer and the heterogeneous meanfield approximation for the information network layer.[35]In their work, however, the behavioral adaptations of individuals that could lead to network evolution have not been incorporated in the effective degree spreading model on multiplex networks.
In view of the practical consideration that an individual’s behavioral adaptations(e.g.,activity reduction[36,37])could be affected by their own infection state and their awareness of disease information,[37,38]it is of significance to integrate the awareness-related behavioral adaptations into the spreading dynamics of epidemic and awareness on multiplex networks.In this paper,we apply the effective degree approach to modeling the simultaneous contagion dynamics of an SIS epidemic transmission and a UAU awareness propagation on adaptive multiplex networks with awareness-dependent rewiring in the physical contact network layer.Our model is described in Section 2 and formalized in Section 3. Threshold conditions of disease outbreak and awareness information invasion are analyzed for the full effective degree model in Section 4 and the lower bounds of the threshold conditions are derived for a reduced model with some special case in Section 5. Simulation results are presented in Section 6, where the effects of adaptive rewiring and awareness diffusion on the epidemic threshold and epidemic prevalence are analyzed and the critical phenomenon in the reliance of epidemic onset on awareness diffusion is highlighted. Our conclusions are drawn in Section 7.
2. The SIS-UAU contagion model on adaptive multiplex networks
We start with a two-layer multiplex network,as shown in Fig. 1, consisting of an awareness (information) layer and an epidemic(physical contact)layer. The awareness layer represents the online social(or communication)network where individuals propagate disease information to their neighbors on the same layer,while the epidemic layer stands for the physical contact network on which individuals transmit disease when infected individuals have a physical contact with susceptible ones. The nodes between the two layers form a one-to-one correspondence as illustrated by the dashed lines in Fig. 1;each dashed line indicates a correspondence for the same node.Namely, both layers contain exactly the same nodes. However, the connectivity patterns in the two layers are different from each other since the edges in different layers represent different types of relationships. This means that the degree distributions are distinct between the two layers.
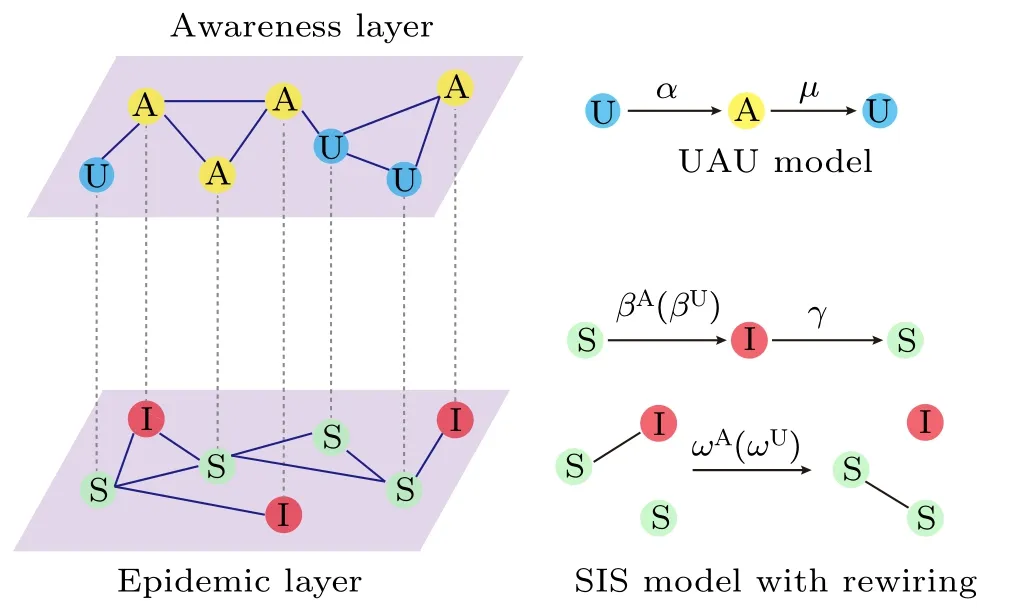
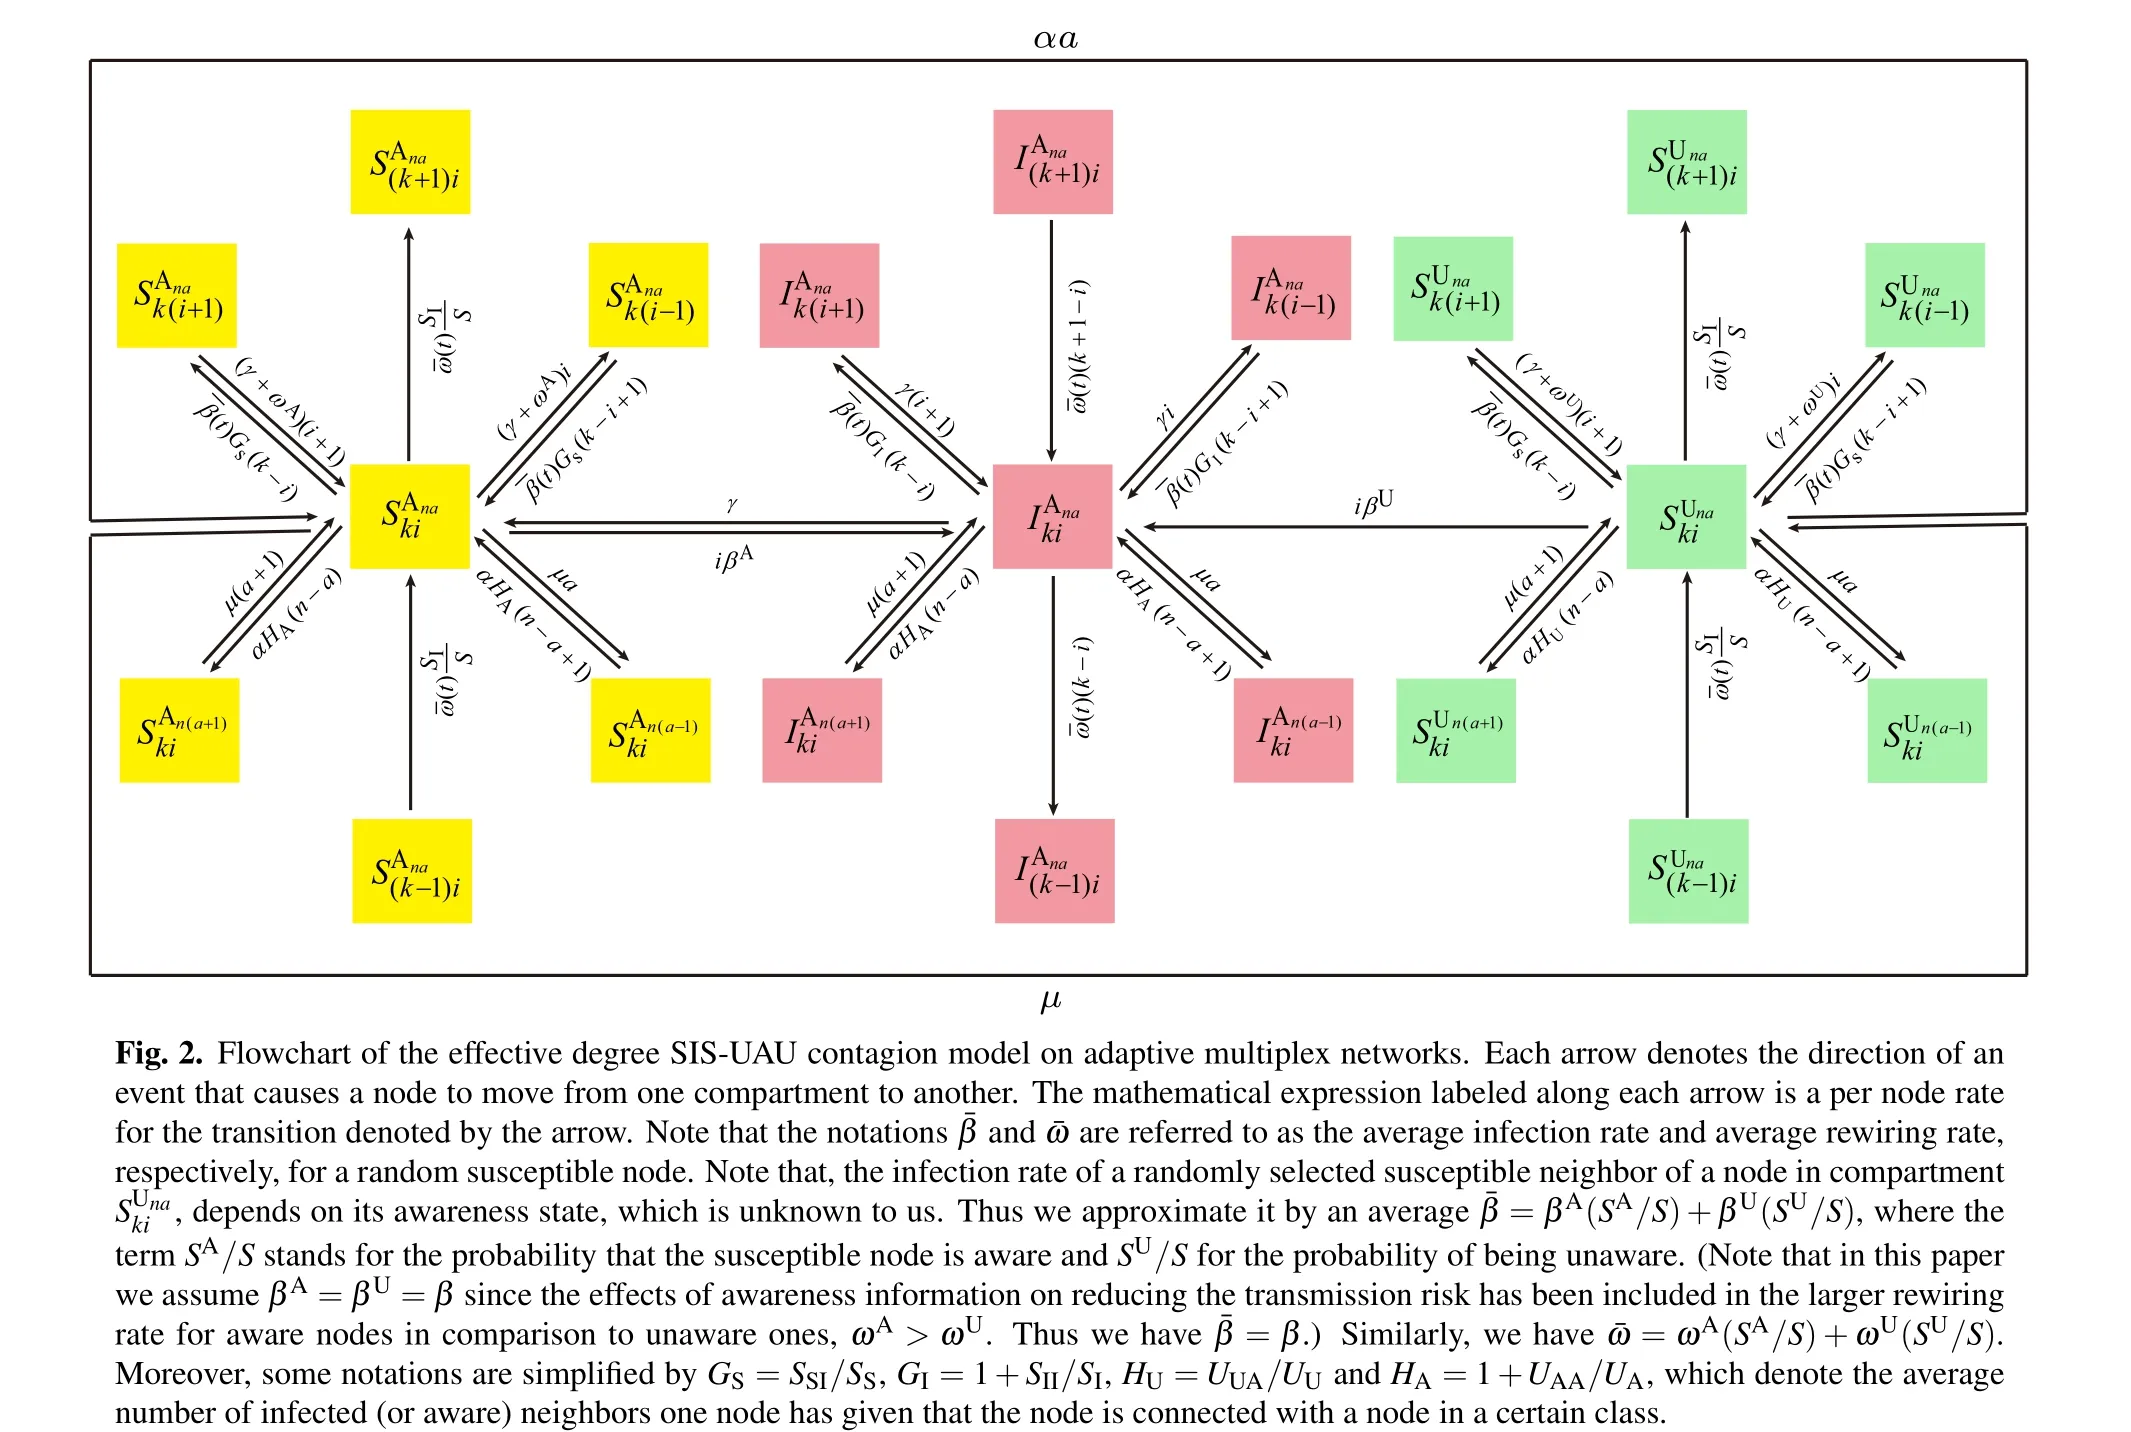
Fig. 1. Flowchart of the multiplex network spreading model of an SIS epidemic process and a UAU awareness propagation process, where the events of adaptive rewiring of dangerous (infectious) contacts (that connect an infected node and a susceptible one) randomly occurs in the epidemic layer.In the awareness layer,unaware nodes become aware after they are informed of disease information by an aware neighbor at a rate α, whereas an aware node returns to being unaware again after it forgets the disease information at a rate µ. In the epidemic layer, susceptible nodes are infected by their infected neighbors at a transmission rate that depends on the awareness state of the susceptible; here we denote by βA (resp., βU) the transmission rate for aware(resp.,unaware)susceptible nodes. Meanwhile,each infected node recovers to become susceptible again at a rate γ. In addition,for each infectious connection linking an infected node and a susceptible one, the susceptible will break the connection away from the infected and rewire towards a randomly selected susceptible(other than the original susceptible and its existing neighbors)at a rewiring rate,which is dependent on the awareness state of the original susceptible node. Here we denote by ωA(resp.,ωU)the rewiring rate for the aware(resp.,unaware)susceptible nodes.
In the awareness layer we adopt the UAU model proposed by Granell et al.[18]for the diffusion of awareness information on the disease,where each individual is in one of the two discrete states: aware (A) or unaware (U), representing whether or not they have acquired the disease information. Unaware individuals become aware at a diffusion rate α by communication with their aware neighbors (where the notations in the model definition are summarized in Table 1). In addition,unaware individuals will directly become aware with probability 1 once they get infected via disease-causing physical contacts.Meanwhile,each aware individual becomes unaware again at a rateµ after it forgets the awareness or no longer cares about it.
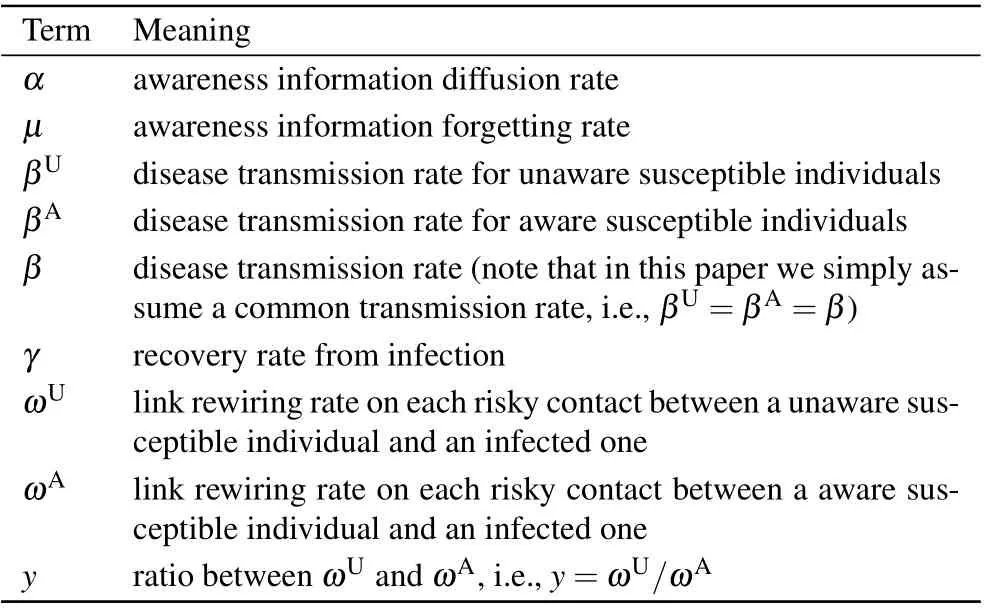
Table 1. Notation used in the model definition.
In the epidemic layer we consider an SIS epidemic process with awareness-dependent link rewiring, where each individual is in one of the two distinct sates: susceptible (S)or infected (I). The transmission rate for aware (resp., unaware) susceptible nodes is βA(resp., βU), the recovery rate for each infected node to return to the susceptible sate is γ,and the adaptive rewiring rate for the aware (resp., unaware)susceptible node belonging to each susceptible-infected(S–I)edge to rewire away from the infected node and connect towards another randomly selected susceptible node is ωA(ωU).Since awareness of disease infection often induces individuals to take preventive measures to evade or reduce the risk of infection in the epidemic layer,[39]it is natural to assume βA≤βUand ωA≥ωU. For the sake of simplicity, we set ωU=yωAwith 0 ≤y ≤1; here y=0 means unaware individuals take no self-protective measures at all,whereas y=1 means the rewiring rate for susceptible nodes is independent of their awareness state. It is worth mentioning that in the present paper we simply assume βA=βU=β and ωA>ωU.That is,we do not differentiate the transmission rate between aware and unaware susceptibles, since the impact of awareness information on reducing the risk of infection has already been reflected in the larger rewiring rate for aware susceptibles than unaware ones. Moreover,in our model the link rewiring process and the disease transmission process take place simultaneously but independently.
Note that most existing concurrent spreading models on multiplex networks have assumed a fixed network structure in each layer,whereas in our model the network structure in the epidemic layer coevolves with the epidemic dynamics due to adaptive rewiring of disease-causing contacts. In this sense we refer to our model as the SIS-UAU contagion model on adaptive multiplex networks. For the sake of simplicity,in the present work we only consider the network evolution of the epidemic layer and hypothesize that the network topology in the awareness layer does not change during the process of the concurrent spreading of epidemic and awareness,though in reality the connectivity pattern in the awareness layer may also evolve with time.
3. Effective degree model formulation
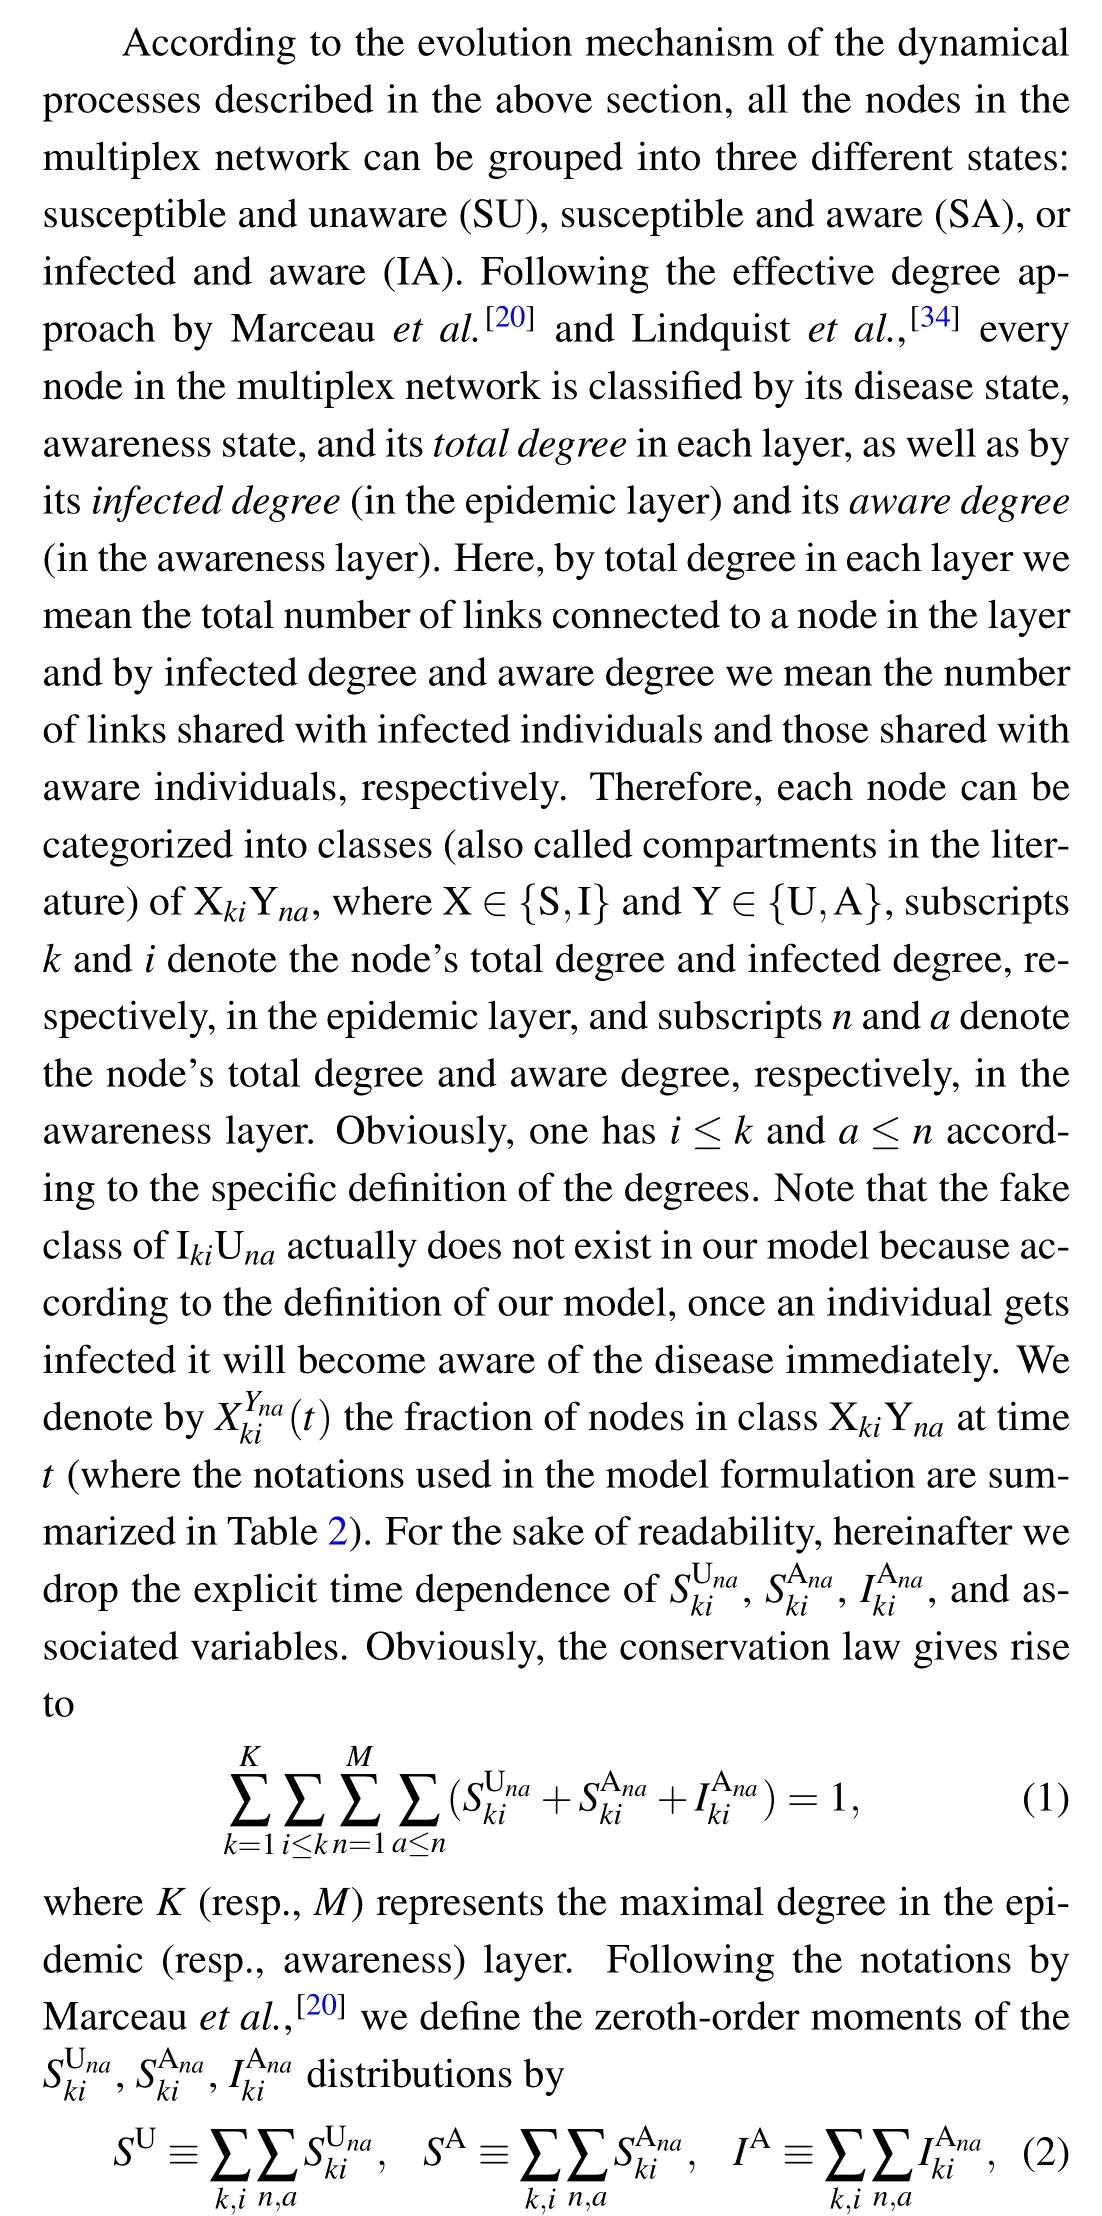
the first-order moments by

and the second-order moments by
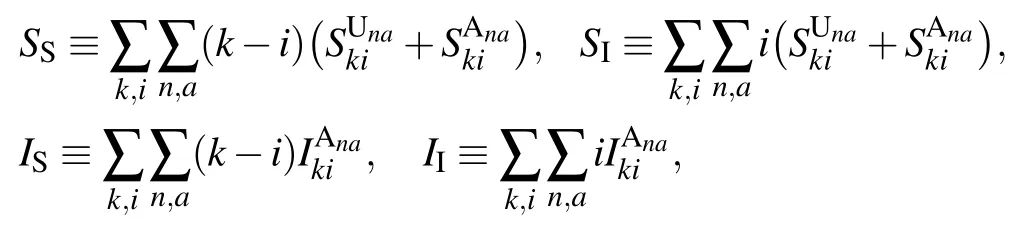
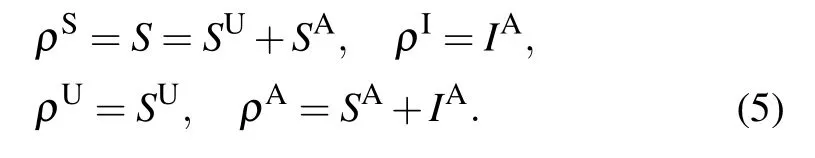
Here, the physical meaning of the zeroth-order moments in Eq.(2)is in essence the density of SU,SA and IA nodes. For convenience,let us denote by ρS,ρI,ρUand ρAthe density of susceptible, infected, unaware and aware nodes, respectively,in the network. Then it is straightforward to get the following relations:
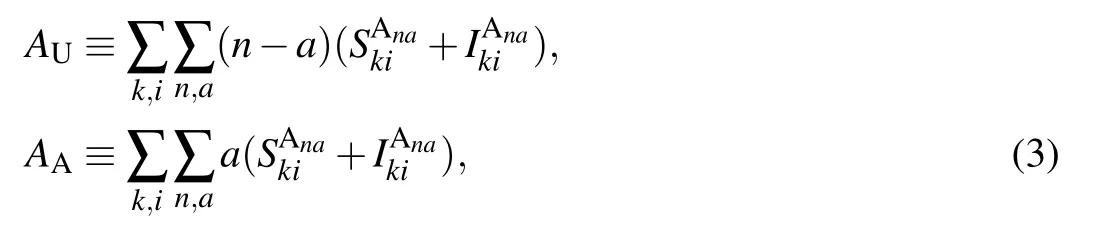
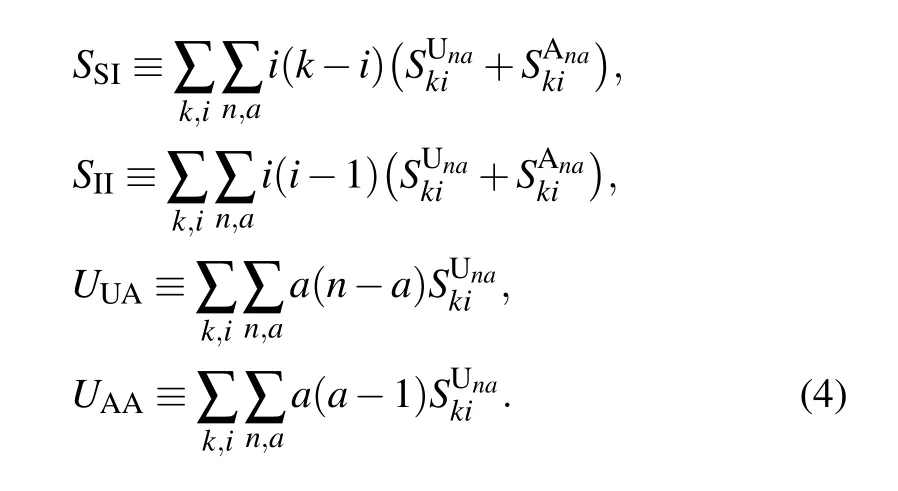
The first-order moments in Eq. (3) represent the density per node of the various types of arcs. (Here, the arcs are defined as the directional links between a pair of nodes. Therefore each undirected edge in the network actually contains two directional arcs.[20]) For example, the quantity SSdenotes the density of S–S links emanating from susceptible nodes, and UAdenotes the density of U–A links emanating from unaware nodes.The second-order moments in Eq.(4)correspond to the density per node of the various types of triplets in the entire network. A triplet is referred to as the union of two directional links surrounding the same central node.[20]For example,the quantities SSIand UAAdenote the density of triplets of types S–S–I and A–U–A with the central node in class S and U,respectively. Clearly, it follows from Eqs. (1), (2) and (5) that the conservation of nodes

and the conservation of links

must hold at any time.[17,20]Here〈k〉and〈n〉are the average degree in the epidemic and awareness layer,respectively. Furthermore,since the network under consideration is undirected,the density of S–I links must equal the density of IS links;similarly,the density of UA links is equal to the density of AU links. This leads to the following constraints[20,34]

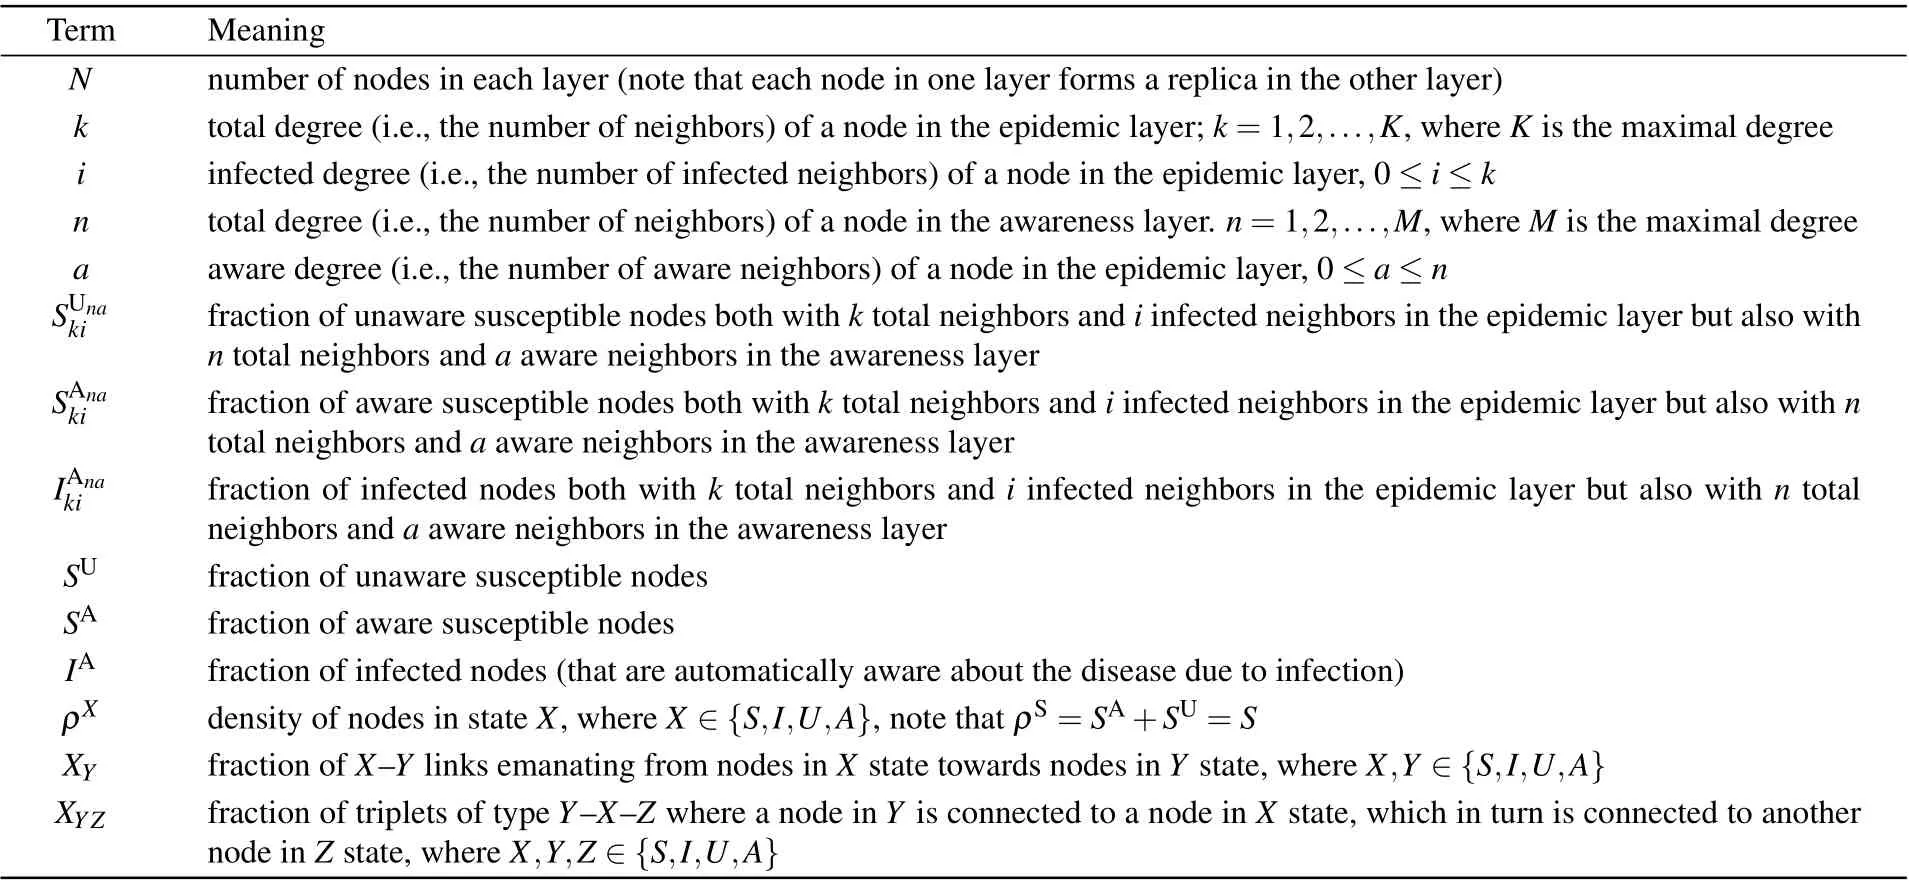
Table 2. Notation used in the model formulation and analytical approximation.
Based on our model definition stated in Section 2,at each time step, nodes in each class undergo the following three types of variations. First, nodes can change their state and move to the corresponding class with the same subscripts.Second, nodes can move to other classes due to changes of the state of their neighbors in either network layer. Third, nodes can change to other classes due the effects of adaptive rewiring of infectious contacts in the epidemic layer.
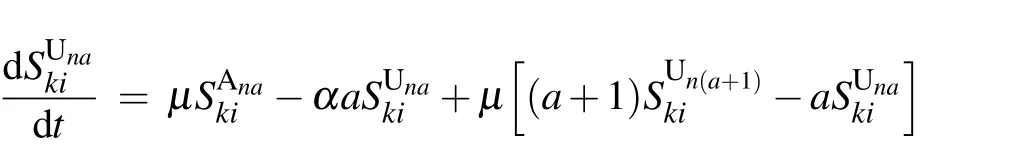
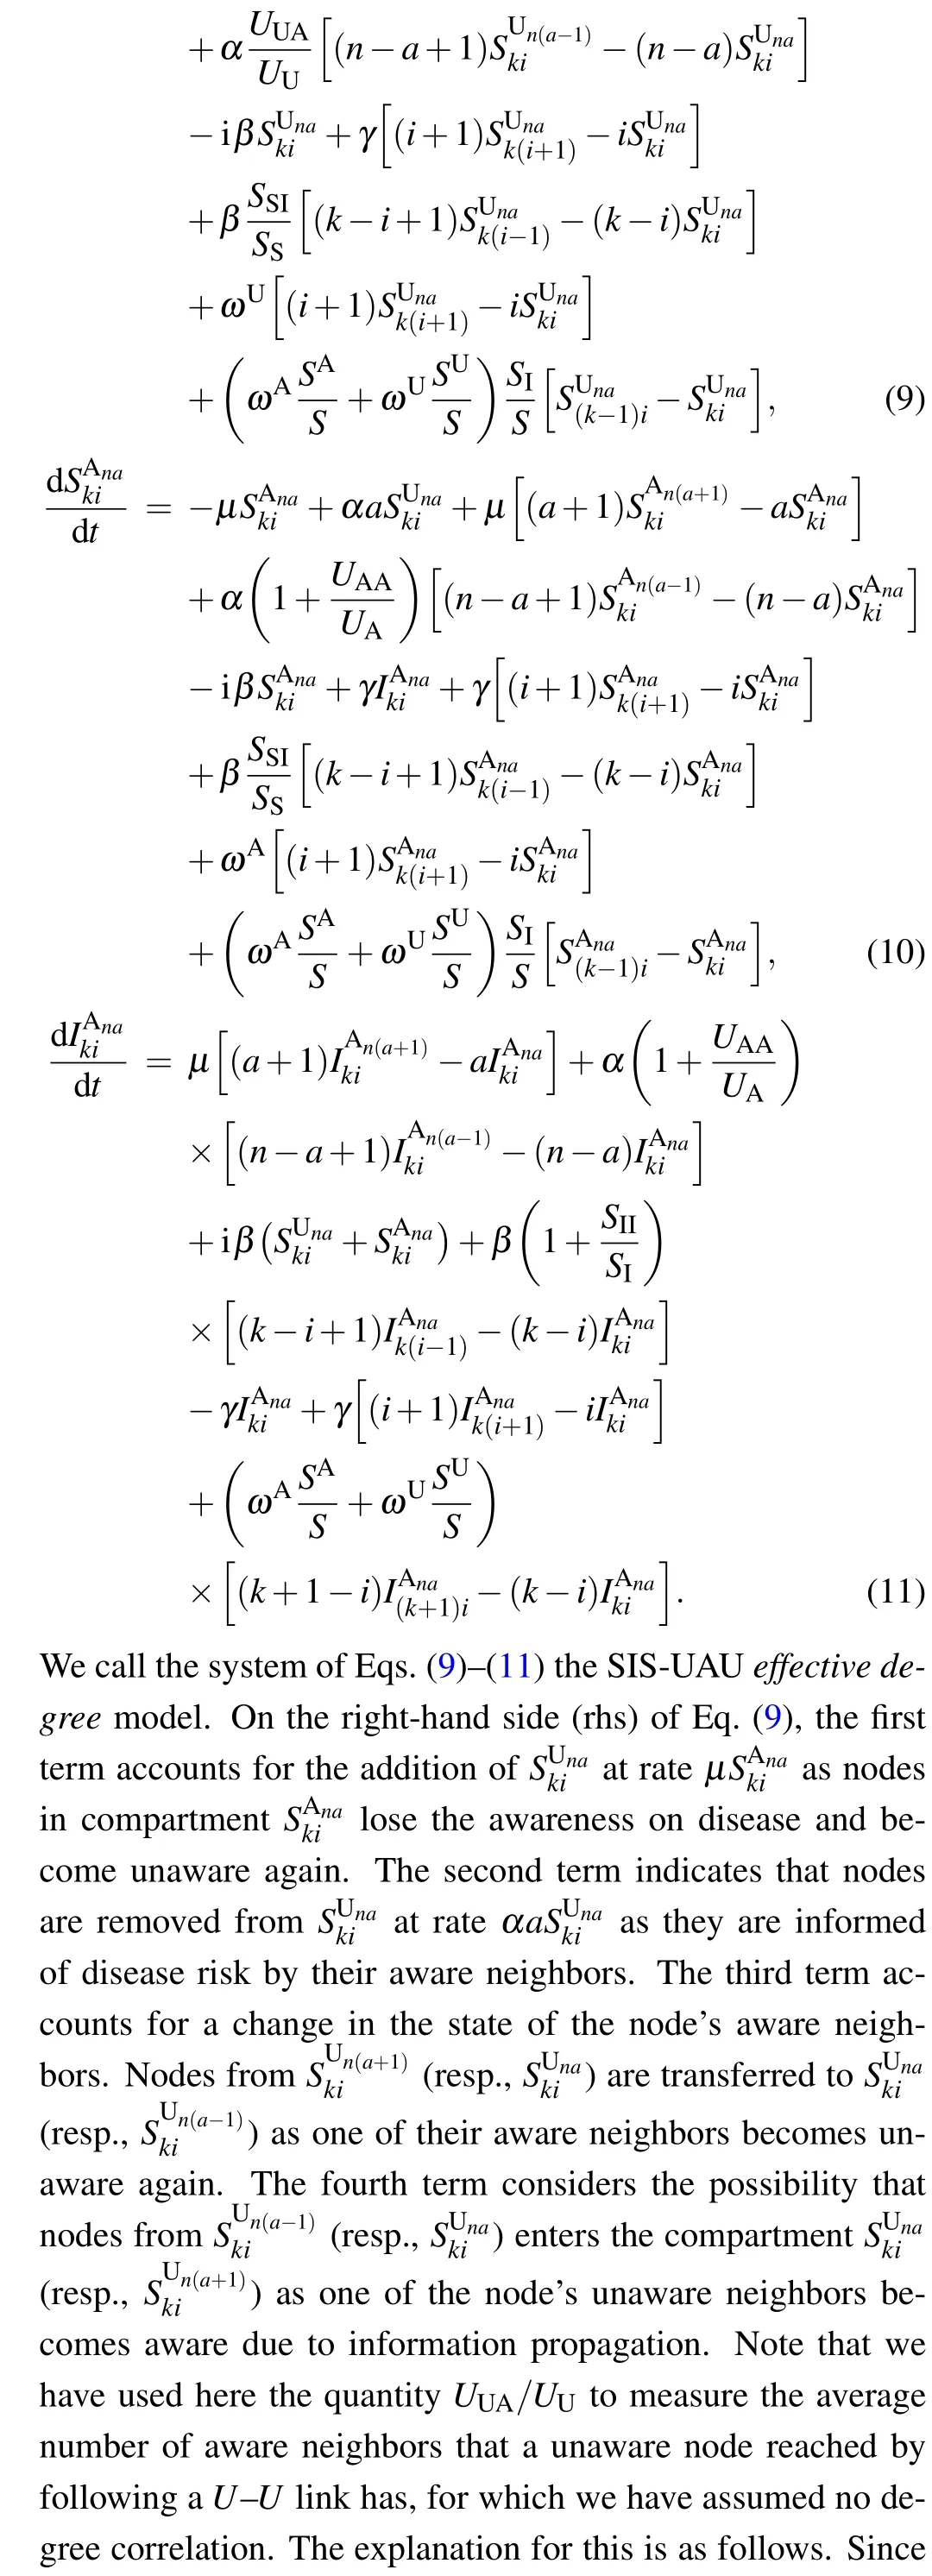
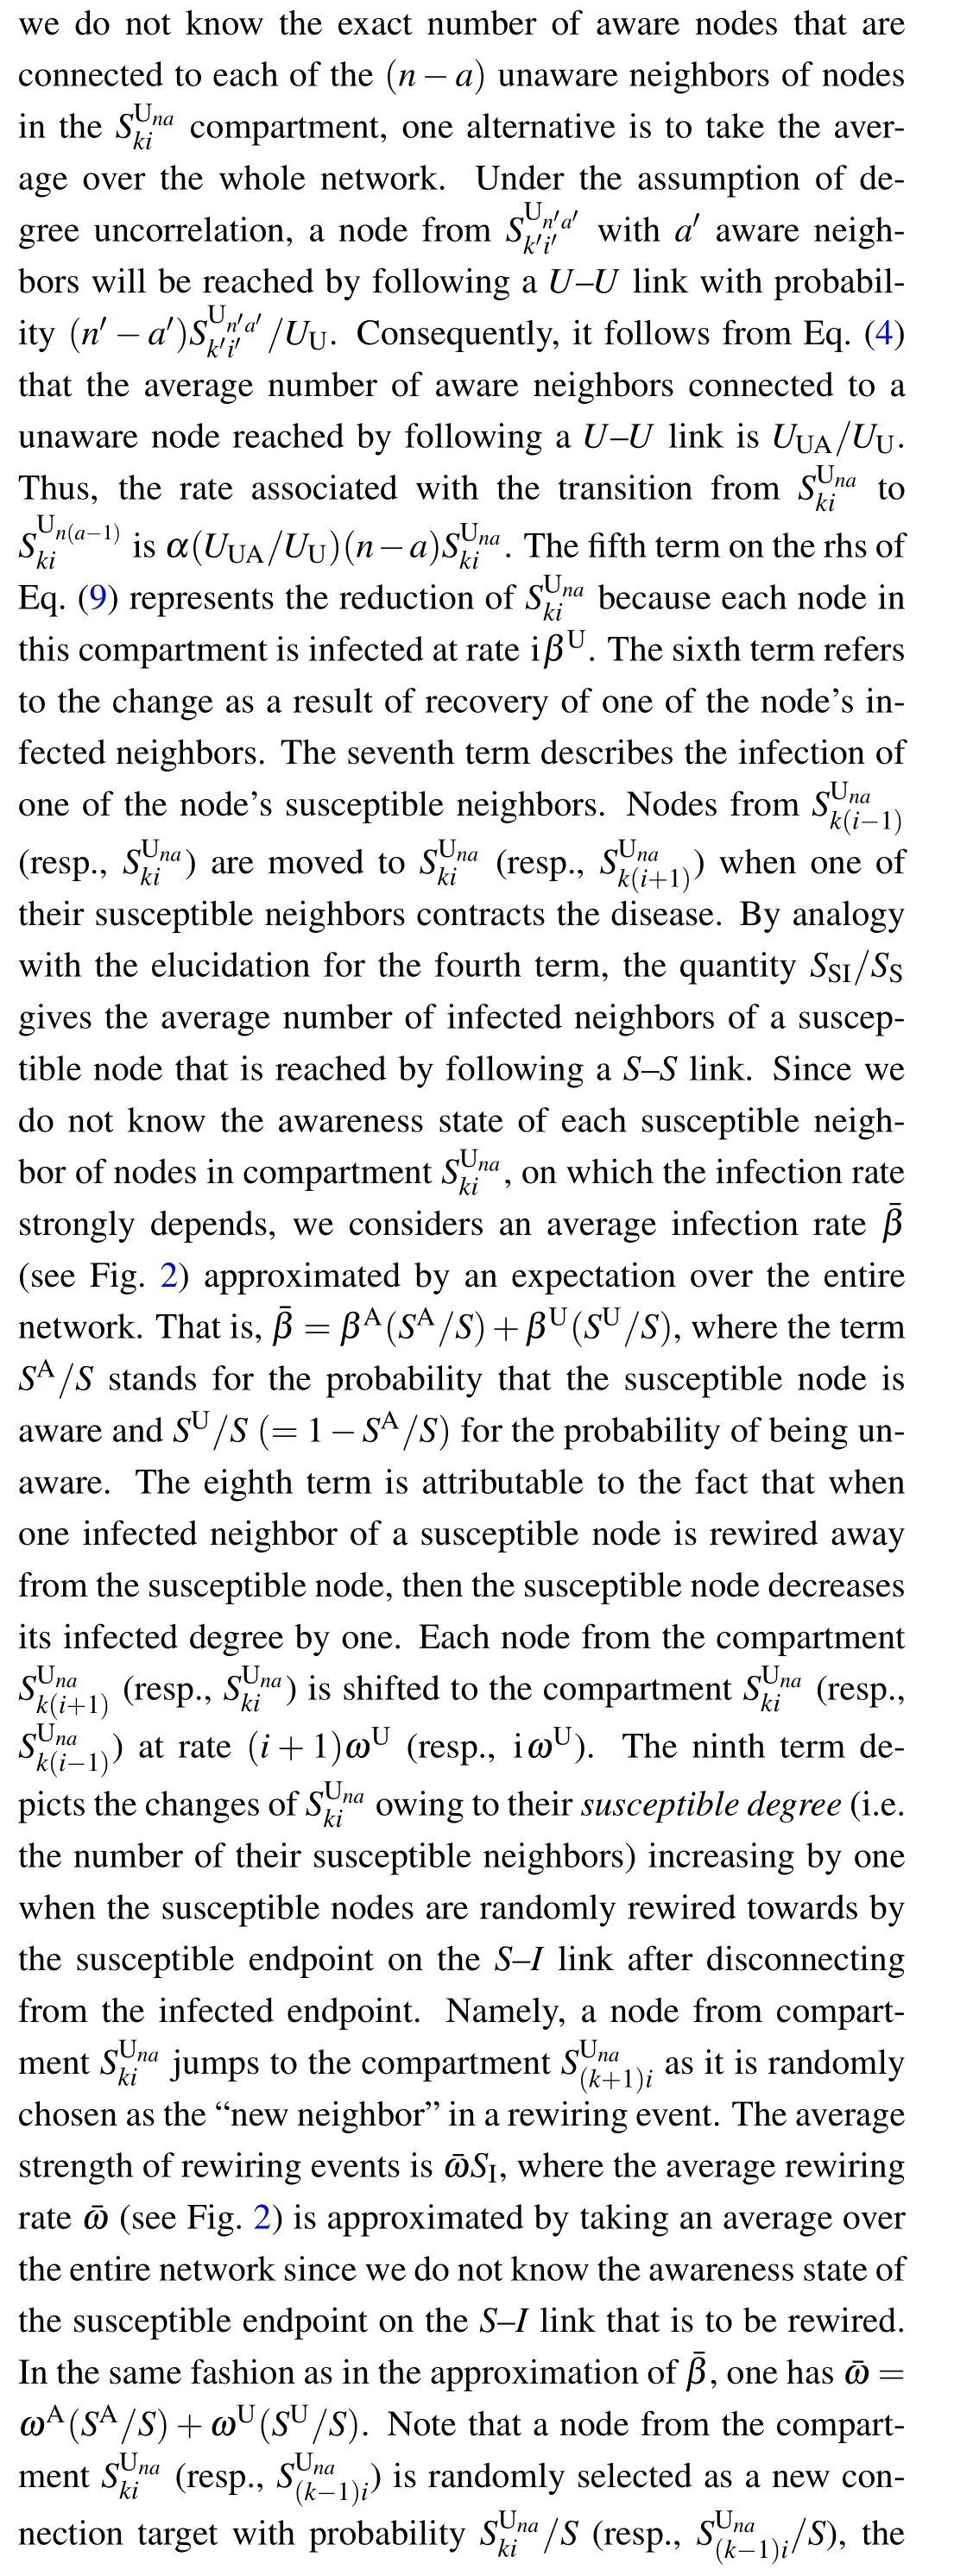
According to the flow chart for the SIS-UAU transmission process presented in Fig. 2, we obtain the set of3(k+1)(n+1)=3KM(K+3)(M+3)/4 differential equations that govern the temporal evolution of the nodes in each class for{(k,i;n,a):1 ≤k ≤K,0 ≤i ≤k;1 ≤n ≤M,0 ≤a ≤n}as follows:

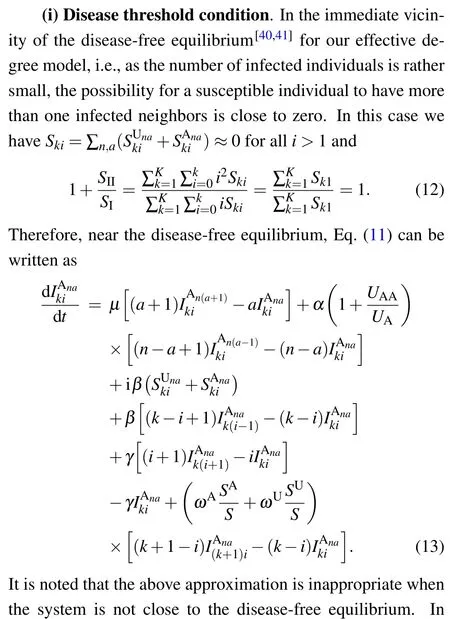
4. Threshold analysis for the full effective degree model
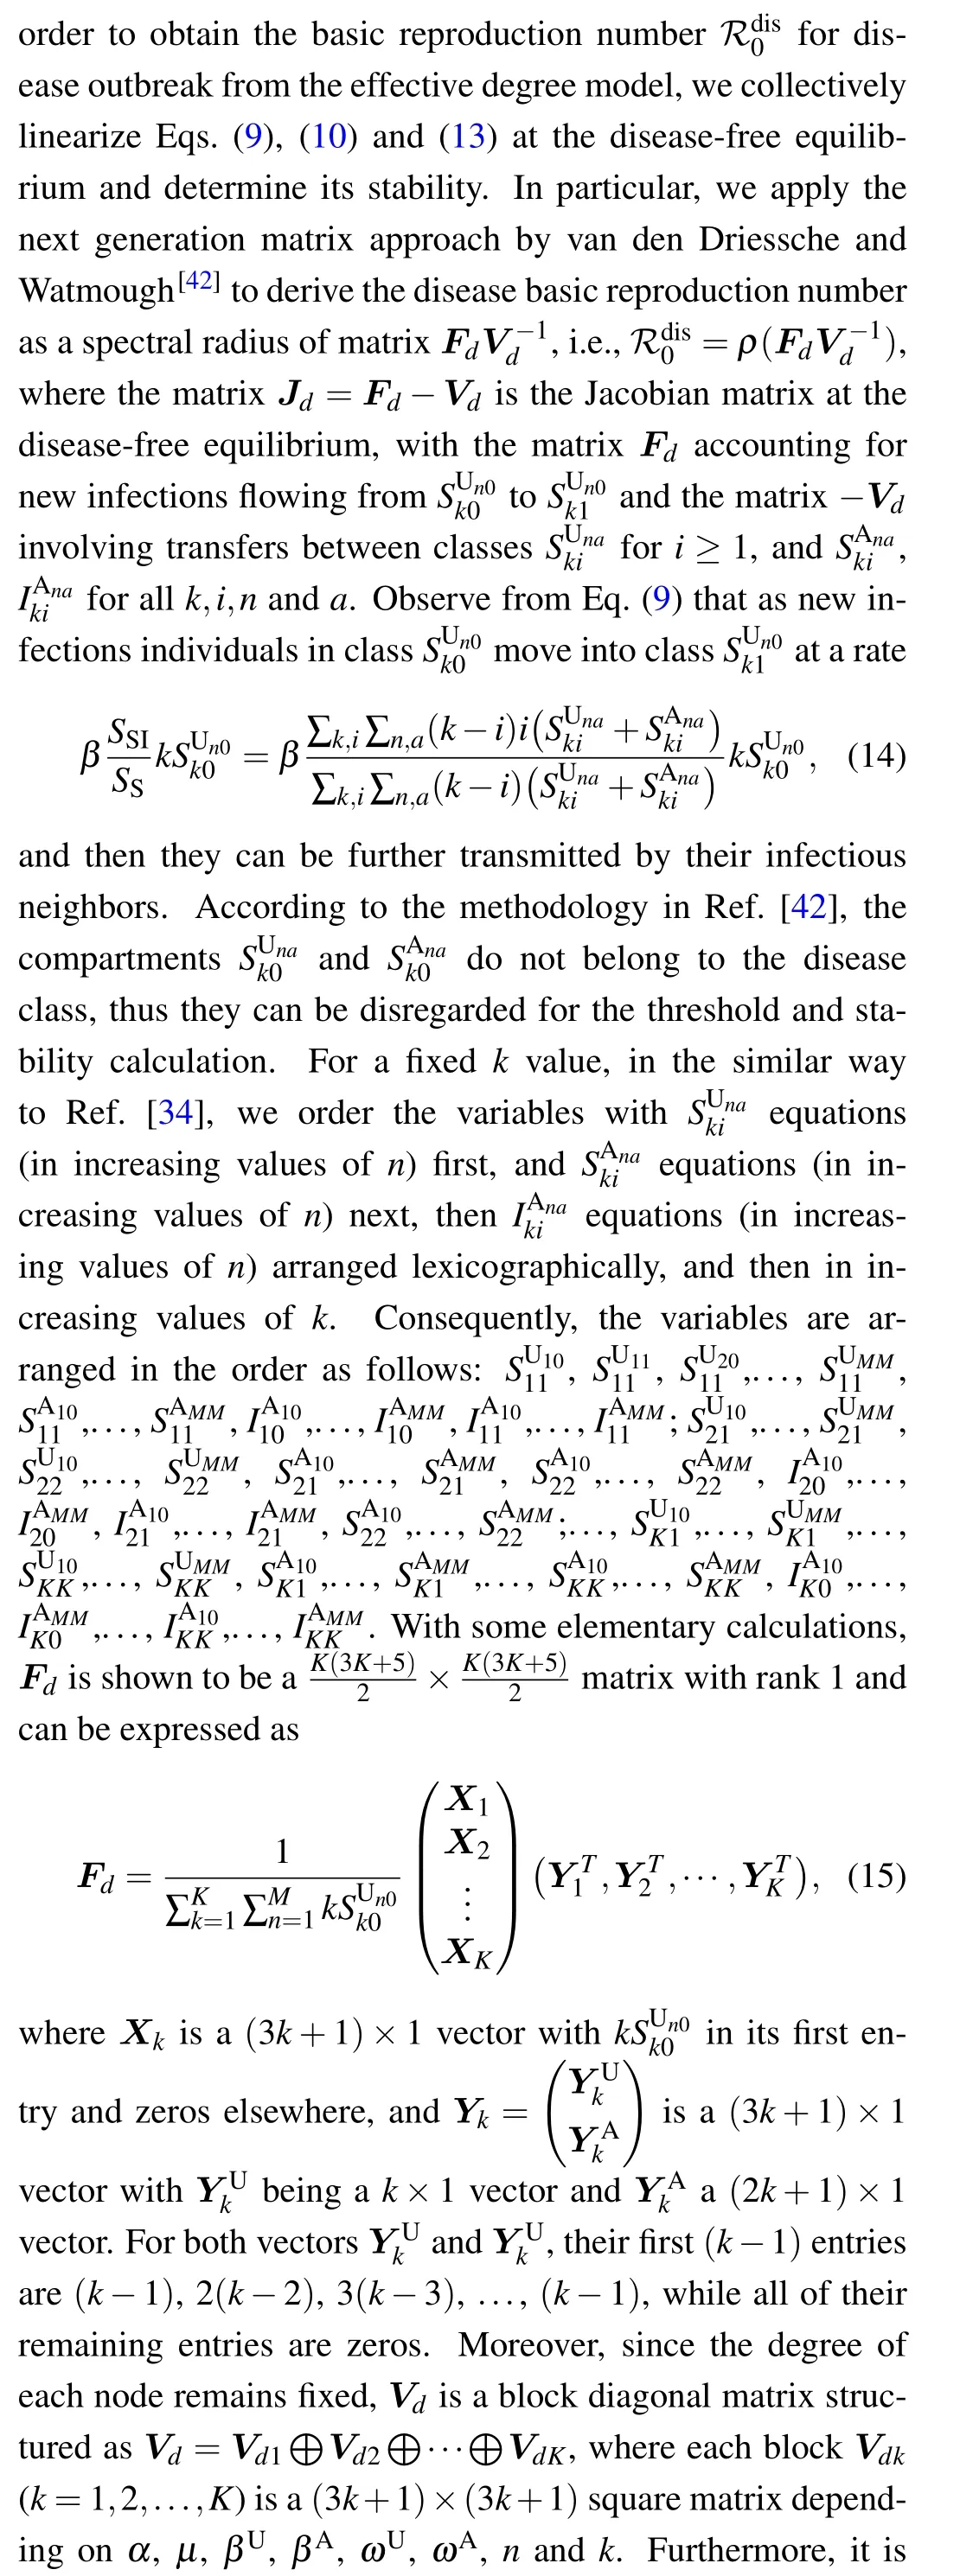
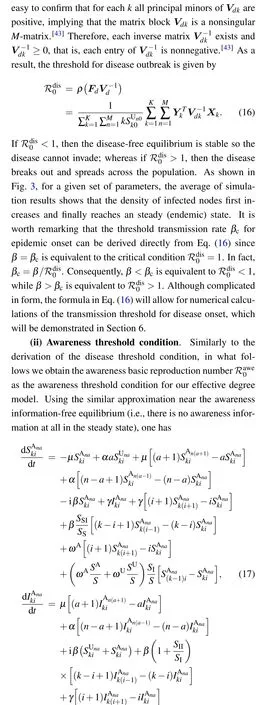
In what follows, much attention will be concentrated on the threshold conditions for disease invasion and awareness information outbreak. In the context of epidemiology, one of the best known quantities that account for the threshold condition for disease invasion is the basic reproduction number ℛ0,which is defined as the average number of new infections produced by a single infected individual (during its entire infectious period) in a completely susceptible population.[10,40,41]Typically,if ℛ0>1,the disease will break out and finally remains endemic in the population; if ℛ0<1, the disease will eventually die out.
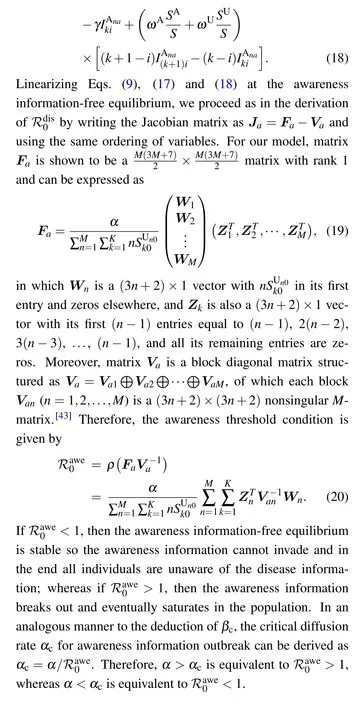
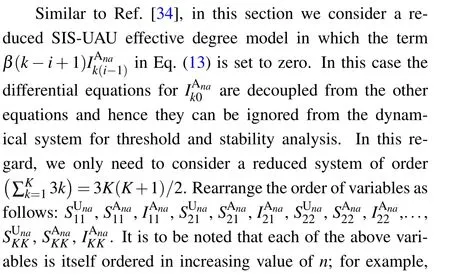
5. Disease reproduction number in a reduced effective degree model

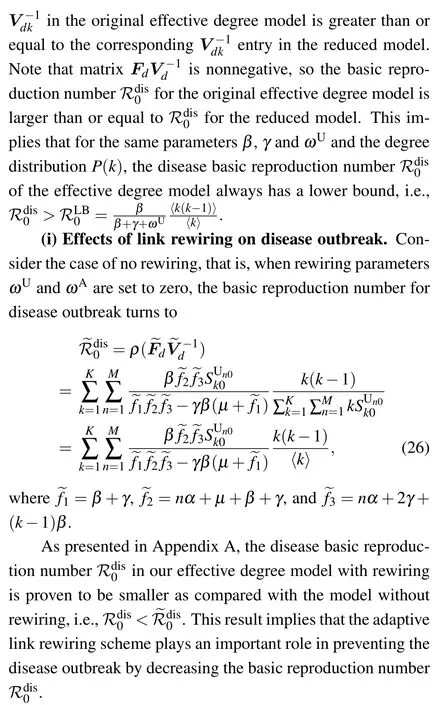
(ii)Special case: the model without awareness contagion. Consider the special case when the awareness layer is absent, namely, there is no awareness information propagating among the population,then the original two-layer network effective degree model is degenerated into a single-layer network effective degree model (which was studied numerically by Marceau et al.,[20]where the theoretical disease outbreak threshold was not provided). In addition, each node only has one of the two states:susceptible or infected,and does not possess the awareness information states. Moreover,there is only one parameter ω for link rewiring for all susceptible nodes(i.e.,ωU=ωA=ω)and there are no parameters for information contagion(i.e.,α =µ =0). Thus,in this case,the basic reproduction number for disease outbreak becomes
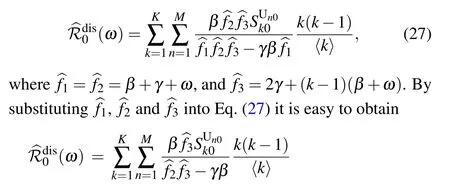
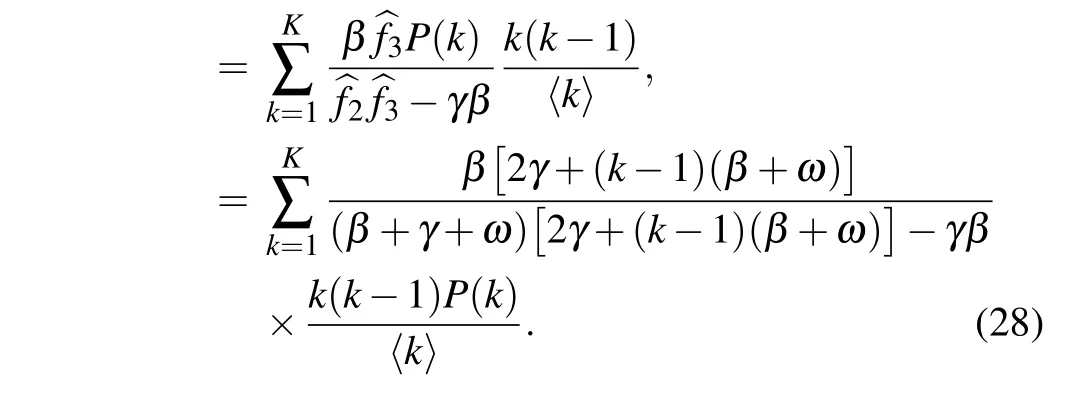
As the rewiring process is removed from the model, i.e., if ω =0,then the basic reproduction number turns into

which reproduces the result obtained by Lindquist et al. (see Appendix C in Ref.[34]).Moreover,since k ≥1,it can be easily verified that for any positive rewiring rate ω,the following inequality holds:
Therefore,one has for ω >0
which highlights the important role of the adaptive rewiring in decreasing the disease reproduction number and hence hampering the disease outbreak.
6. Simulation results
In this section, numerical computation and stochastic simulation have been carried out to verify the theoretical analysis for our effective degree model. In the simulation,the network size (i.e., the number of nodes) is set to N =104. Initially, all nodes are set to be susceptible and unaware of disease information,and then 10%of nodes are randomly chosen as the infected seeds that will trigger the contagion process across the network in both layers.
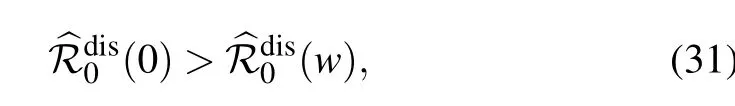
In Fig. 3, we present the results of 100 stochastic simulations for the temporal evolution of the fraction of infected nodes on an artificial multiplex networks with both layers initially set as scale-free. Each grey solid curve represents an independent simulation trajectory, while the red dash-dotted curve is the average simulation result. It is illustrated that although there are evident fluctuations in the time required to reach the expansion phase and the final size(which is largely due to the impact of random events in the early stage), the proportion of infected nodes eventually reaches the stationary state,meaning the disease becomes endemic.
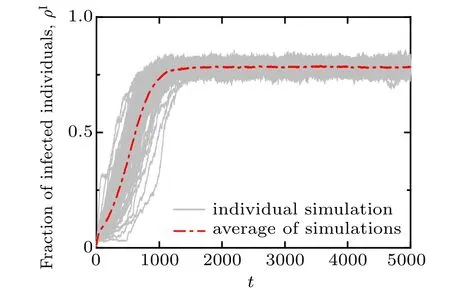
Fig.3. Time series of the density of infected nodes ρI. The simulation results are obtained by running the disease-awareness contagion model with 10% of infected seeds on an initial scale-free multiplex network, in which the disease transmission layer is initially assigned with a power-law degree distribution P(k)∝k−2.5,whilst the awareness information layer is initially assigned a power-law degree distribution Q(n)∝n−3.5, both with degree values ranging from 1 to 10. Each grey (thin) curve denotes an individual simulation result and the red(thick)dash-dotted curve marks the average of the 100 individual simulations. Other parameters are α =0.04, β =0.2,µ =0.1,γ =0.02,ωA=0.02,ωU=0.004.
To further investigate the effects of parameters on disease transmission,we report the density ρIof infected nodes[given by Eq. (5)] as a function of the disease transmission rate β with different values of other parameters in an initial multiplex network with Poisson degree distributions and power-law degree distributions in Figs.4 and 5,respectively. Direct comparison between the results in Figs. 4 and 5 reveals that the initial network structures have little impact on the qualitative behavior of the ρIversus β bifurcation dynamics. It is worth emphasizing that the effect of initial network setting can be ignored since the process of link rewiring causes the network to converge to an randomly connected network with a Poisson degree distribution.[17,26]As shown in Fig. B1 in Appendix B,in the case of adaptive rewiring,the resulting network will converge to a narrowly distributed degree distribution even if the initial network setting is a perfect power law. Therefore,from now on,in our simulations we will simply apply an initial scale-free network setting just as performed in Refs.[8,11,13].As shown in Figs.4(a)and 5(a),with the increase of the information forgetting rateµ from 0.04 to 0.1,the disease outbreak threshold decreases slightly and the value of ρIrises correspondingly when the disease breaks out. This suggests that the disease outbreak threshold is not much sensitive (i.e., it is relatively robust) to the information forgetting rate. As illustrated in Figs. 4(b) and 5(b), with the increase of the information propagating rate α, the disease prevalence ρIincreases accordingly when the disease breaks out.However,the disease outbreak threshold almost remains unchanged for the small values of α =0 and α =0.01. However,as α becomes large enough(in this case α=0.04 and α=0.08),the disease threshold grows evidently with α.This implies a possible critical phenomenon in the dependence of the disease threshold βcon the information spreading rate α. That is, there exists a critical value αcsuch that only when α <αcwill βcgrow with α,otherwise βckeeps unchanged. This meta-critical behavior is further verified in Fig. 6(a). The enhancement of disease information propagation would help to reduce the infectious disease prevalence to some extent.Nevertheless,from the perspective of disease prevention,only a large enough information diffusion rate will help enlarge the disease threshold to curb the onset of disease. In Figs.4(c)and 5(c),it is shown that,as is expected,increasing the recovery rate γ from disease infection will help to impede the disease transmission by enlarging the disease threshold as well as reducing the epidemic prevalence ρI. The larger the γ, the more infected the individuals turning back to the aware susceptible state,and hence the lower the infection risk in the population. What is more,it follows from Figs. 4(d) and 5(d) that enhancing the adaptive rewiring mechanism for informed susceptible individuals would help prevent the disease outbreak by raising the disease threshold and mitigate the epidemic transmission by diminishing the disease prevalence ρI. This can be expounded as follows. According to the adaptive rewiring mechanism,parts of susceptible individuals are separated from infected ones. The greater the rewiring rate is, the more the pathway for disease transmission will be interrupted, therefore the higher the disease transmission threshold and the lower the epidemic prevalence in case the disease prevails.
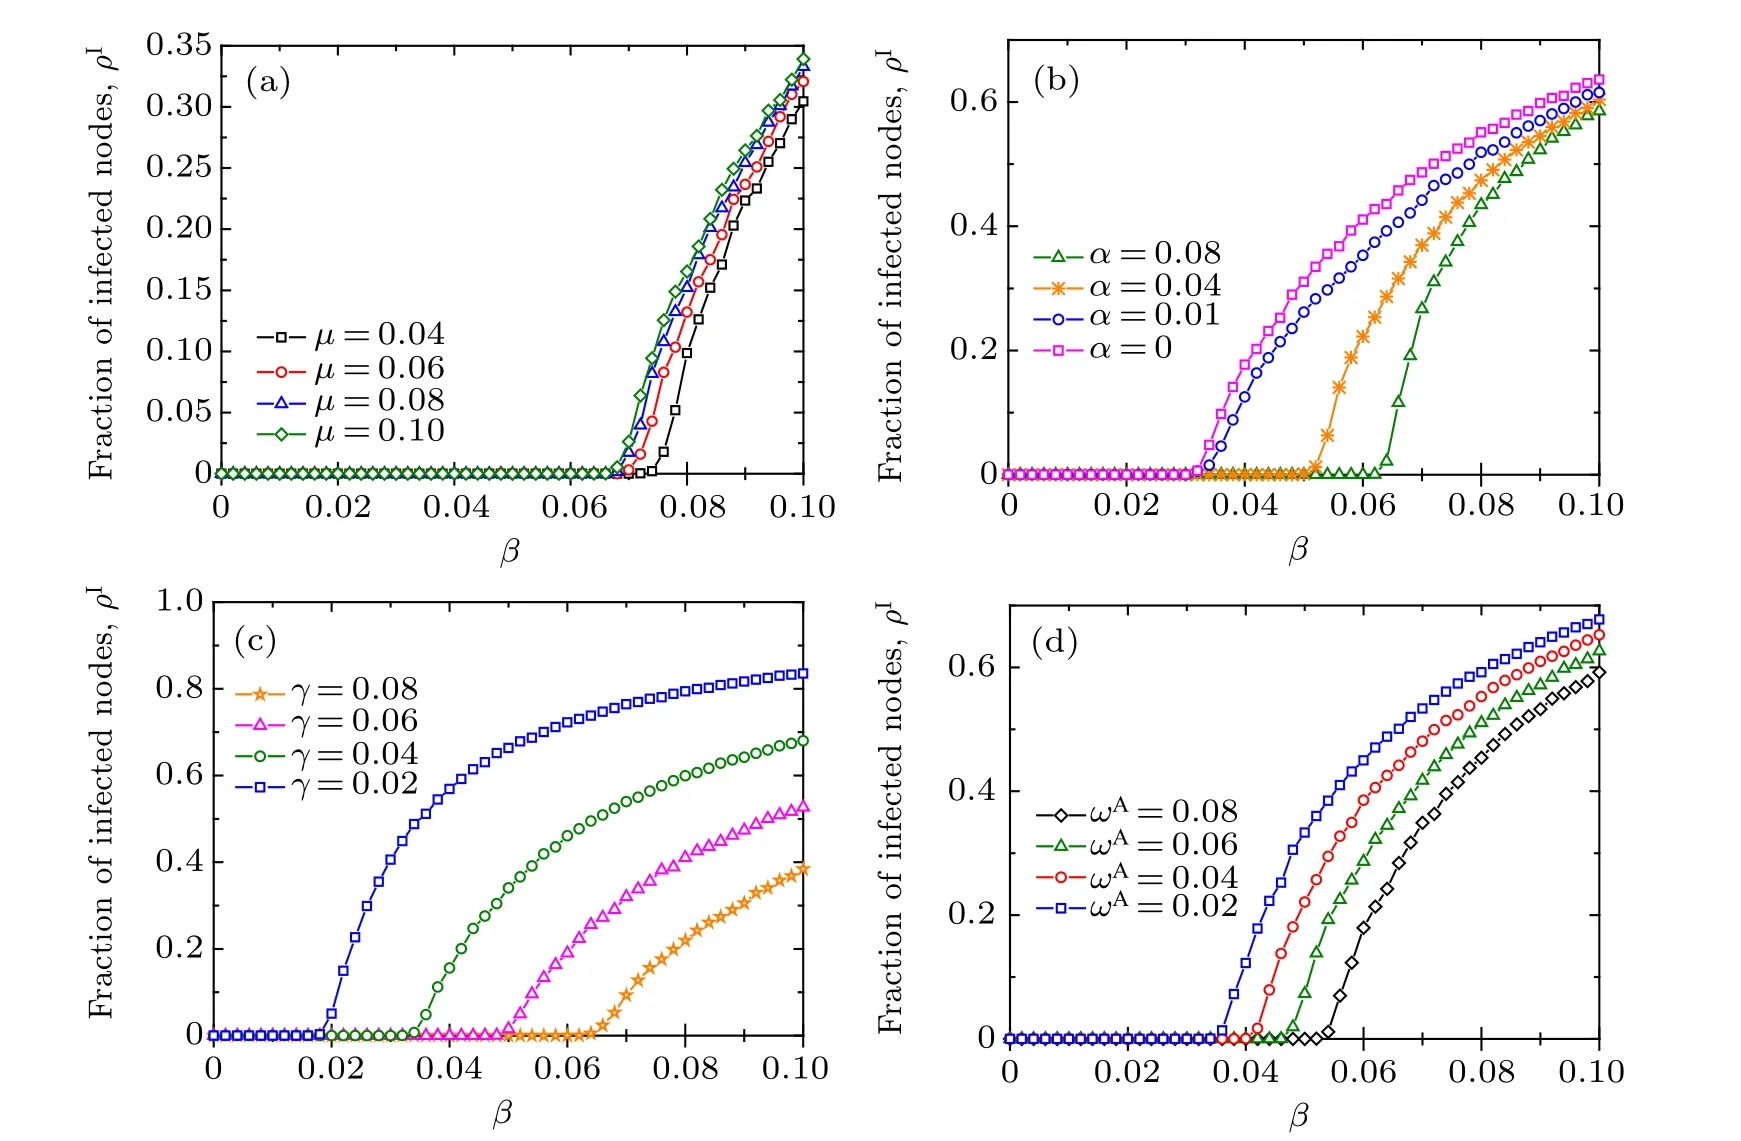
Fig. 4. The fraction ρI of infected nodes in the stationary state as a function of the disease transmission rate β for different values of (a)the awareness information forgetting rate µ,(b)the awareness information spreading rate α,(c)the recovery rate γ from disease,and(d)the rewiring rate ωA for aware susceptible individuals. In this plot,the results are obtained on an initial Poisson multiplex network,in which the disease transmission layer is initially assigned with a Poisson degree distribution P(k)∝2ke−2/k!, whilst the awareness information layer is initially assigned a power-law degree distribution Q(n)∝3ne−3/n!,both with degree values ranging from 1 to 10. Each point is obtained by averaging over 200 independent realizations. Other parameters are set in panels: (a)α =0.02,γ =0.08,ωA=0.05,ωU=0.01;(b)γ =0.04,µ =0.06,ωA=0.08,ωU=0.0016;(c)α =0.02,µ =0.06,ωA=0.02,ωU=0.004;(d)α =0.02,γ =0.04,µ =0.04,y=ωU/ωA=0.2.
In Fig. 6, we provide a clear comparison for the disease outbreak condition between theoretical analysis and stochastic simulations. In particular, as denoted by the color bar in the heat map, the density ρIof infected nodes in the steady state is mapped onto a two-parameter phase plane. In each panel of Fig.6,the theoretical results of disease outbreak threshold are tripartite. The disease threshold derived from Eq. (16) in the effective degree model is marked by solid curves,the disease threshold obtained from Eq.(24)in the reduced model is represented by empty circles,and the lower bound of disease threshold calculated based on Eq.(25)is indicated by dashed curves.As shown in Fig. 6(a), in the case of relatively low rewiring rate (ωA=0.01), the information diffusion rate α does not have much impact on the density ρIof infected nodes,which is greatly affected by the disease transmission rate β. By contrast,in the case of relatively large rewiring rates[ωA=0.08 in Fig.4(b)and ωA=0.05 in Fig.5(b)],the information diffusion rate α has substantial effects on ρI. This suggests that the combination of enhanced information propagation with forceful adaptive rewiring would play an important role in disease prevention and control. More importantly, though the lower bound of disease threshold is independent of α, both the disease transmission thresholds βcderived from our effective degree model and the reduced model demonstrate a metacritical point (αc,βc) [marked by the red filled circle in Fig. 6(a)] as previously reported in Ref.[18].
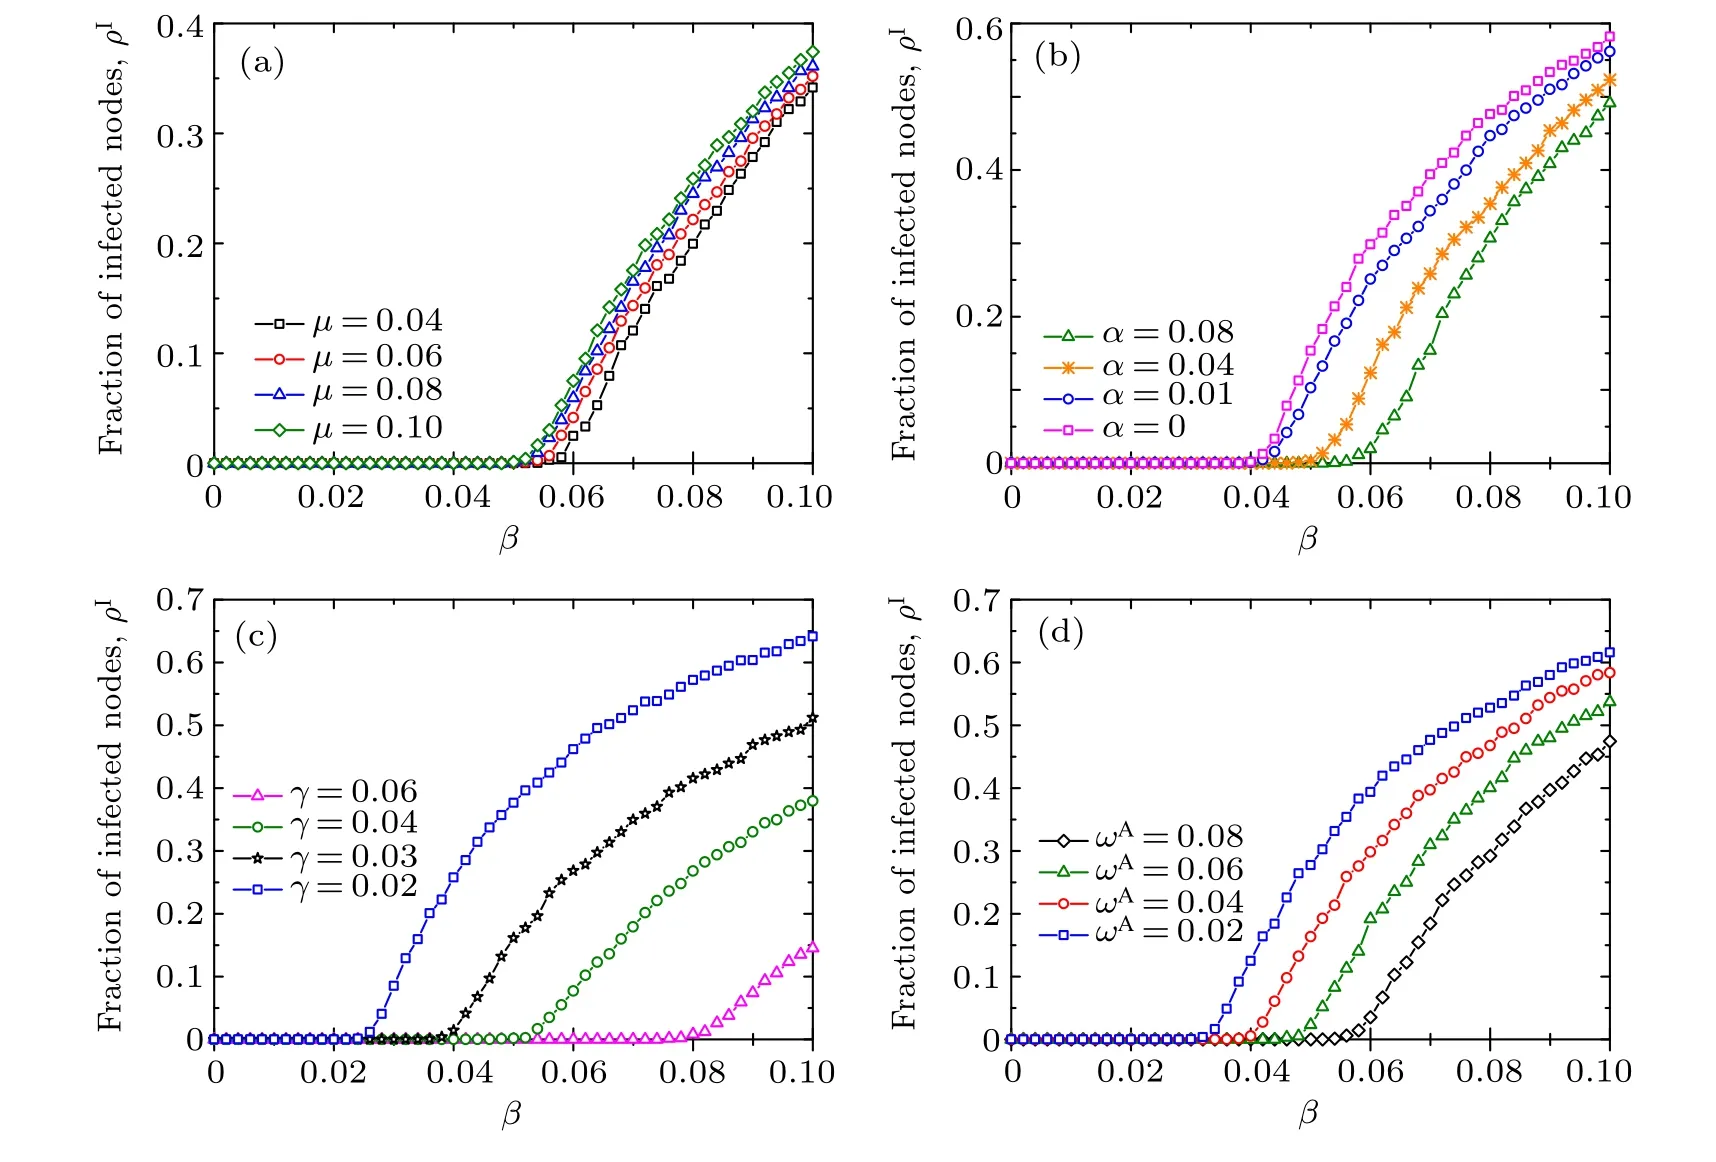
Fig. 5. The fraction ρI of infected nodes in the stationary state as a function of the disease transmission rate β for different values of (a)the awareness information forgetting rate µ,(b)the awareness information spreading rate α,(c)the recovery rate γ from disease,and(d)the rewiring rate ωA for aware susceptible individuals. In these plots,the results are obtained on an initial scale-free multiplex network,in which the disease transmission layer is initially assigned with a power-law degree distribution P(k)∝k−2.5, whilst the awareness information layer is initially assigned a power-law degree distribution Q(n)∝n−3.5, both with degree values ranging from 1 to 10. Each point is obtained by averaging over 200 independent realizations.Other parameters are set in panels:(a)α=0.08,γ=0.04,ωA=0.02,ωU=0.0004;(b)γ=0.02,µ =0.02,ωA=0.05,ωU=0.01;(c)α =0.02,µ =0.06,ωA=0.02,ωU=0.0004;(d)α =0.04,γ =0.02,µ =0.04,y=ωU/ωA=0.2.
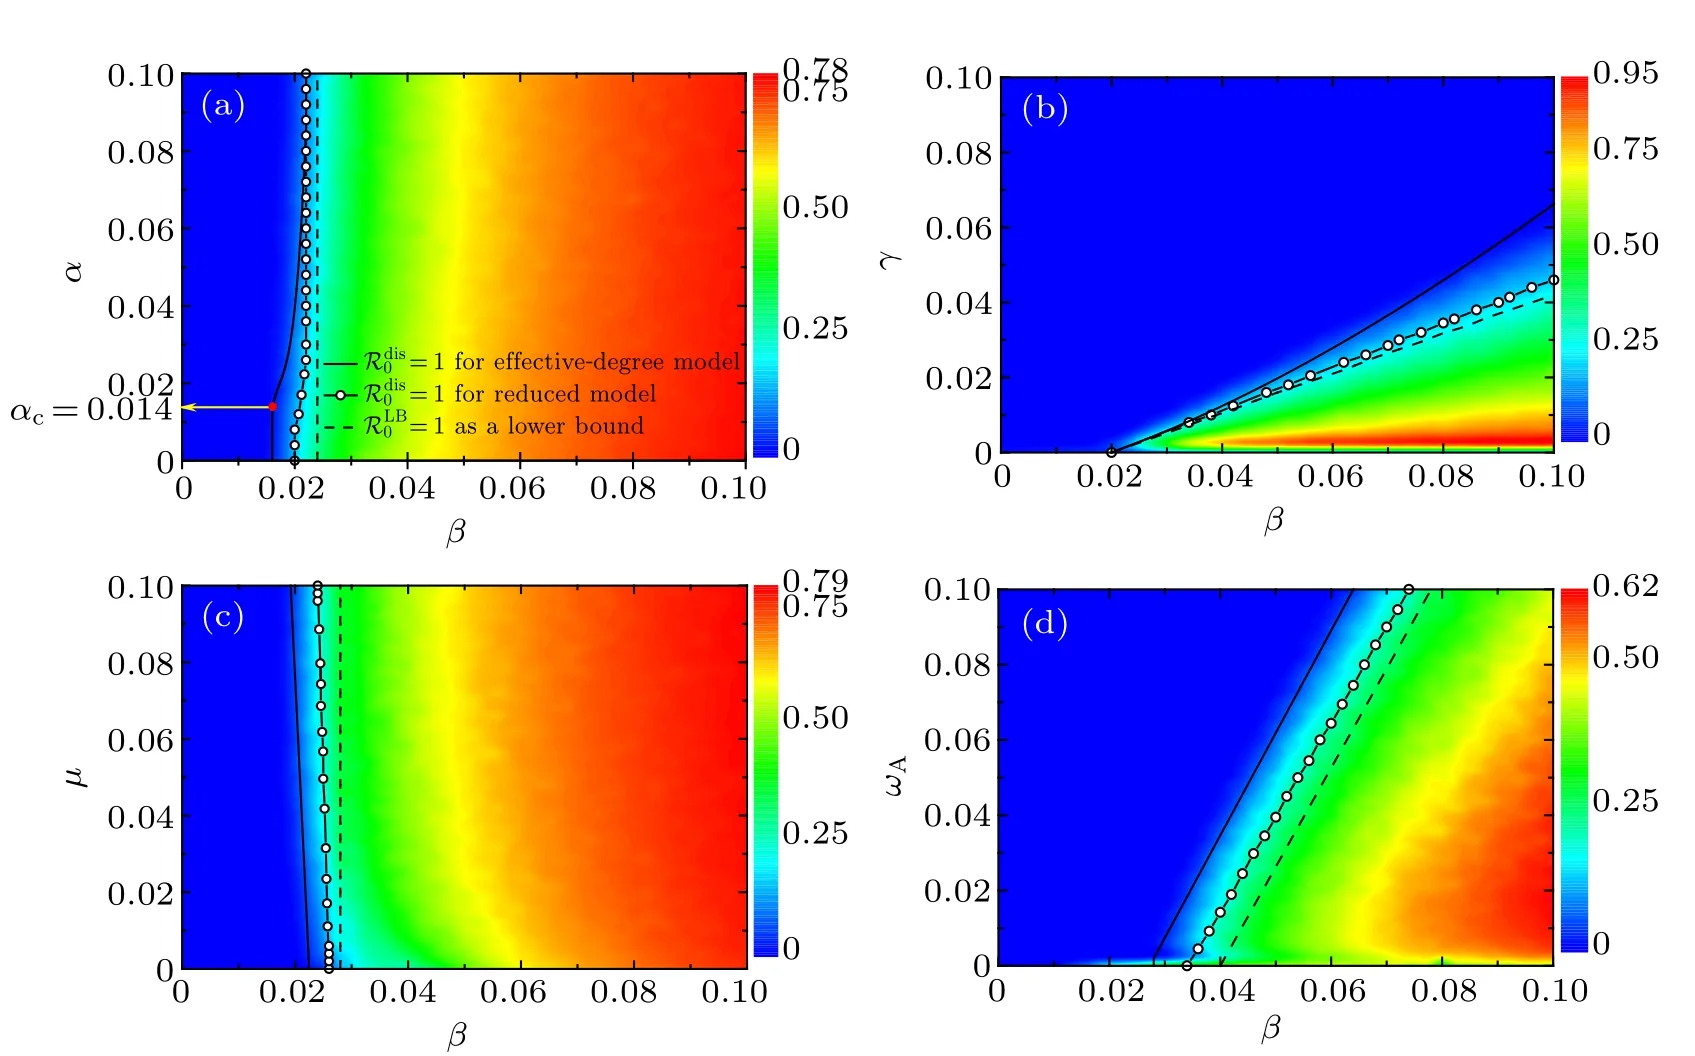
Fig.6. The fraction ρI(of which the simulation results are represented by the color bar in the heat map)of infected individuals in the stationary state as a function of β and(a)α,(b)γ,(c)µ,and(d)ωA. All full phase diagram are obtained for the same initial multiplex network structure as in Fig.5. For comparison,the theoretical threshold conditions for disease outbreak obtained from our effective degree model[Eq.(16)],the reduced model[Eq.(24)],and the lower bound[Eq.(25)]are indicated by solid curves,empty circles,and dashed curves,respectively. The red filled circle in panel(a)marks the metacritical point(αc,βc). Note that the threshold transmission rate for disease outbreak is βc =β/ℛdis0 ,above which the disease breaks out.Analogously,the threshold diffusion rate for awareness information outbreak is αc=α/ℛawe0 ,above which the awareness information prevails. The simulation results are obtained by averaging over 100 independent realizations. Other parameters are used for panels: (a) µ =0.02, γ =0.01, ωA =0.01, ωU =0.002; (b) α =0.08, µ =0.09, ωA =0.05, ωU =0.01; (c) α =0.02, γ =0.01,ωA=0.02,ωU=0.004;(d)α =0.04,µ =0.06,γ =0.02,y=ωU/ωA=0.2.
As indicated by solid curves and empty circles in Fig.6(a),there is a critical phenomenon in the dependence of the disease outbreak threshold βcon the information spreading rate α. Namely,there exists a critical value αcfor information spreading rate,above which βcnonlinearly grows with the increase of α, whereas below which βcdoes not vary with α.In Fig.6(b),the value of ρIis plotted in the β–γ phase plane,where the disease-free region (marked in blue) accounts for a major part, which highlights the great contribution of enlarging the recovery rate γ to preventing the disease outbreak.The solid curve indicates that the disease transmission threshold βcobtained from effective degree model[Eq.(16)]grows nonlinearly with γ,whilst the disease transmission thresholds derived from the reduced model[Eq.(24)](empty circles)and the lower bound [Eq. (25)] (dashed curves) increase almost linearly with γ. Only in the case of an extremely small γ with a relatively large β can the value ρIreach the maximum. In Fig.6(c),it is shown that for the given parameters the disease transmission rate β exhibits a dominant influence on the density ρIof infected nodes over the information forgetting rateµ, especially for large values of µ. In addition, the disease outbreak threshold shows a negligible reliance on µ , which has also been demonstrated in Fig. 4(a) and Fig. 5(a). Furthermore, it is shown in Fig. 6(d) that all the three theoretical disease thresholds grows almost linearly with the adaptive rewiring rate ωA. The higher the disease transmission rate,the more the frequent adaptive rewiring needed for disease extinction. In general, as shown in all panels in Fig. 6, the theoretical result of disease outbreak threshold matches well with the stochastic simulations. What is more,as is expected,the threshold transmission rate βcobtained by effective degree model is smaller than the one obtained in the reduced model,which is in turn less than that derived from the lower bound.It is worth noting that>1 ensures>1.Therefore,the lower bound can be used as an early warning signal of epidemic risk as well as a preliminary guidance for potential intervention measures for disease prevention.
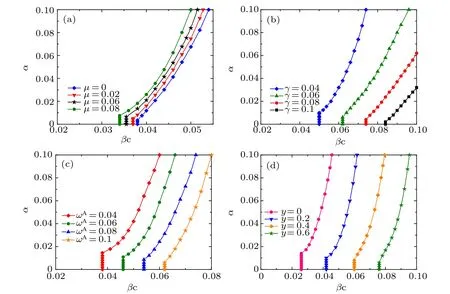
Fig.7. Critical transmission rate βc for disease outbreak as a function of the awareness information spreading rate α with different values of(a)the information forgetting rateµ,(b)the recovery rate γ from infectious disease,(c)the rewiring rate ωA for aware susceptible individuals,and(d)the ratio y=ωA/ωU. All the results are obtained based on the basic reproduction number for disease transmission[Eq.(16)]. The initial network setting is the same as in Fig.5. Other parameters are set for panels: (a)γ =0.02,ωA =0.05,ωU =0.01;(b) µ =0.04,ωA =0.05,ωU=0.01;(c)µ =0.06,γ =0.03,y=ωU/ωA=0.2;(d)µ =0.06,γ =0.03,ωA=0.05.
In Fig.7,we present the disease transmission threshold βcas a function of the the awareness information diffusion rate α with different values of other parameters.In all panes of Fig.7,there appears a metacritical point(αc,βc)such that the value of βcgrows nonlinearly with α when α >αc;otherwise,βcis independent of α. This critical phenomenon in the reliance of disease transmission threshold on the awareness information diffusion rate coincides with the findings in Refs. [8,44,45].As shown in Fig. 7(a), with parameters γ =0.02, ωA=0.05 and ωU=0.01,the disease threshold βcdecreases slightly asµ rises,which is consistent with the results in Figs.4(a),5(a)and 6(c). Moreover,for any fixed α,as displayed in Fig.7(a),the larger the information forgetting rate µ, the smaller the disease threshold βc. Reversely, it is shown from Figs. 7(b)–7(d) that the disease transmission threshold βcgrows significantly with the rise of parameters γ,ωAand y. That is,for any fixed information propagating rate α,the larger the disease recovery rate and adaptive rewiring rates,the greater the critical transmission rate for the onset of epidemic. In addition, in combination with a large α, increasing the rates of recovery and rewiring leads to a greater βc, which highlights the combined effects of awareness information spreading and adaptive rewiring in preventing and suppressing the disease transmission. Furthermore,it is worth noting that the critical value αcof awareness spreading rate (for the increase of the epidemic onset βc) grows accordingly with the increase of µ and with the decrease of γ, ωAand y. In particular, as shown in each panel of Fig.7,the smaller the βc,the larger the αc.
In order to verify the above statement,we present in Fig.8 the heat map for the density ρAof aware individuals who know the disease information as a function of spreading rates α of awareness information and β of disease. Note that the grey region A marks the information-free state(i.e.,ρA=0)and the ρAvalue goes from 0.0001 to 0.96 as the color changes gradually from blue to red,as denoted in the color bar. For comparison,the critical conditions for the onset of disease and awareness information have been depicted in the α–β plane. The orange solid curve represents the disease threshold βcbelow which the disease will die out,whereas the black dashed curve stands for the awareness information threshold αcabove which the awareness information prevails in the population. Consequently,the α–β plane is divided by the threshold curves into four areas A,B,C1and C2. The simulation results agree well with our theoretical analysis in such a way that in area A,there is no disease and no awareness information at all; in area B,the disease dies out but the information persists in the population; in both areas C1and C2, the awareness information prevails with a relative higher level,albeit whether the disease dies out or not in area C2depends on the outcome of the competition between disease transmission and awareness information diffusion.[44,45]It can be observed from Fig. 8 that the critical value of information diffusion rate in the metacritical point mentioned in Figs. 6(a) and 7 is exactly the awareness information threshold αc, above which the onset of disease grows.
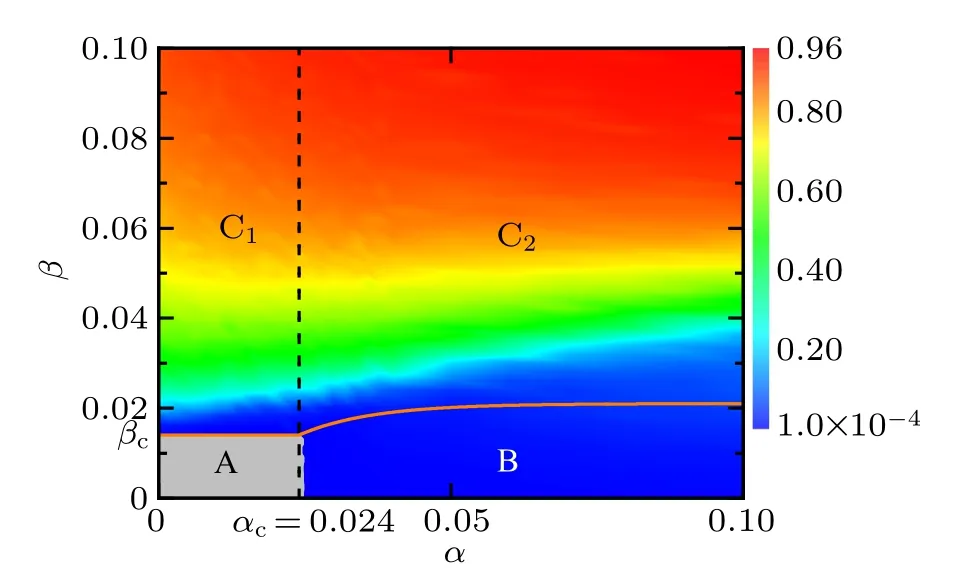
Fig.8. Heat map for the density ρA (denoted by the color bar)of informed individuals (including infected individuals and aware susceptible individuals) who are aware of disease information in the stationary state as plotted in the α–β phase diagram. The orange solid curve is for the disease outbreak threshold(β =βc)derived from Eq.(16),while the black dashed curve corresponds to the threshold condition (α =αc) for awareness information outbreak obtained based on Eq.(20). The α–β phase plane is divided by the threshold curves into four regions:the grey region A denotes the disease-and information-free steady state(i.e.,there are only unaware susceptible individuals in the end);the blue region B denotes the disease-free but informationpresent steady state(i.e.,both aware and unaware susceptible individuals exist without disease in the end);and the polychrome regions C1 and C2 mark the disease endemic state where infected individuals prevail in the population. The initial multiplex network structure is the same as in Fig. 5. The simulation results are obtained by averaging over 100 independent realizations. Other parameters areµ =0.02,γ =0.01,ωA=0.05,ωU=0.001.
7. Conclusions
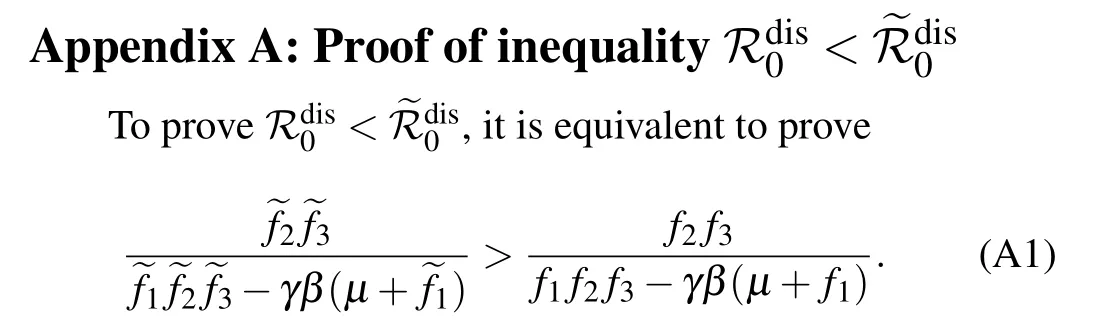
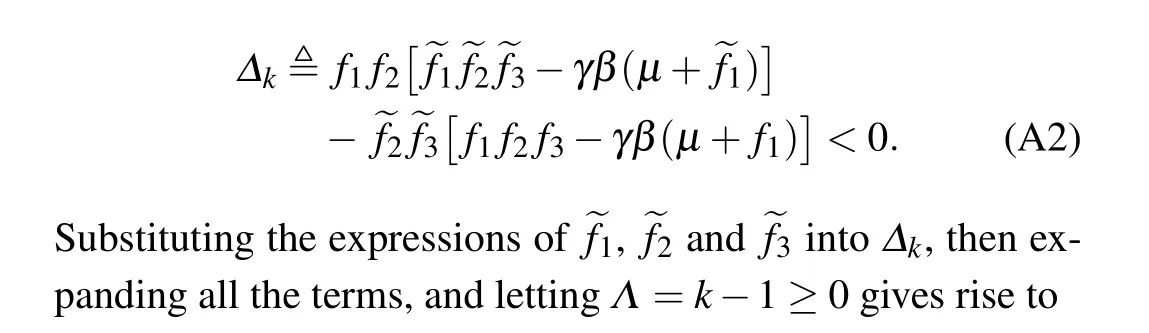
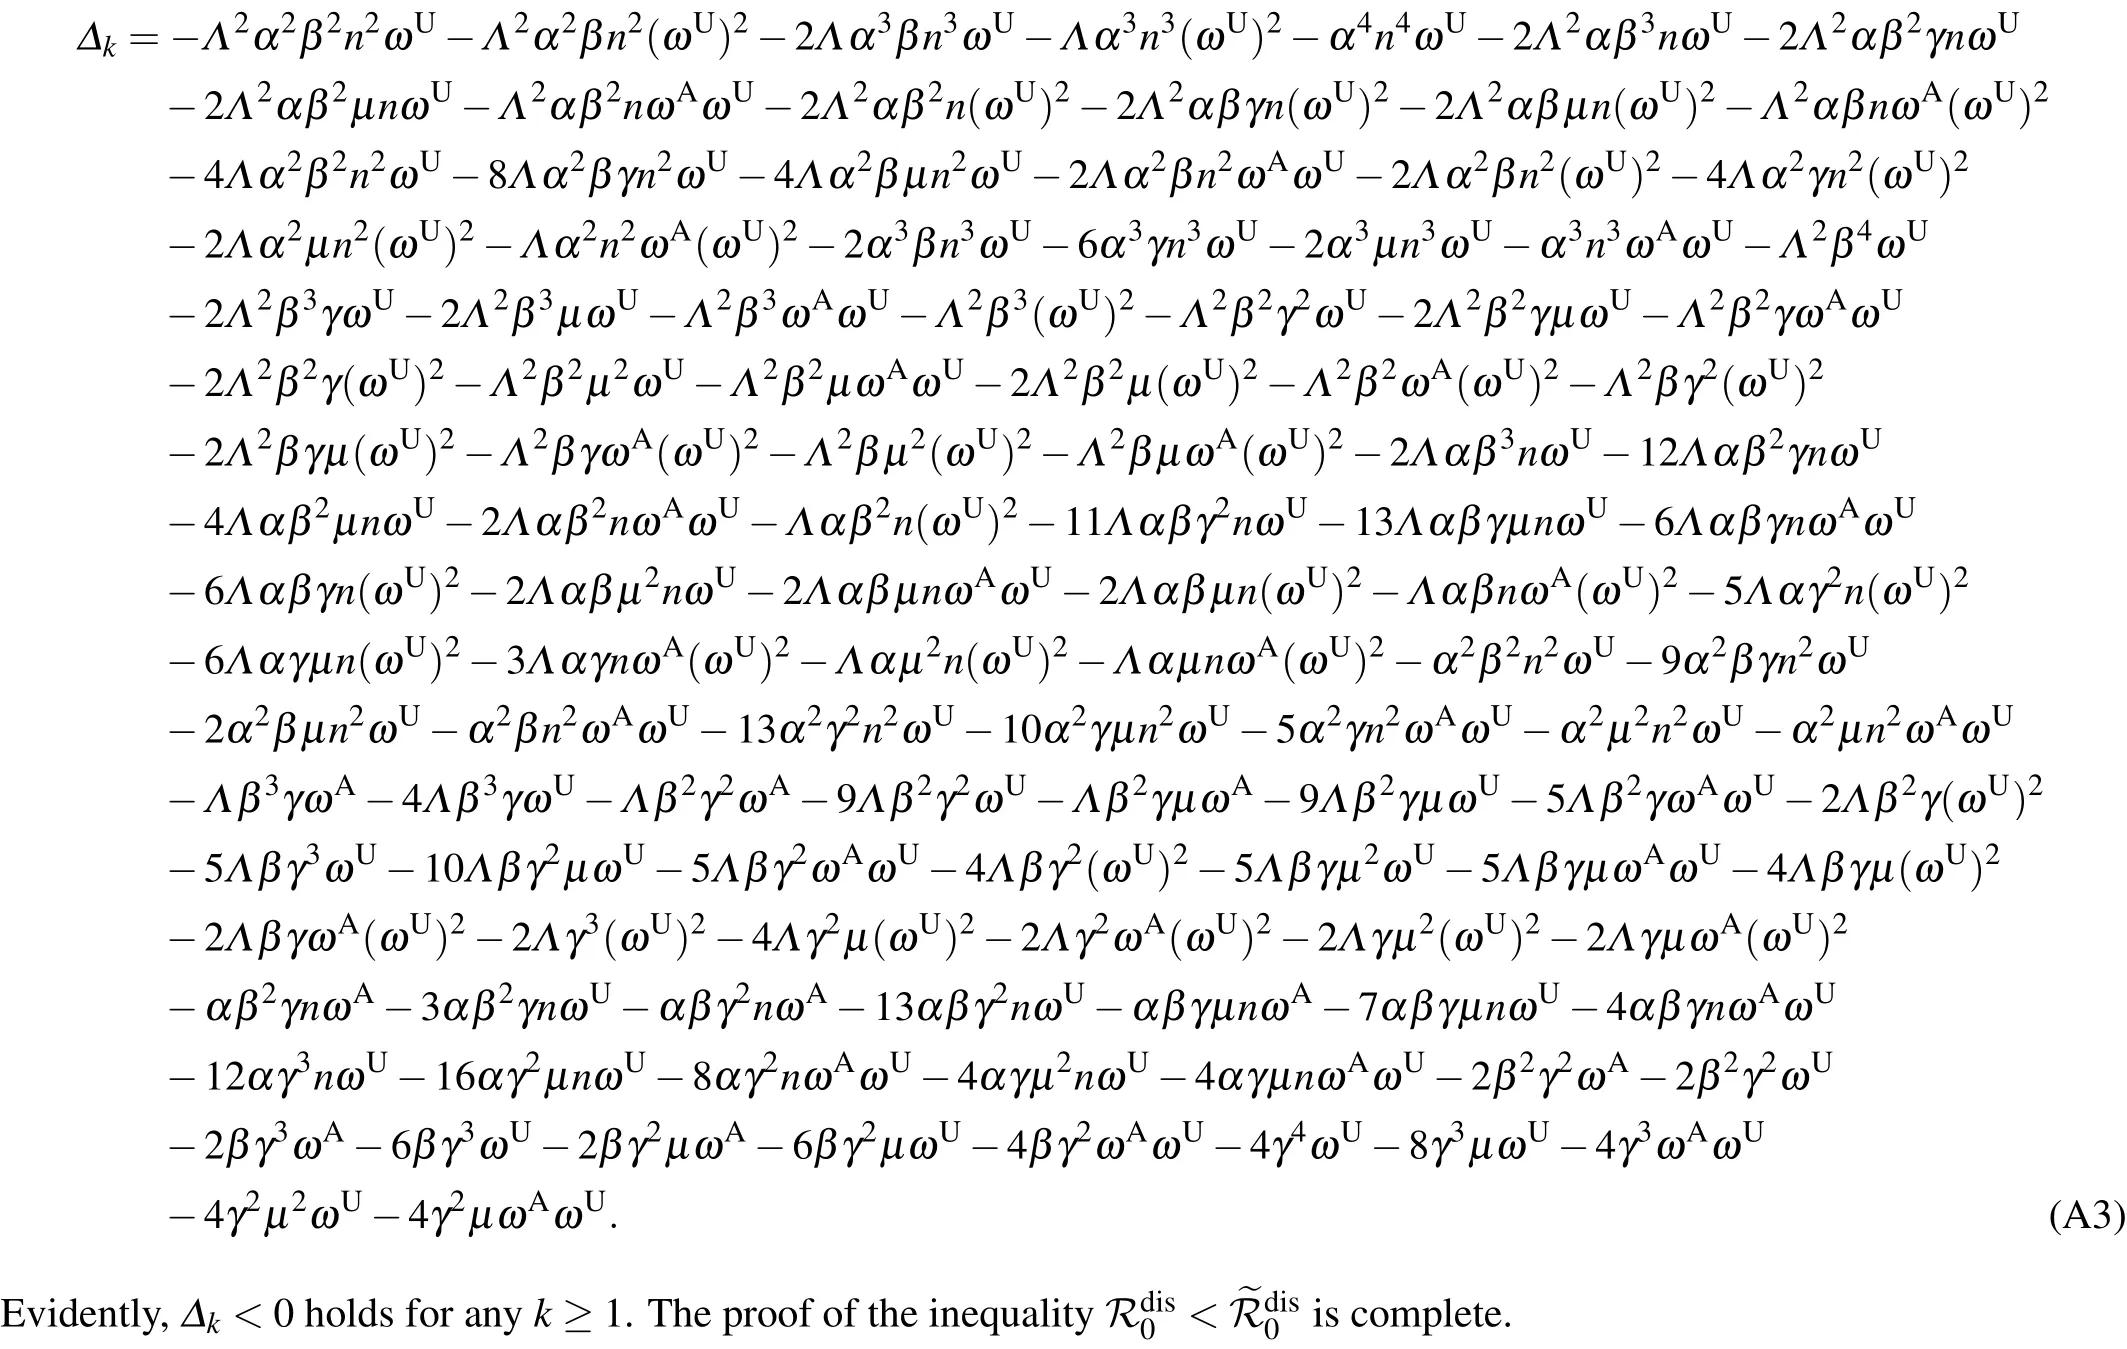
Since the denominators on both sides of the above inequality(A1)are positive,what we need is to show
Appendix B:Impact of rewiring on degree distribution of the epidemic-layer network
According to the adaptive rewiring rule in our model,the underlying network structure in the epidemic layer, especially the degree distribution, will evolve along with the rewiring process. Adaptive rewiring of high-risk links leads to the breakdown of edges that connect susceptible nodes and infected ones, and meanwhile, gives rise to the formation of low-risk links connecting towards a randomly chosen susceptible node. The random attaching mechanism that has been widely used in random graph models[46]will typically generate a relatively narrow degree distribution. As demonstrated in Fig. B1 the degree distribution of underlying contact network in the epidemic layer exhibits different scaling behaviors: in the case without rewiring, the node degree follows a perfect power law with exponent ν =2.5;while in the case with rewiring,the degree values are narrowly distributed along the average degree,approximating to a Poisson distribution.
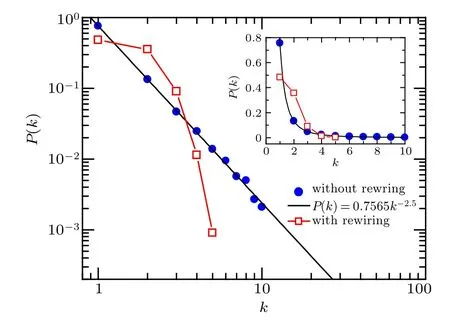
Fig. B1. Degree distributions of the underlying network capable of disease transmission in the case without (blue solid circles) and with (red empty squares) adaptive rewiring, respectively, at time t =104 when the system is in the stationary state. Black solid line denotes the exact power law with exponent ν =2.5. The simulation results(denoted by symbols)are obtained by starting with the same initial network architecture as in Fig. 3. To make a direct comparison between the cases without and with adaptive rewiring,the results are plotted in the log-log scale,while the inset displays the same results in a linear-linear scale. Parameters are α =0.04, µ =0.1,γ =0.02,β =0.2,ωA=0.02,ωU=0.004.
猜你喜欢
杂志排行

Chinese Physics B的其它文章
- Process modeling gas atomization of close-coupled ring-hole nozzle for 316L stainless steel powder production*
- A 532 nm molecular iodine optical frequency standard based on modulation transfer spectroscopy*
- High-throughput identification of one-dimensional atomic wires and first principles calculations of their electronic states*
- Effect of tellurium(Te4+)irradiation on microstructure and associated irradiation-induced hardening*
- Effect of helium concentration on irradiation damage of Fe-ion irradiated SIMP steel at 300 °C and 450 °C*
- Optical spectroscopy study of damage evolution in 6H-SiC by H+2 implantation*