A 532 nm molecular iodine optical frequency standard based on modulation transfer spectroscopy*
2021-05-24FeihuCheng程飞虎NingJin金宁FengleiZhang张风雷HuiLi李慧YuanboDu杜远博JieZhang张洁KeDeng邓科andZehuangLu陆泽晃
Feihu Cheng(程飞虎), Ning Jin(金宁), Fenglei Zhang(张风雷), Hui Li(李慧), Yuanbo Du(杜远博),Jie Zhang(张洁), Ke Deng(邓科), and Zehuang Lu(陆泽晃)
MOE Key Laboratory of Fundamental Physical Quantities Measurement,Hubei Key Laboratory of Gravitation and Quantum Physics,PGMF and School of Physics,Huazhong University of Science and Technology,Wuhan 430074,China
Keywords: iodine-stabilized laser frequency standard, modulation transfer spectroscopy, residual amplitude modulation
1. Introduction
High precision length measurement plays an important role in everyday life and many diverse fields. In 1983,the Bureau International des Poids et Measures (BIPM) gave a new definition of length standard and recommended three ways to realize it.[1]One of them is that the length standard can be achieved by locking lasers to hyperfine transition lines of atoms and molecules. Moreover, the BIPM recommended a list of radiations for this realization.[2]As a result,a significant amount of research has been performed on frequency stabilization techniques based on atoms and molecules, and the frequency stabilization technique has been greatly improved.[3–6]A commonly used length standard is the iodine-stabilized laser. Currently, the stability of iodine-stabilized lasers using hyperfine transition lines near 532 nm as frequency references have reached the level of 10−15@1 s,[7,8]which makes them suitable for optical clocks,[9]space based absolute frequency references,[10]and wave-division multiplexing systems for telecommunications systems.[11]
At present, there are three commonly used methods to lock lasers to hyperfine transitions of atoms and molecules.The first is called saturated absorption spectroscopy(SAS).[12]To eliminate the Doppler effect in saturated absorption spectroscopy, two beams are required: a stronger beam (pump beam)is used to saturate the transition,while another weaker counter-propagating beam (probe beam) is used to probe the saturated transition. In order to enhance the signal and allow weaker features to be observed, the laser is frequency modulated.[13]The gas cell can be inside or outside the laser cavity and use a third harmonic synchronous detection method. This method works well for a 633 nm He–Ne laser with an iodine cell in the cavity. The second method,called optical heterodyne frequency modulation spectroscopy (FMS),[14]is performed by adding phase modulation to the probe beam,and then detecting the differential absorption of the carrier beam and the left and right modulation sidebands when they pass through the saturated medium.The third method is called modulation transfer spectroscopy(MTS).[15,16]It is a method of transferring a modulated signal from a modulated beam to an unmodulated beam through four-wave mixing in a nonlinear medium. The generated sidebands and the original carrier beam enter the photodetector together, and through phase sensitive detection the error signal can be obtained. Because the demodulated signal has the advantages of high sensitivity,high resolution,and insensitivity to the first-order Doppler effect,it has become very popular for laser frequency stabilization.
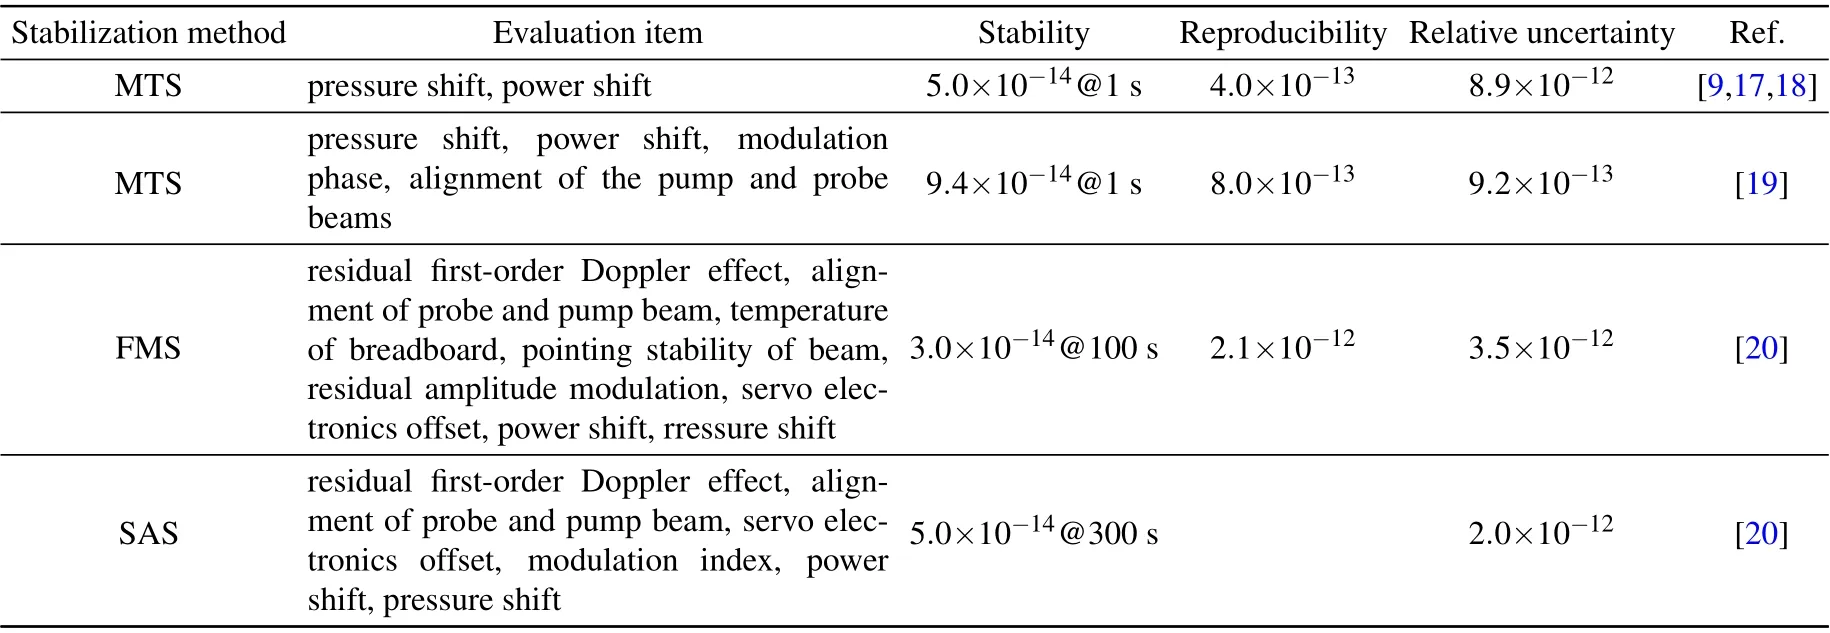
Table 1. Summary of the results of the iodine-stabilized laser with the 127I2 R(56)32-0:a10 line as the frequency reference.
All three methods have been used to reproduce the 532 nm length standard, including JILA in the United States,[9,17,18]NMIJ in Japan,[19]PTB in Germany and ILP in Russia.[20]They use different methods to lock the laser to the R(56) 32-0:a10line of the iodine molecule and study the frequency stability,reproducibility and uncertainty of the system. The results are listed in Table 1. PTB in Germany uses the FMS technique,and has made a detailed evaluation of various frequency shifts in the system, including RAM-induced frequency shift,residual first-order Doppler,shift,servo electronic noise,etc. JILA in the United States and NMIJ in Japan use MTS technology.They have mainly evaluated the pressure shift and power shift in the system, and NMIJ has also evaluated the shifts induced by modulation phase and alignment of the pump and probe beams. ILP in Russia uses SAS technology and then detects fluorescence signals,so the system is not sensitive to beam pointing jitter. It has mainly evaluated residual first-order Doppler shift,the beam coincidence effect,etc.
In this work, we report construction of an iodinestabilized laser frequency standard based on MTS technology. The laser is locked to the R(56) 32-0:a10line, and the frequency stability is measured to better than 3.0×10⁻¹⁴for averaging times from 0.1 s to 30 s. After several on–off measurements of the iodine-stabilized laser with an optical frequency comb, the reproducibility of the system is found to be 3.5×10⁻¹³, the best among all systems reported so far, demonstrating excellent stability of our setup. Unlike previous works in MTS, we have done a detailed evaluation of the systematic shifts, including RAM-induced frequency shift,pressure-induced frequency shift,power-induced frequency shift, beam pointing-jitter induced frequency shift,electronic servoinduced frequency shift, demodulation phase offset induced frequency shift, iodine impurity induced frequency shift,etc.
The RAM induced frequency shift has been evaluated in the FMS.[20]The phase modulation is applied directly on the probe beam, so the RAM effect is much easier to evaluate.However,in the MTS,the phase modulation is applied on the pump beam,and it is well known that the MTS mainly uses the third-order nonlinear four-wave mixing effect, and four-wave mixing is a phase-sensitive process. The efficiency of this process is strongly affected by the phase matching conditions.This means the modulation signal (including phase modulation and amplitude modulation) cannot be transferred to the probe beam when it is far away from resonance. Therefore,in the open-loop situation, it is impossible to directly detect the probe beam RAM effect. To solve this problem, we theoretically deduced the MTS signal with RAM under large modulation depth, and proved that the non-symmetric shape of the MTS signal was directly related to the MTS effect. The nonsymmetric shape factor r can be calibrated with a frequency comb, and in real experiments, this r value can be obtained by least-squares fitting of the MTS signal,from which we can infer the RAM induced frequency shift.
After taking all the frequency shifts into account,our iodine based standard has a frequency uncertainty of 5.3 kHz,corresponding to a relative uncertainty of 9.4×10⁻¹².The corrected transition frequency has a difference from the BIPMrecommended value of 1 kHz,which is within 1σ uncertainty.Our experimental results agree with the BIPM general guideline on the the expression of uncertainty. The system stability is three times better than the reproducibility, and the reproducibility is three times better than the total uncertainty (3-3 rule),[21]demonstrating a good attribute of length standard.
2. Experimental setup
The 532 nm system has been proven to be one of the most important wavelength standards in the visible range. A large number of transition lines are found in the visible wavelength region of127I2; these transition lines come from the B ←X system. Here, B is the excited electronic state and X is the ground electronic state. Under the Born–Oppenheimer approximation, the total energy of molecular iodine is decomposed into molecular vibrational energy, molecular rotational energy and vertical electronic energy. The vibrational energy comes from the vibrational motion between atoms in the molecular iodine, and the rotational energy comes from the rotation of atoms around a certain axis. The vertical electronic energy comes from the electronic configuration between molecular electronic states. Figure 1 shows the simplified R(56)32-0 transition of127I2. In the figure,ν is the vibrational quantum number,J is the rotational quantum number,and′(′′)indicate the upper(lower)energy levels,respectively.
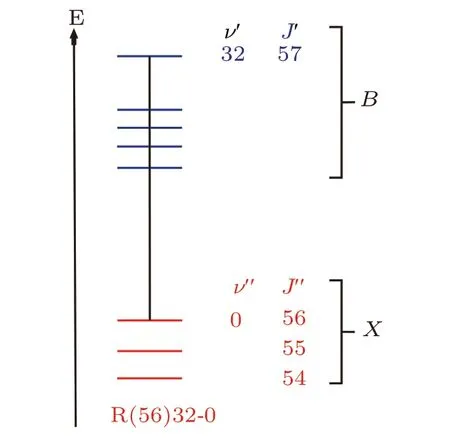
Fig.1. Simple representation of ro-vibrational transitions of the B ←X system of 127I2 for R(56)32-0.
For a rigid diatomic molecular the selection rules that the transition needs to meet are ΔJ = J′−J′′= ±1 and Δυ =υ′−υ′′/=0. Usually the ro-vibrational transition energy level is denoted as b(J)ν′−ν′′, where b represents the branch (R branch or P branch),the P branch corresponds to ΔJ=−1,and the R branch corresponds to ΔJ=+1. Because of hyperfine interactions, each ro-vibrational level is further split into hyperfine levels. Thus,a ro-vibrational transition contains many hyperfine components. When the rotational quantum number of the ground state is even,there are 15 hyperfine lines;when the rotational quantum number of the ground state is odd,there are 21 hyperfine lines. For the R(56)32-0 transition,there are 15 hyperfine transition lines.
The experimental setup is shown in Fig. 2. It includes the iodine frequency stabilization part(Fig.2 bottom part)and the optical frequency comb part(Fig.2 top part).[22]We used a Nd:YAG laser (Coherent Prometheus-100NE) as the light source,which could output 1064 nm and 532 nm at the same time,and the maximum output powers of 1064 nm and 532 nm were 2 W and 100 mW,respectively.

Fig. 2. Experimental setup. Top part, optical frequency comb part; bottom part, iodine frequency stabilization part. FC, fiber coupler; PBS,polarization beam splitter;λ/2,half-wave plate;L,lens;M,mirror;EOM,electro-optic modulator;AOM,acousto-optic modulator;LPF,low-pass filter;PD,photodetector;BPF,band-pass filter.
For the iodine frequency stabilization part, the 532 nm laser beam first passed through an optical isolator, and then passed through a half-wave plate and a high extinction ratio(5000:1) PBS (PBS1 in Fig. 2). PBS1 was used to divide the laser beam into a strong pump beam and a weak probe beam. The polarization directions of these two beams were perpendicular to each other. The radii of the two beams were both 1.5 mm,the powers of the two beams were 2.0 mW and 1.5 mW, respectively, and the power ratio was controlled by a half-wave plate placed in front of PBS1. The probe beam passed through an 80 MHz AOM,and the zeroth-order beam was chosen for power stabilization. For the pump beam, the first-order beam was chosen for power stabilization. An EOM was used for phase modulation with a modulation frequency of 310 kHz. The two beams were reflected multiple times inside the iodine cell with a length of 30 cm while remaining overlapped with each other, and the signal sideband was transferred from the modulated pump beam to the unmodulated probe beam through a four-wave mixing process. Before entering the iodine cell,the probe beam passed through PBS2 to split part of the beam as a reference beam. The effective light and iodine interaction length is about 1 m. Photodetector PD4 was used to detect the optical heterodyne beat signal.The beat signal was demodulated by a lock-in amplifier to generate the error signal. The error signal was used to servo control the laser frequency through a servo system. Laser frequency stabilization was realized by feeding back the error signal to the laser PZT with a bandwidth of about 13 kHz,and to the laser temperature control with a bandwidth of 0.1 Hz.
After the laser was locked, an optical frequency comb(OFC)was used to evaluate the various frequency shifts. The 1064 nm laser output was transmitted to the comb experimental platform through a 5 m long single-mode fiber. Then, the laser light and the comb light were combined and coupled into an optical fiber after passing through PBS4. The emitted light passed through a grating,and then entered an avalanche detector after passing through a reflector and an iris. The purpose of the iris was to block other spectral components of the light and reduce background noise. A hydrogen maser(Microsemi MHM 2010)was used as the frequency reference for the OFC.
3. Experimental results
3.1. Frequency stability
In order to evaluate the frequency stability of our iodinestabilized laser, we beat the iodine-stabilized laser with an ultra-stable laser that has a stability of better than 1.2×10⁻¹⁴for averaging times from 0.1 s to 10000 s.[23]Figure 3 shows the locked laser frequency stability,which is represented with Allan deviation. It can be seen from Fig. 3 that the laser frequency stability is better than 3.0×10⁻¹⁴for averaging times from 0.1 s to 30 s.
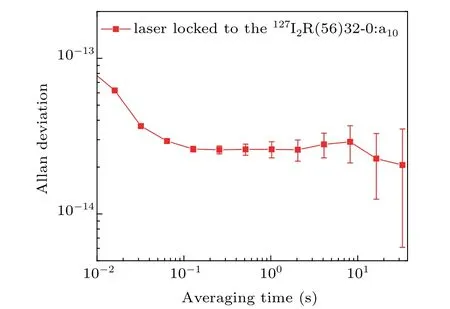
Fig.3. Frequency stability of the iodine-stabilized laser.
The frequency stability of our system is still not as good as that reported by other groups.[7,8,17,24]Therefore,we analyzed several contributing factors in the system, including pressure, optical power jitter, beam pointing jitter, etc.Through the analysis, we found that the current limiting factors of our system are mainly beam pointing jitter noise and optical power noise. Figure 4 shows the frequency noise of the iodine-stabilized laser and the equivalent frequency noise of pointing jitter and pump power.It can be seen that the pointing jitter equivalent frequency noise and frequency noise of the iodine-stabilized laser are consistent in the frequency range of 1 mHz to 0.25 Hz,and pump power fluctuations also have an impact at lower frequency. Therefore,the next step is to use a special assembly integration technique to connect the optical components to a glass baseplate with a low thermal expansion coefficient to realize high beam pointing stability and further improve the power stability. However,the achieved frequency stability is already good enough for us to evaluate the system reproducibility and systematic uncertainty according to the 3-3 rule.
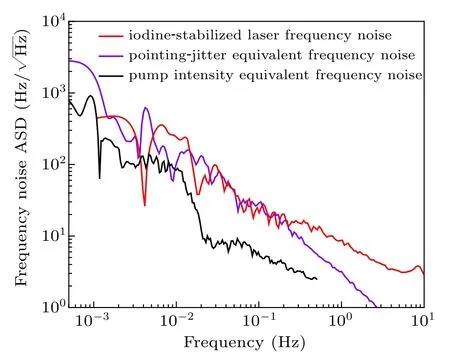
Fig.4. Frequency noise amplitude spectral density(ASD)of the beatnote at 1064 nm between the iodine-stabilized laser and the ultra-stable laser. Pointing jitter equivalent frequency noise. Pump intensity equivalent frequency noise.
3.2. Frequency reproducibility
As a good length standard, not only good frequency stability but also good reproducibility is required. It has been verified that when different OFCs are referenced to the same reference source, their measurement deviation is less than 10−16.[25]Therefore, we used the OFC to measure the frequency of the iodine-stabilized laser 11 different times on different days. The hydrogen maser was used as the reference for the OFC, with its absolute frequency calibrated by a Cs beam clock (Tongxiang Technology, BD 1024) and a GNSS receiver (Septentrio Satellite Navigation, PolaRx4TR Pro) through real-time comparison. Figure 5 shows the frequency reproducibility of our system. The standard deviation from the average is 0.2 kHz, corresponding to a relative uncertainty of 3.5×10⁻¹³. The result is the best among reported values,demonstrating the excellent stability of our setup.
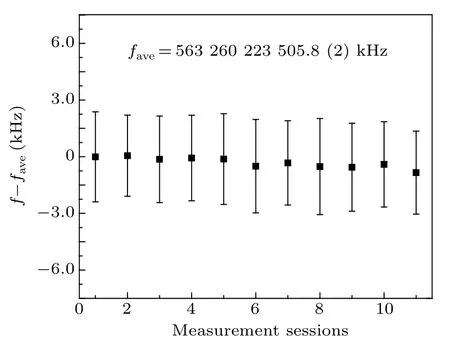
Fig.5. Frequency reproducibility of the iodine-stabilized laser.
3.3. Frequency uncertainty
In order to obtain the absolute frequency value and the systematic uncertainty of the 532 nm optical frequency standard, it is necessary to evaluate different noise sources in the system. The main noise sources include RAM-induced frequency shift, pressure shift, power shift, beam pointing-jitter induced frequency shift,iodine impurity and some other shifts.
3.3.1. RAM-induced frequency shift
Electro-optic modulators (EOMs) are one of the key devices used in the MTS technology. By applying an electric field between the electro-optical material inside a modulator,the refractive index of the optical material can be changed.[26]Therefore,when a pump beam passes through the modulator,it will generate sidebands spaced about the carrier frequency at multiples of the applied modulation frequency. Ideally, an EOM for phase modulation should only generate purely phasemodulated light. However,a well-known problem with EOMs is that they generate unwanted synchronous RAM.[27–30]In optical frequency reference applications,this unwanted amplitude modulation leads to frequency offset and frequency fluctuation,and thus degrades the frequency accuracy and stability of the frequency standards.
The same RAM effect will also affect the accuracy of the frequency standard. As stated in the above,the RAM induced frequency shift can be directly evaluated in the FMS since the phase modulation is applied directly on the probe beam. However,in the MTS,the phase modulation is applied on the pump beam,so the evaluation of the RAM effect on the probe beam is not that straightforward. To solve this problem,we first analyze the MTS signal obtained without and with RAM.
The MTS signal comes from demodulation of the beat signal of the modulation transfer light ω±Ω with the original unmodulated light ω. The time variation of the probe field can be expressed as

where ω =2π f. The pump beam after going through a phase modulator with a pure phase modulation at frequency Ω can be expressed as
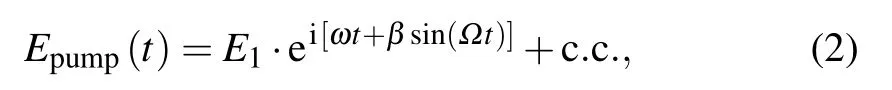
In this expression, β represents the modulation index. After Fourier decomposition,Eq.(2)can be written as

where Jn(β) is the nth-order Bessel function, which defines the relative amplitudes of the carrier and the modulation sidebands. If we only consider pure phase modulation, the magnitudes of the left and right modulation sidebands are equal,Jn(β)=(−1)nJ−n(β). After the phase modulation,the pump beam and the probe beam undergo four-wave mixing in the iodine cell, and then the probe beam is incident on a photoreceiver. The photocurrent beat signal has the following form:[31,32]
where
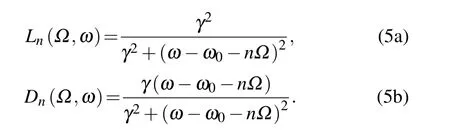
Here,I0and I1are the incident probe and pump beam intensity,l is the effective laser interaction length, α is the absorption coefficient, K is related to the response of the photodetector and other scaling constants of the system,and IAis the saturation intensity and is wavelength dependent. γ and ω0are the half-width-full-maximum (HWFM) and the angular resonant frequency of the hyperfine transition, respectively. φsigis the detection phase. The interaction of the pump and probe beams inside the gas cell can be explained using a third-order nonlinear perturbation theory. Using a phase modulation signal cos(Ωt+φref) to demodulate the beat signal and then pass it through a low pass filter,the final error signal can be expressed as

where θ =φsig−φref,the cos term corresponds to the in-phase signal,and the sin term corresponds to the quadrature signal.
In reality there is no pure phase modulation, no matter whether an EOM or an acousto-optic modulator (AOM) is used as the phase modulator. Since RAM cannot be avoided completely,Eq.(3)needs to be rewritten as
where the magnitudes of the left and right modulation sidebands are not equal, Hn(β)/=(−1)nH−n(β). According to Ref.[33],amplitude modulation and phase modulation are independent of each other. Therefore,we can express the magnitudes of the left and right modulation sidebands as the sum of pure amplitude modulation Anand pure phase modulation Fn,

Substituting Eqs.(8a)and(8b)into Eq.(7),the expression for the pump field becomes

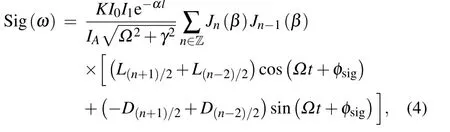
When the pump beam and the probe beam are overlapped and counter-propagating within the gas cell,the interaction between the phase-modulated and amplitude-modulated components of the pump beam and the probe beam produces a modulated signal through the four-wave mixing process. The demodulated error signal, which includes the RAM effect, can be expressed as
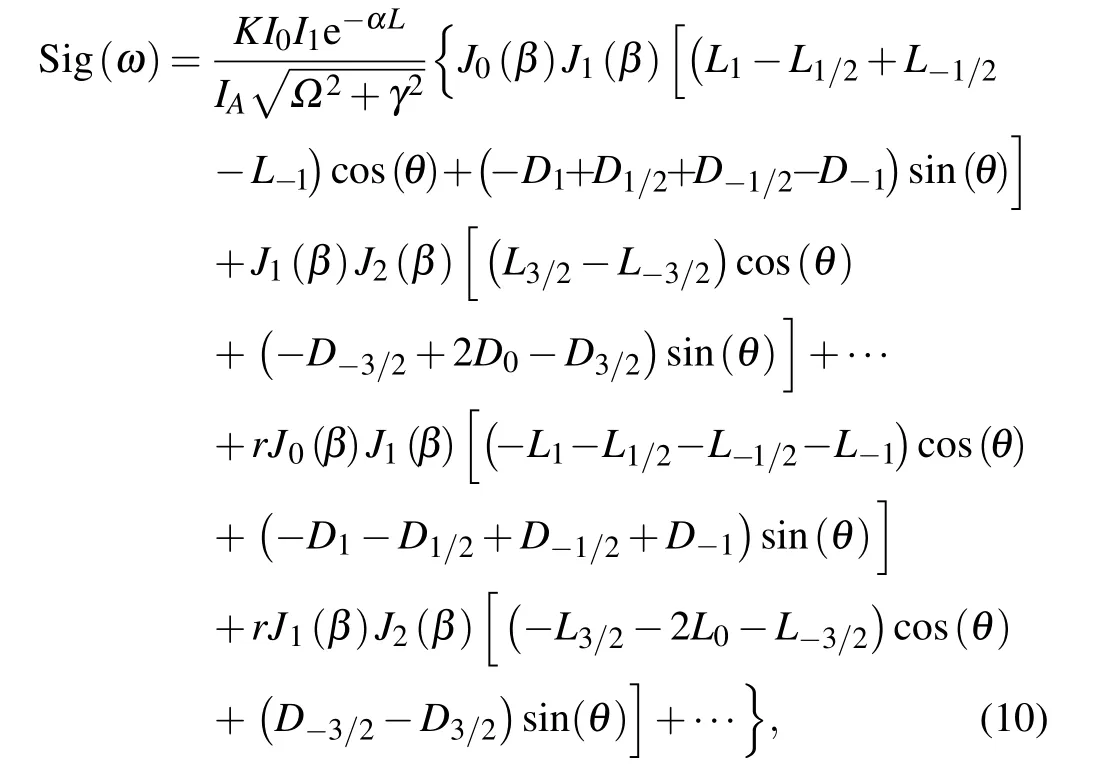
where r=An/Fnrepresents the ratio of the magnitude of the nth-order amplitude modulation to that of the nth-order phase modulation. In Eq. (10), the first half of the righthand side of the equation describes the signal generated by the phase modulation (PM) component, and the second half is generated by the amplitude modulation (AM). In order to obtain a higher SNR,a modulation index greater than 1 is used in actual experiments. Here,we assume that the modulation index β =2.3,and because the fourth-and higher-order interactions are small,we only consider the interference of the carrier and the first-order sideband,the first-and second-order sidebands,and the interaction of the second- and third-order sidebands.It can be seen from the figure that a combined phase- and amplitude-modulated pump beam distorts the shape of the error signal and causes the locking point to shift away from the center of the dispersive line.

Fig. 6. Theoretical analysis of MTS error value at different r values when the frequency of the laser resonates with the hyperfine transition. The inset shows the MTS signal predicted by Eq. (10). Here, only the in-phase signal and the third-order sidebands are taken into account,the modulation frequency(Ω)and HWFM(γ)are set to be 310 kHz and 550 kHz,respectively,and r is set to be −0.02.
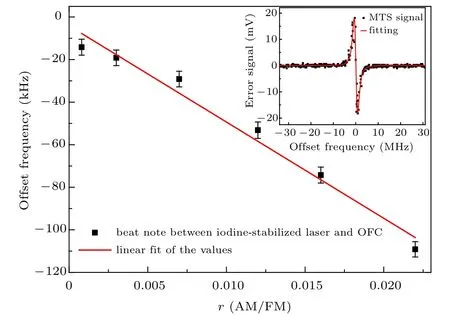
Fig. 7. Measured absolute frequency offset at different r values. The offset frequency is the measured frequency subtracted by the frequency without RAM.The inset shows the MTS experimental results fitted by Eq.(10).
To quantitatively analyze Eq. (10), the other coefficients in Eq. (10) were treated as constants. We obtained the demodulation voltage of MTS at the resonance frequency under different r values. We chose several different r values. The results are shown in Fig.6.It shows that when the laser resonates with the hyperfine transitions of the atoms or molecules, the demodulated MTS error signal has a linear relationship with different r values,which causes the locked laser frequency to deviate from the resonance frequency. Because the frequency shift after locking has a linear relationship with the r value under realistic experimental conditions, we can measure the relationship between the r value and the frequency shift caused by the RAM to obtain a calibration formula.
In order to verify our prediction, we changed the system’s signal line shape by changing the overlapping of the two beams in the system, which had the effect of changing r, and measured the absolute frequency with an optical frequency comb. According to Eq. (10), the parameters to be fitted include K,γ,Ω,β,θ,r,ω0,and for other parameters one can use the reported results. Since the modulation frequency is 310 kHz, Ω =0.31 MHz. During the first fitting, the initial values of other parameters were set to 151, 1.1 MHz, 0,0, 563260063.5 MHz respectively. In principle, this process needs to be repeated many times to make the fitting error as small as possible. The assumption here is that if the fitting error is less than 0.05,the fitting result is considered good.After we found the K,γ,β,θ,ω0obtained from the first fitting, we fixed them and only used r as the fitting parameter of the subsequent experimental data to obtain a high-precision r value.The experimental results are shown in Fig.7;the inset is one of the fitting results.It can be seen that there is a good linear relationship between the offset frequencies and the r values. From this figure, we find the slope is −(4.5±0.3) MHz. The offset frequency is the measured frequency subtracted by the first measured frequency. Therefore, we can evaluate the RAMinduced frequency shift in our system using this linear relationship by simply finding the value of r in each measurement.The value of r is obtained through fitting of the experimental line shape. We took the average of multiple fittings, and obtained r=0.0008(2),which corresponded to a frequency shift of 3.6±0.9 kHz.
3.3.2. Pressure shift
The variation of pressure in the iodine cell will contribute to the frequency shift. Figure 8 shows the experimental results of pressure shift. According to the empirical formula of saturated vapor pressure in the iodine cell,[34]the coldfinger temperature of the iodine cell is changed from −15°C to −3°C, and the corresponding pressure in the iodine cell is from 0.82 Pa to 3.03 Pa. The power of the two beams is maintained during the measurement. After linear fitting the measured results, the pressure shift slope is determined to be−7.3±0.1 kHz/Pa. Since the cold-finger temperature is controlled at −15°C, there is some solid-state iodine in the iodine cell, so we set the uncertainty of pressure inside iodine cell to be <0.01 Pa,which leads to a frequency uncertainty of<0.1 kHz.

Fig.8. Pressure shift of component a10 of R(56)32-0.
3.3.3. Power shift
Another sensitive parameter is the pump power. We changed the pump power from 1.0 mW to 4.0 mW with an interval of 0.5 mW and kept the probe power unchanged. Figure 9 shows the measured power shift. When we measured the power shift, the temperature of the cold finger was kept at −15°C. Six pump-laser power points were taken, and the measurement was repeated five times for each point. Finally,the slope was fitted to be 1.0±0.2 kHz/mW.The pump power used in the experiment was 2.0 mW,and we assumed that the uncertainty of the pump laser power was 1%. Therefore, the total uncertainty of the power shift was 0.4 kHz.

Fig.9. Power shift of component a10 of R(56)32-0.
3.3.4. Iodine-impurity-induced frequency shift
Iodine impurity in the iodine cell can also cause a frequency shift. Because our laboratory does not have a calibrated iodine cell with the BIPM, the frequency shift caused by iodine impurity cannot be given directly. According to Ref. [35], the iodine impurity in the iodine cell can be expressed indirectly by the Stern–Volmer coefficient. The smaller the coefficient, the higher the iodine purity, and the smaller the frequency shift caused by this effect. This coefficient can be measured by the laser-induced fluorescence(LIF)method. Therefore, in order to evaluate the frequency shift caused by iodine impurity, we measure the Stern-Volmer coefficient in our system. The experimental results are shown in Fig.10(a). After linear fitting,the Stern-Volmer coefficient is K0=0.92±0.03 Pa. We have collected statistics on the reported results of the relationship between the Stern–Volmer coefficient and frequency shift.[36–38]The results are shown in Fig. 10(b). Comparing our measured Stern–Volmer coefficients with those in the literature,we estimate the frequency shift caused by iodine impurity in our system to be about 5 kHz with an uncertainty of 5 kHz.
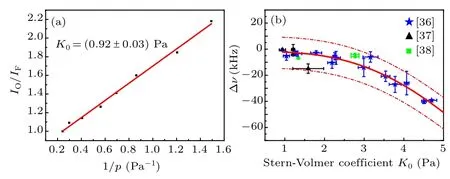
Fig. 10. (a) Experimental result of the Stern–Volmer coefficient measured by the LIF method. (b) Statistical results of the relationship between the Stern-Volmer coefficient and absolute frequency shift. Data are taken from Refs.[36–38]. Among them,the blue star points come from Chartier et al.(1992), the black triangle points come from Zucco et al. (2013) and the green square points come from Hrabina et al. (2017).
3.3.5. Other frequency shifts
Due to the long effective optical path in the iodine cell,the vibration of the platform and the release of the mechanical stress of the optical frame will change the beam pointing of the two beams, which will also affect the locked laser frequency.By slightly adjusting the angle between the two beams, the relationship between the angle and locked laser frequency is measured to be 15±3 Hz/µrad according to Fig. 11(a). Assuming there is a jitter of 80 µrad in the beam pointing, the frequency uncertainty is 1.2 kHz.
We also measure the uncertainty caused by the demodulation phase deviation and the servo electronics noise.By changing the demodulation phase and applying square-wave modulation to the locked loop, it is found that their influence on locked frequency is 94±8 Hz/degree and 2.8±0.1 kHz/mV,respectively. Figure 11(b)shows the measured frequency shift due to the demodulation phase. The jitter for the demodulation phase is less than one degree and the noise in the servo electronics is less than 0.1 mV in our system, so their contributions to the frequency uncertainty are 0.1 kHz and 0.3 kHz,respectively. In addition, it is reported that the jitter of the modulation width(that is,modulation index)will also change the laser frequency,so we evaluate this effect by changing the modulation width in our system. The experimental results are shown in Fig. 11(c). The measured modulation width jitter slope is −0.20±0.05 kHz/kHz.Assuming that there is a 0.1%uncertainty in the modulation width,the frequency uncertainty it causes is about 0.2 Hz.

Fig. 11. Some other frequency shifts of component a10 of R(56)32-0:(a)Alignment of the pump-and probe-beam-induced frequency shift.(b)Demodulation phase offset-induced frequency shift. (c) Modulation width offset-induced frequency shift. (d)SNR of the beat signal induced frequency shift.
The signal-to-noise ratio (SNR) of the beat signal will also affect the measured laser frequency. A low SNR will lead to a large measured frequency deviation in the frequency counter. Figure 11(d)shows the relationship between the beat SNR and the measured laser frequency. It can be seen from this figure that when the SNR is less than 20 dB, the measured frequency value will have a large deviation, and when the SNR is greater than 25 dB, the measured frequency will not be affected. In our experiment,the SNR is always kept at 35 dB, so this effect on frequency can be ignored. Since the OFC is phase locked to the hydrogen maser, the deviation of the hydrogen maser clock frequency will lead to a frequency shift. During our experiment, the absolute frequency deviation between our hydrogen maser and International GNSS Service Time(IGST)was −5.6×10⁻¹³,and the deviation between IGST and our Cs beam clock was −3.5×10⁻¹³,so the deviation between the hydrogen maser and the Cs beam clock was −9.1×10⁻¹³. Considering the link noise of the hydrogen reference, the relative uncertainty introduced by the frequency measurement was −2×10⁻¹², which corresponds to an optical frequency at 532 nm of about 1.1 kHz. In Table 2,we summarize the main uncertainties caused by different contributing factors for the iodine-stabilized laser. The total uncertainty is 5.3 kHz,corresponding to a relative uncertainty of−9.4×10⁻¹².

Table 2. Major contributions to the uncertainty of the iodine-stabilized Nd:YAG laser.
With the OFC,we measure the laser frequency when it is locked to the R(56)32-0:a10hyperfine transition of iodine and the cold-finger temperature of the iodine cell is set to −15°C.The averaged frequency is 563 260 223 505.8(2)kHz.Because we set the cold finger of the iodine cell at −15°C, which is consistent with the conditions given by the BIPM,so this frequency shift does not need to be considered. The light intensity of the pump laser used in our system is 28 mW/cm2,which is also within the range given by BIPM,so this frequency shift is not deducted. Considering the RAM noise,iodine impurity and OFC reference,the absolute frequency for the a10component of the R(56)32-0 transition is 563 260 223 514.9 kHz with a total uncertainty of 5.3 kHz in our system.Our measurement result has 2 kHz difference from BIPM’s recommended value(fBIPM=563260223513(3)kHz)for this line and agrees with it within 1σ uncertainty.
4. Conclusion
In conclusion, we built an iodine frequency-stabilized laser system based on MTS technology.The system frequency stability is less than 3.0×10⁻¹⁴for averaging times from 0.1 s to 30 s, and the reproducibility is 3.5×10⁻¹³. We performed comprehensive evaluation of the systematic shifts in the iodine frequency stabilization system. We proposed a method to evaluate the RAM-induced frequency shift, which is difficult to evaluate in MTS. Finally, the corrected absolute frequency was 563 260 223 514.9 kHz with a relative uncertainty of 9.4×10⁻¹². The frequency uncertainty of the locked laser can be further improved by more precisely evaluating the effect of iodine impurity.
猜你喜欢
杂志排行

Chinese Physics B的其它文章
- Process modeling gas atomization of close-coupled ring-hole nozzle for 316L stainless steel powder production*
- High-throughput identification of one-dimensional atomic wires and first principles calculations of their electronic states*
- Effect of tellurium(Te4+)irradiation on microstructure and associated irradiation-induced hardening*
- Effect of helium concentration on irradiation damage of Fe-ion irradiated SIMP steel at 300 °C and 450 °C*
- Optical spectroscopy study of damage evolution in 6H-SiC by H+2 implantation*
- Improved 4H-SiC UMOSFET with super-junction shield region*