Phase spectrum based automatic ship detection in synthetic aperture radar images
2021-05-20MiohuiZhngBojunQioMingXinBoZhng
Miohui Zhng ,,Bojun Qio ,Ming Xin ,Bo Zhng ,
a Henan Key Laboratory of Big Data Analysis and Processing,Henan University,Kaifeng,China
b Institute of Data and Knowledge Engineering,Henan University,Kaifeng,China
c School of Computer Science and Engineering,Beihang University,Beijing,China
Abstract This paper proposes an automatic ship detection approach in Synthetic Aperture Radar (SAR) Images using phase spectrum.The proposed method mainly contains two stages: Firstly,sea-land segmentation of SAR Images is one of the key stages for SAR image application such as sea-targets detection and recognition,which are easily detected only in sea regions.In order to eliminate the influence of land regions in SAR images,a novel land removing method is explored.The removing method employs a Harris corner detector to obtain some image patches belonging to land,and the probability density function (PDF) of land area can be estimated by these patches.Thus,an appropriate land segmentation threshold is accordingly obtained.Secondly,an automatic ship detector based on phase spectrum is proposed.The proposed detector is free from various idealized assumptions and can accurately detect ships in SAR images.Experimental results demonstrate the efficiency of the proposed ship detection algorithm in diversified SAR images.
Keywords: Ship detection;saliency detection;phase spectrum;sea-land segmentation.
1.Introduction
Compared with traditional optical remote sensors requiring a high visibility of the air,Satellite-based Synthetic Aperture Radar is an active microwave sensor which can work in nearly all weather conditions,day and night.So it has become a powerful tool for conducting the monitoring and surveillance missions on the sea surface.Ship detection via synthetic aperture radar is of great usefulness for monitoring ship traffic,fishery activity management and maritime surveillance [1-5].
When the ocean is relatively calm,the radar echo signal is very faint.Due to the backscattering coherence from the ship or between the ship body and ocean surface,ship targets usually appear brighter than the ocean background in SAR images,which makes it easy to detect ships.Unfortunately,in most cases,automatic ship detection faces the challenges posed by heterogeneous regions that are influenced by strong wind and cloud cluster.Furthermore,SAR images are inherently degraded by multiplicative noise called speckle,which makes it more difficult for further analysis.
According to various SAR images,large amounts of ship detection algorithms have been explored,such as wake-based ship detection 6,7],threshold method [8-10],contour feature based algorithm [11-13],constant false alarm rate (CFAR)method and its various variants [14-22],etc.Since the detection of ship wakes needs a heavy computational processing and the ship wakes are even invisible for some complex scenarios,literature [6]will generate a high missing rate.Jiang et al.matched the contour feature of interesting patches with the ship model,which seriously depended on the integrality and continuity of extracted ship contour [12].The classic CFAR algorithm assumes that the PDF of the sea background clutter obeys certain distribution,and the detection threshold value automatically adapts to the statistical distribution of the signal in a detection window.However,the CFAR based ship detector is not robust to speckle-degraded SAR images.
Inspired by human visual system,Yu and Bhattacharya explored visual attention based methods for ship detection in SAR images,which employed pulsed cosine transform to obtain saliency maps 23,24].Hou B.used intensity and texture features to get saliency maps,the mean and standard deviations of saliency maps are then used to compute a threshold value to discriminate ships from their background [25].Wang proposed an approach by following a two-stage framework for saliency detection [26].In the first stage,the literature extended an existing spectral residual model for better locating visual pops-out [27],while in the second stage it made use of coherence based propagation for further refinement of the results from the first step.Here,this paper will employ phase spectrum based visual attention approach to detect ship targets,which have saliency appearances because of the relatively high intensity value in sea regions.Phase spectrum can be obtained by Fourier transform.
Automatic ship detection in SAR images including both land and sea regions is an important issue;whereas,most of the aforementioned methods employed only SAR images composed of ocean but not land regions to verify their effectiveness.In order to detect ships automatically in nonhomogeneous SAR images including both land regions and sea regions,the following section will introduce an automatic ship detection method which firstly removes the relative highintensity land regions from the SAR image,and then detects ships only in ocean regions.
The remainder of this work is organized as follows.Section 2 describes the land areas removing method.Section 3 introduces the phase spectrum based approach for ship detection in SAR images.Experimental results are given in Sec.4,followed by conclusions in Sec.5.
2.Land areas removing method
Most SAR images employed by the literatures mentioned above did not contain land regions.However,automatic ship detection in SAR images should have the function of dividing SAR images into sea regions and land regions,and detecting ships exactly in sea regions.In the following section,the paper proposes a novel method for removing land areas from SAR images.
In contrast with the sea background of SAR images which has a stationary gray distribution with a low gray scale and a slow variation,land areas usually have opposite ones,which are brighter than the ocean background because of the radar echo backscattering coherence from the land areas composed of complex scenes.Thus,an appropriate threshold is utilized to remove the land regions from the whole SAR image before detection.The aim of this section is to explore an automatic threshold method which can find the appropriate threshold adaptively according to different images.
The main idea of the proposed method is to estimate the PDF of land intensity firstly,and the appropriate detection threshold is accordingly obtained.The PDF can be estimated with the pixels drawn from the land regions of the SAR image.How to obtain the sample pixels drawn from land regions plays a key role.In order to obtain such adaptive segmentation threshold,this paper proposes a reliable and tractable way.
Compared with the relatively calm ocean surface,land regions contain mountainous areas,urban areas,harbor areas,and other artificial objects with diversified textures and different geometrical shapes,which usually form large amounts of corner points.Here,Harris corner detector is employed to detect feature points in SAR images 28,29].As is shown in Fig.1 (a),the SAR image contains both land areas and sea areas.The brighter speckles located on the sea surface are ships,and the irregular brighter patches in the same region are sea clutters caused by fierce winds.The detecting feature points are labelled with bounding boxes.As is expected,most of the feature points are located on the land region,and fewer are located on the brighter speckles formed by ships.
Furthermore,image patches surrounding the center of each feature point are firstly extracted,and then,mean shift (MS)clustering algorithm is used to distinguish image patches to determine which belong to land areas or sea areas.Fig.1 (b)and (c) illustrate the clustering results.The horizontal axis of Fig.1 (b) shows the mean gray value of each patch,and the vertical axis is meaningless.Combined with Fig.1 (b) and (c)displays the different patches belonging to different clustering centers.According to certain rules,sample patches belonging to land areas are extracted to model the land intensity distribution.
Due to the relatively high gray scale and high intra-class variance,Rayleigh,Weibull,and Log-normal distribution can be utilized to model the land regions.Compared with other distributions,Log-normal distribution can have a better performance to model the land regions of SAR images [30-32].The following contents will introduce how to use the sample pixels extracted from the land regions to model the land intensity PDF [33-36].
Here,the PDF of Log-normal distribution can be expressed as,
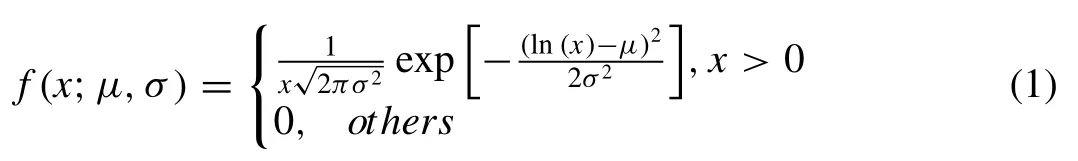
where,the shape parameterσrefers to the standard deviation ofln (x),and scale parameterμrefers to the mean ofln (x).The shape parameterσand scale parameterμcan be computed as,
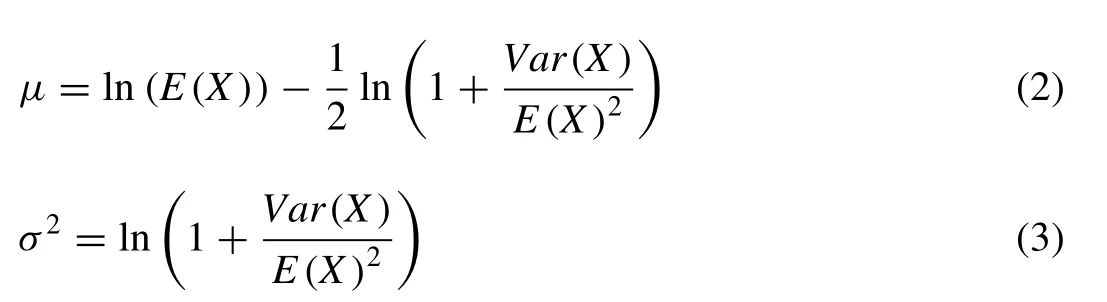
where,X=(x1,x2,x3,···xn)is the observation value which is obtained from the sample patch set extracted from land regions,and the corresponding expectationE(X)and varianceVar(X) can be easily obtained according to sample pixels extracted from land regions.When the undetermined parametersσandμare obtained,the approximate cumulative logarithmic normal distributionF(x) of land areas can also be derived.
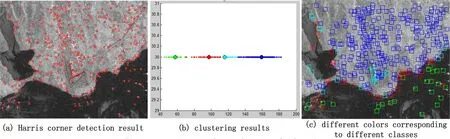
Fig.1.Extracting sample patches from land regions: (a) Harris corner detection result,(b) Clustering results,(c) Different classes labeled with different colors.
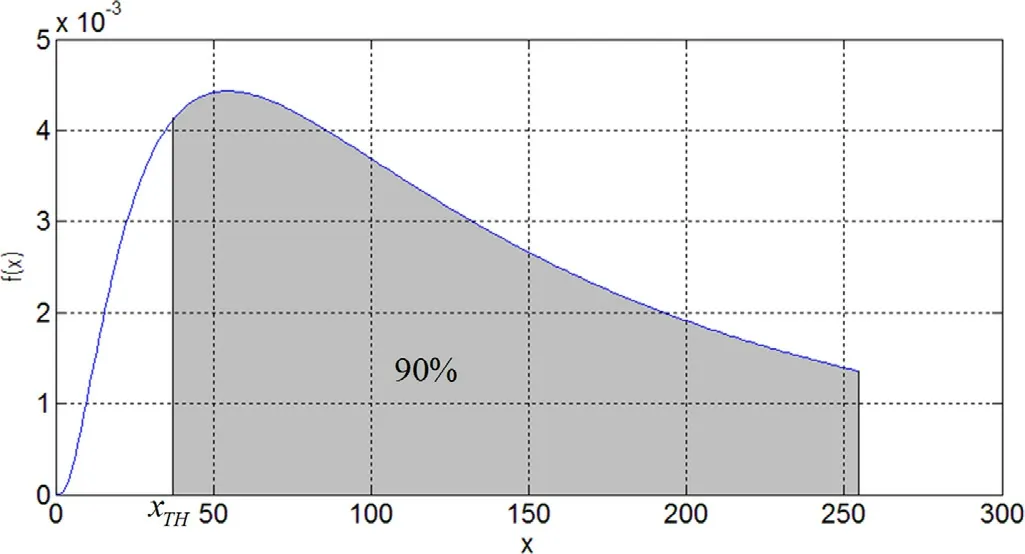
Fig.2.The PDF of logarithmic normal distribution.
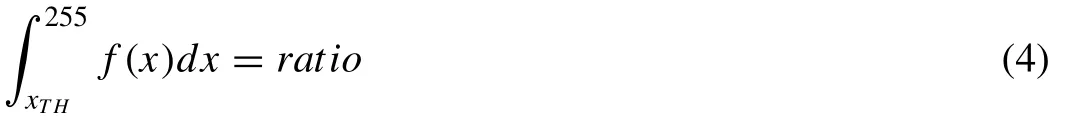
Suppose that ninety percent of land regions are expected to be detected,i.e.ratio=0.9,as is demonstrated in Fig.2,the detection thresholdxTHcan be estimated by Eq.(4):
Due to some small fractions of land areas that have a relatively low gray scale,which is even lower than that of the sea background in SAR images,some holes in land mask are to be generated.Nevertheless,morphological open and close operation can fill the holes within land mask.As is illustrated in Fig.3,the original SAR image is displayed as Fig.3 (a),and(b) shows the land mask obtained by the method introduced above.It is worth reminding that the bright specks formed by ships are deleted by morphological operation,and Fig.3 (c) is acquired with the hole-filling operation.Finally,the land area shown in Fig.3 (d) is perfectly detected.
3.Phase spectrum based ship detection
SAR images for ship detection generally include both land regions and sea regions.Therefore in order to better detect ships,land regions are firstly removed in our proposed algorithm,after which the ship detector can be implemented only on sea areas.This process is called sea-land segmentation.
Due to the high intensity in sea background,the bright specks formed by ships are very conspicuous;which guides our eyes rapidly gaze to more salient objects in a complex scene,and this process is a bottom-up selection attention mechanism in human visual system.With respect to the saliency detection,Hareletal proposed a graph-based visual saliency model [37];different from these spatial domain models,Fourier transform based methods also have been proposed [38],able to detect salient objects with less computational cost.Inspired by this mechanism,visual attention theory based ship detection is discussed in some literatures23,39].
Literature [38]discovered that,when the input is a single sinusoidal component of constant frequency,there is no distinct spike in the reconstruction by the phase spectrum alone.In contrast,when the waveform is a positive or negative pulse,its reconstruction by the phase spectrum alone contains the largest spikes at the jump edge of the input pulse.Less homogeneity or less periodicity of a location,in comparison with its entire waveform,creates more “pops out”.The same rule can be applied to two-dimension image signals as well.The whole steps can be summarized as follows:
Step 1: Given an imageI(x,y),the Fourier Transformf(x,y)can be obtained by Eq.(5):

Step 2: The phase spectrump(x,y) can be calculated as:

Step 3: The saliency map is obtained by Inverse Fourier Transform and Gaussian filter as:

where,P(f) represents the phase spectrum of the image,andg(x,y)is a 2D Gaussian filter.The following part will introduce how to utilize the phase spectrum based saliency detection mechanism to detect ships.
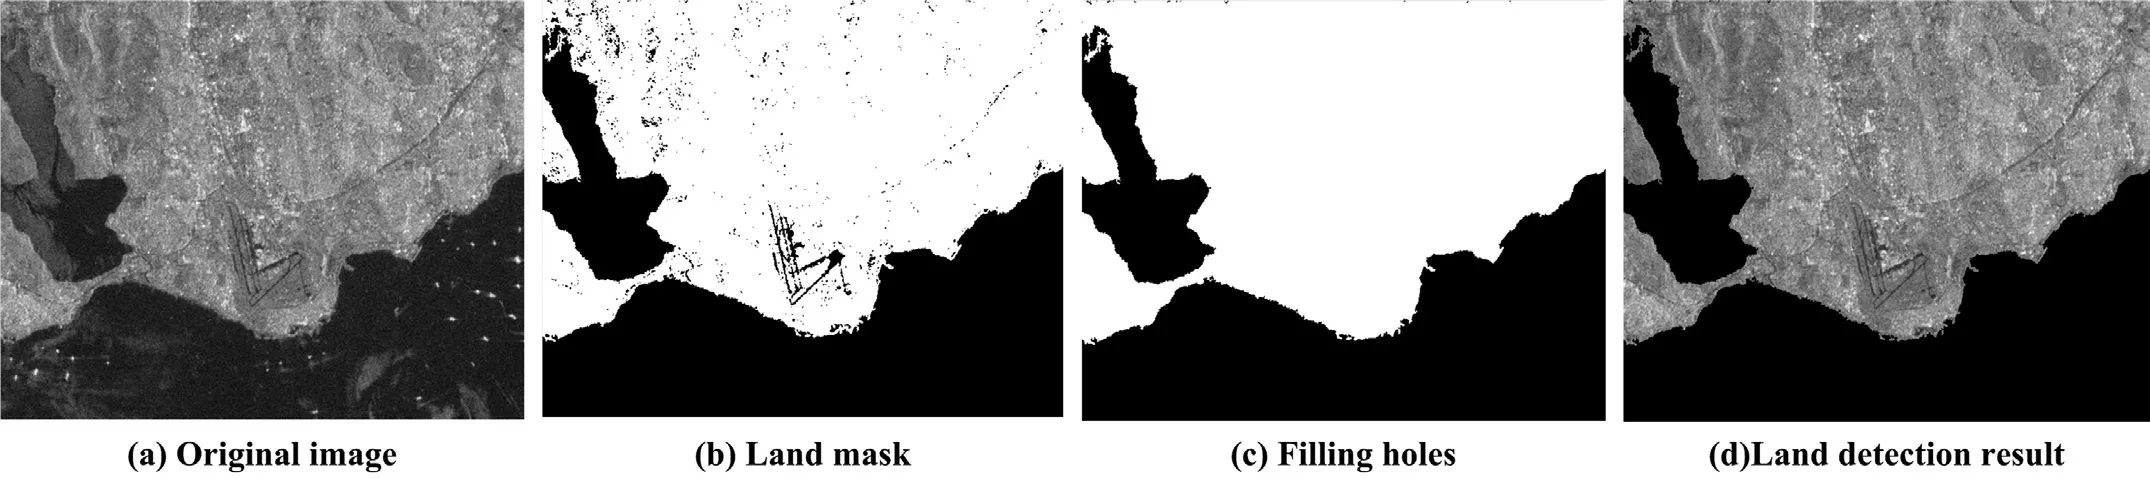
Fig.3.Land area detection: (a) Original image,(b) Land mask,(c) Filling holes,(d) Land detection result.
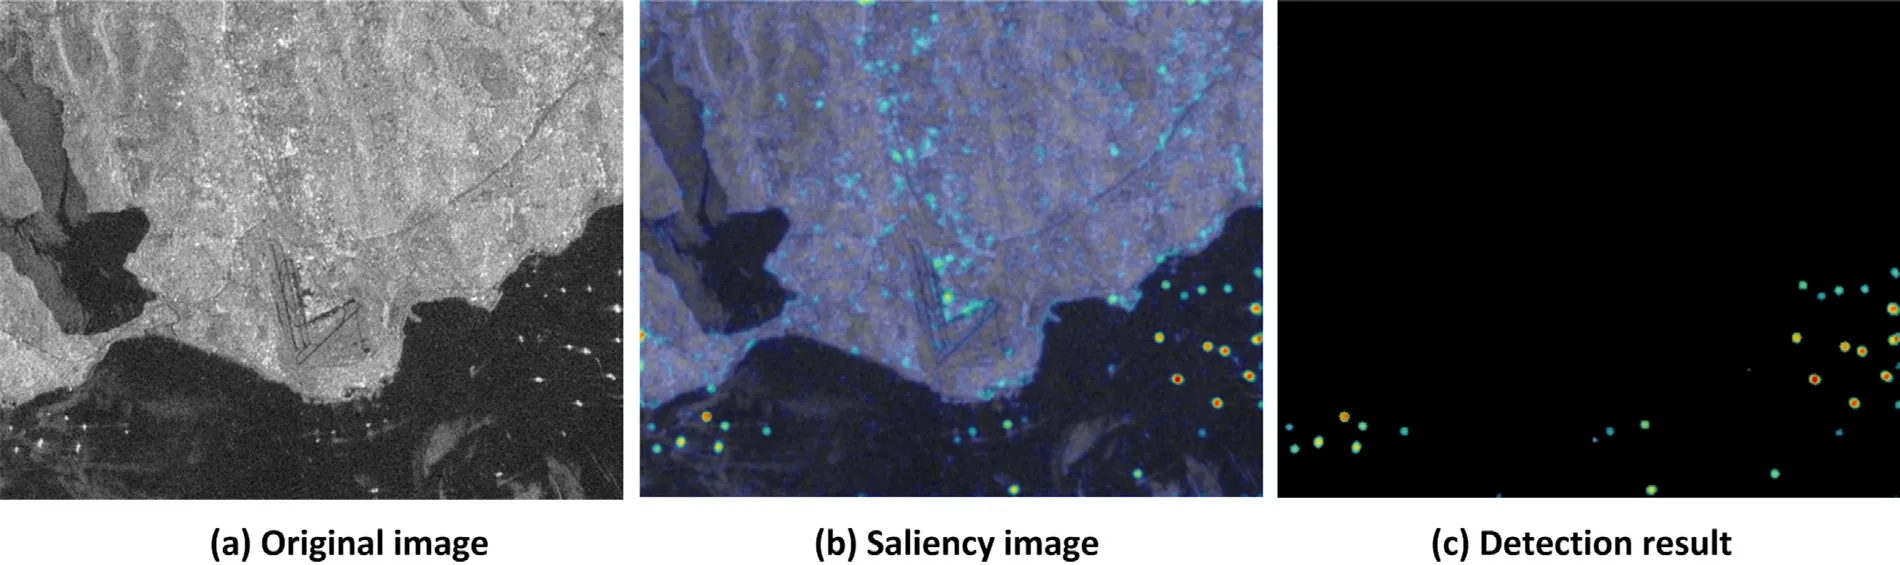
Fig.4.(a) Original image,(b) saliency heat map,(c) detection result.
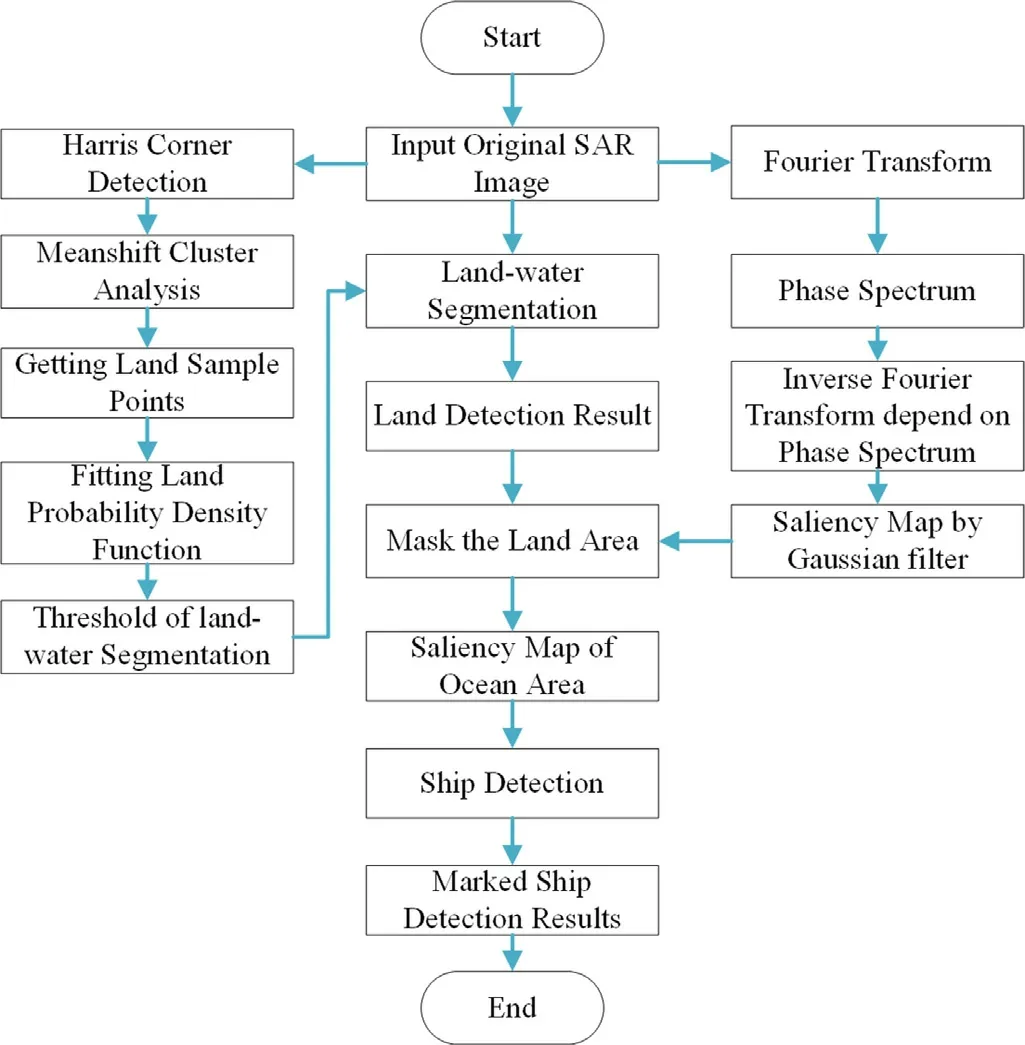
Fig.5.Ship detection algorithm flow.
As can be seen in Fig.4,phase spectrum based saliency detection is performed on Fig.4 (a) and (b) shows the saliency heat map.Combined with the land mask illustrated in Fig.3 (c),the ships pop out in the saliency heat map can be perfectly detected;Fig.4 (c) displays the detection result.

Table1 Proposed ship detection method.
In order to detect ships automatically,the automatic ships detector needs an appropriate threshold value to distinguish ship targets from the sea background in saliency maps.Here,the threshold value is computed as:

where,pmeanis the mean pixel value of the most conspicuous patch extracted from the saliency map,andcis a constant.Then,the corresponding binary ship detection map is calculated as:
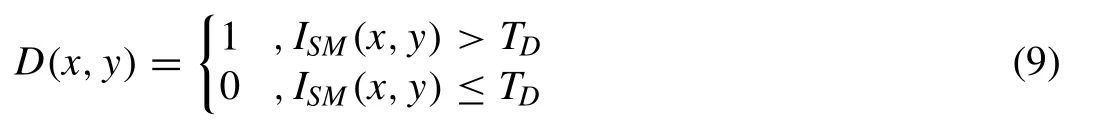
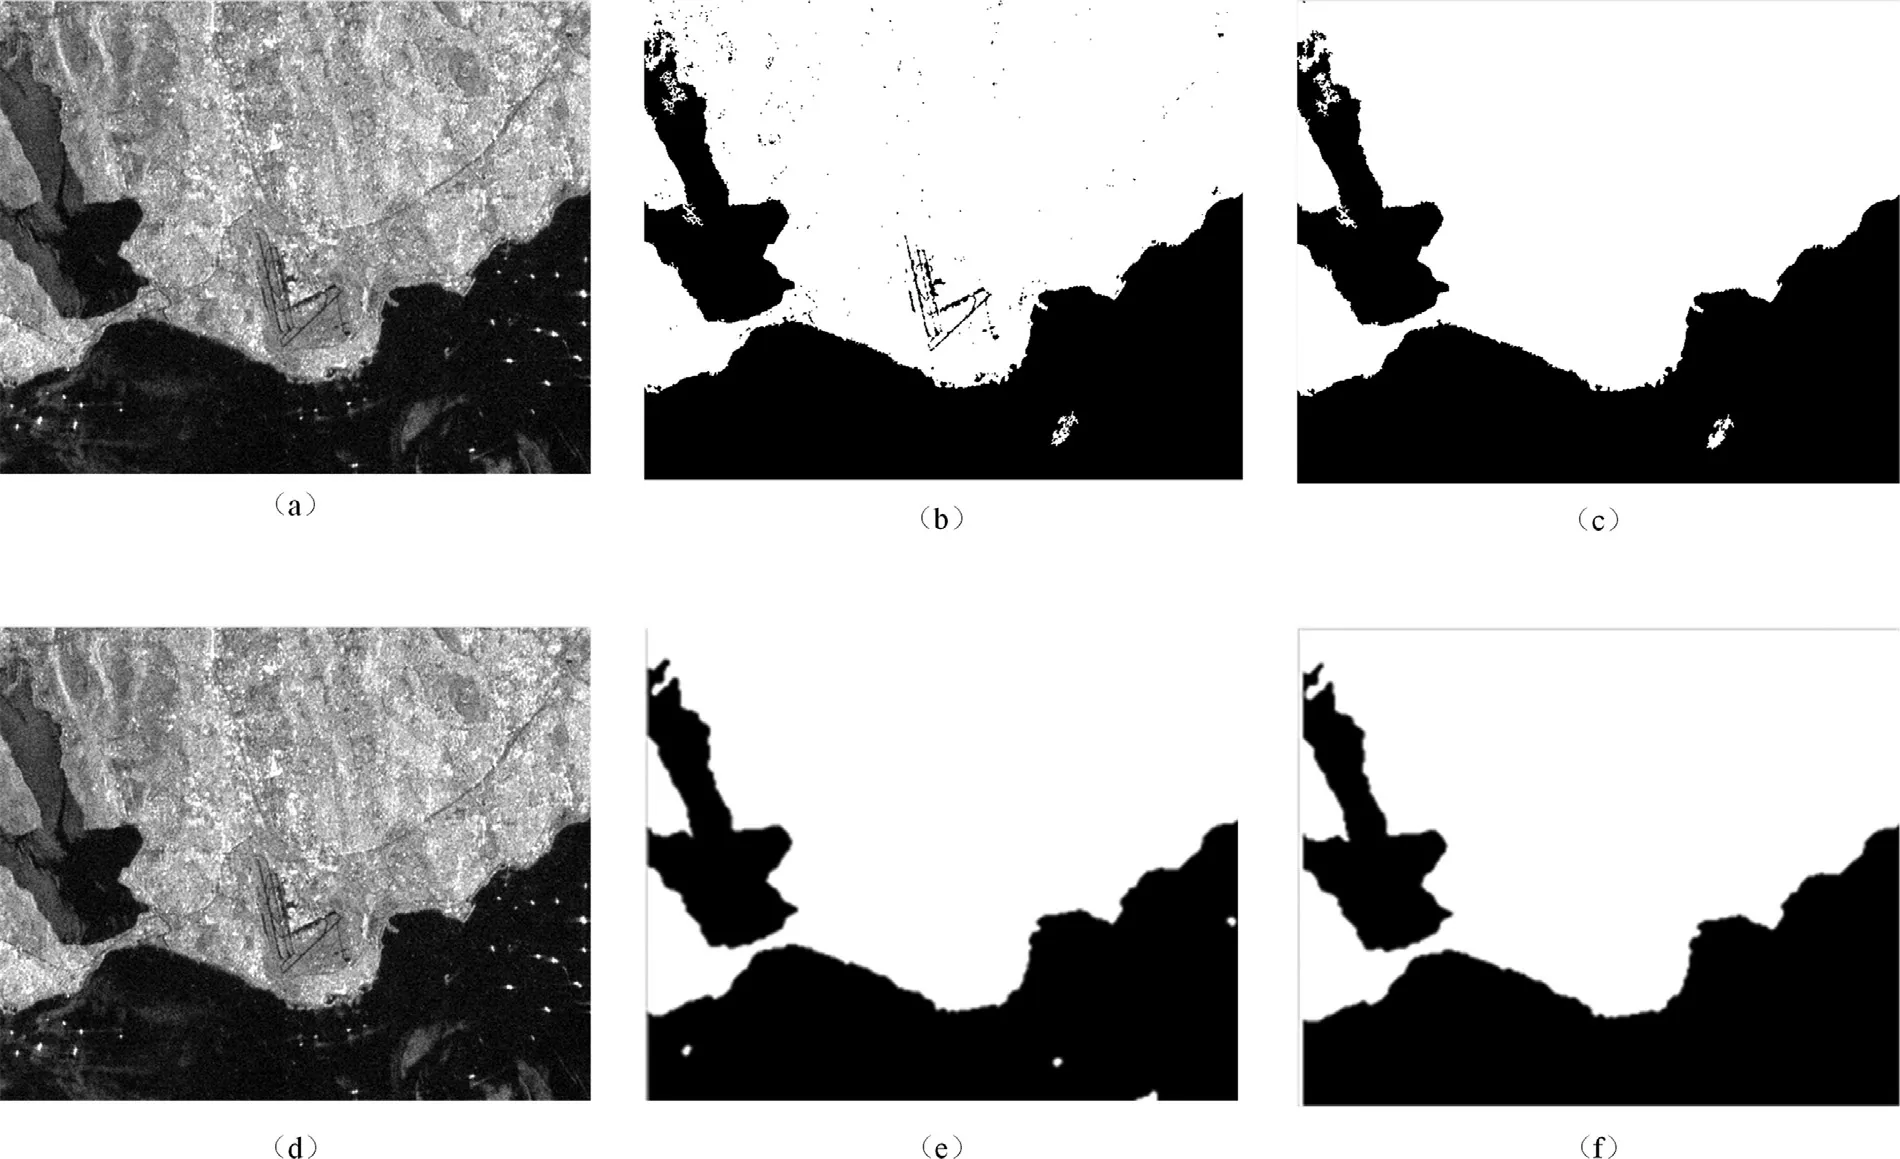
Fig.6.Otsu algorithm and ICM-MRF algorithm based sea-land segmentation: (a) Original image,(b) land mask,(c) filling holes,(d) Original image,(e) land mask,(f) filling holes.
where,ISMis the saliency map,and in the next experiment,the parametercis set to 4.Finally,the detail of the proposed ship detection method is presented in Table1 and Fig.5.
4.Experimental results
In this section,the experiments contain two parts: land region segmentation and ship detection,which are discussed as follows.
Harris corner detection is performed on SAR images by employing the same parameters ask=0.04 to calculate the response function value of corner andThreshold=20 to search for the local maxima.In addition,the parametersigmaof Gauss convolution is set to 2 and the non-maximum suppression is performed on response function value of corner by employing the parameterr=6.
4.1.Land region segmentation
The aforementioned experiment results illustrated in Fig.3 have shown the effectiveness of this segmentation.Furthermore,we will display the robustness and accuracy of our proposed segmentation method by comparing it with Otsu[39]and iterative condition model based on Markov random field (ICM-MRF) [40].It should be noted that,in order to eliminate the false alarms formed by ships and fill the holes formed by relatively low intensity land regions,our proposed method and two other algorithms will all use the same morphological operation parameters.
As a classical image segmentation method,Otsu adaptive threshold algorithm has been widely applied in image processing.Fig.6 shows the Otsu algorithm based sea-land segmentation result.Fig.6 (b) displays the binary image,which generates some holes in the airport regions because of their relatively low gray scale.The ICM-MRF algorithm has been applied to solving the problems of discrete patches and isolated points.Similarly,morphological operations,such as deleting false alarms and filling holes,are performed on the primary results obtained by the Otsu segmentation algorithm and ICM-MRF algorithm.Fig.6 (c) and (f) demonstrate the land mask by morphological operation.However,compared with Fig.3 (c),the false land foreground is also extracted from the sea region,which is very disadvantageous for the following ship detection.
29. Pigeon: Pigeons are birds having a heavy body and short legs. They can be wild or domesticated86 (WordNet). Since pigeons are often domesticated birds, they are associated with the desire to return home in dream interpretations88.
Fig.7 shows the comparing results between ICM-MRF algorithm,Otsu algorithm and our method.Fig.7 (b),7 (e)and (h) display the binary images;Fig.7 (c),(f) and (i) illustrate the final land masks after filling the holes,respectively.According to Fig.7 (b),(c),(e) and (f),due to the sea-land edge discontinuity,some holes cannot be filled by morphological operation.Thus,some land regions are not effectively detected by Otsu algorithm.Fig.7 (i) demonstrates that our proposed method has a better performance.
4.2.Ship detection
Fig.8 (a) shows the original SAR image of the Strait of Gibraltar from TerraSAR,and the TerraSAR-X data were acquired on July 5,2007,18:14 UTC in Strait of Gibraltar.As seen in Fig.8 (d),sample patches can be effectively extracted from land areas by Harris corner detector;and then,these sample patches from land area are used to fit the land PDF;finally,the land areas are exactly detected.Surprisingly,Harris corner detector can also detect ships accurately,which can be seen in Fig.1 (a) and (b).

Fig.7.Comparison between ICM-MRF algorithm,Otsu algorithm and our proposed method: (a) Original image,(b) binary image,(c) land mask after filling holes,(d) original image,(e) binary image,(f) land mask after filling holes,(g) original image,(h) binary image,(i) land mask after filling holes.

Fig.8.The process of land region segmentation: (a) Original image,(b) corner detection,(c) Clustering result,(d) Sampling land patches,(e) Land mask,(f)Land detection result.
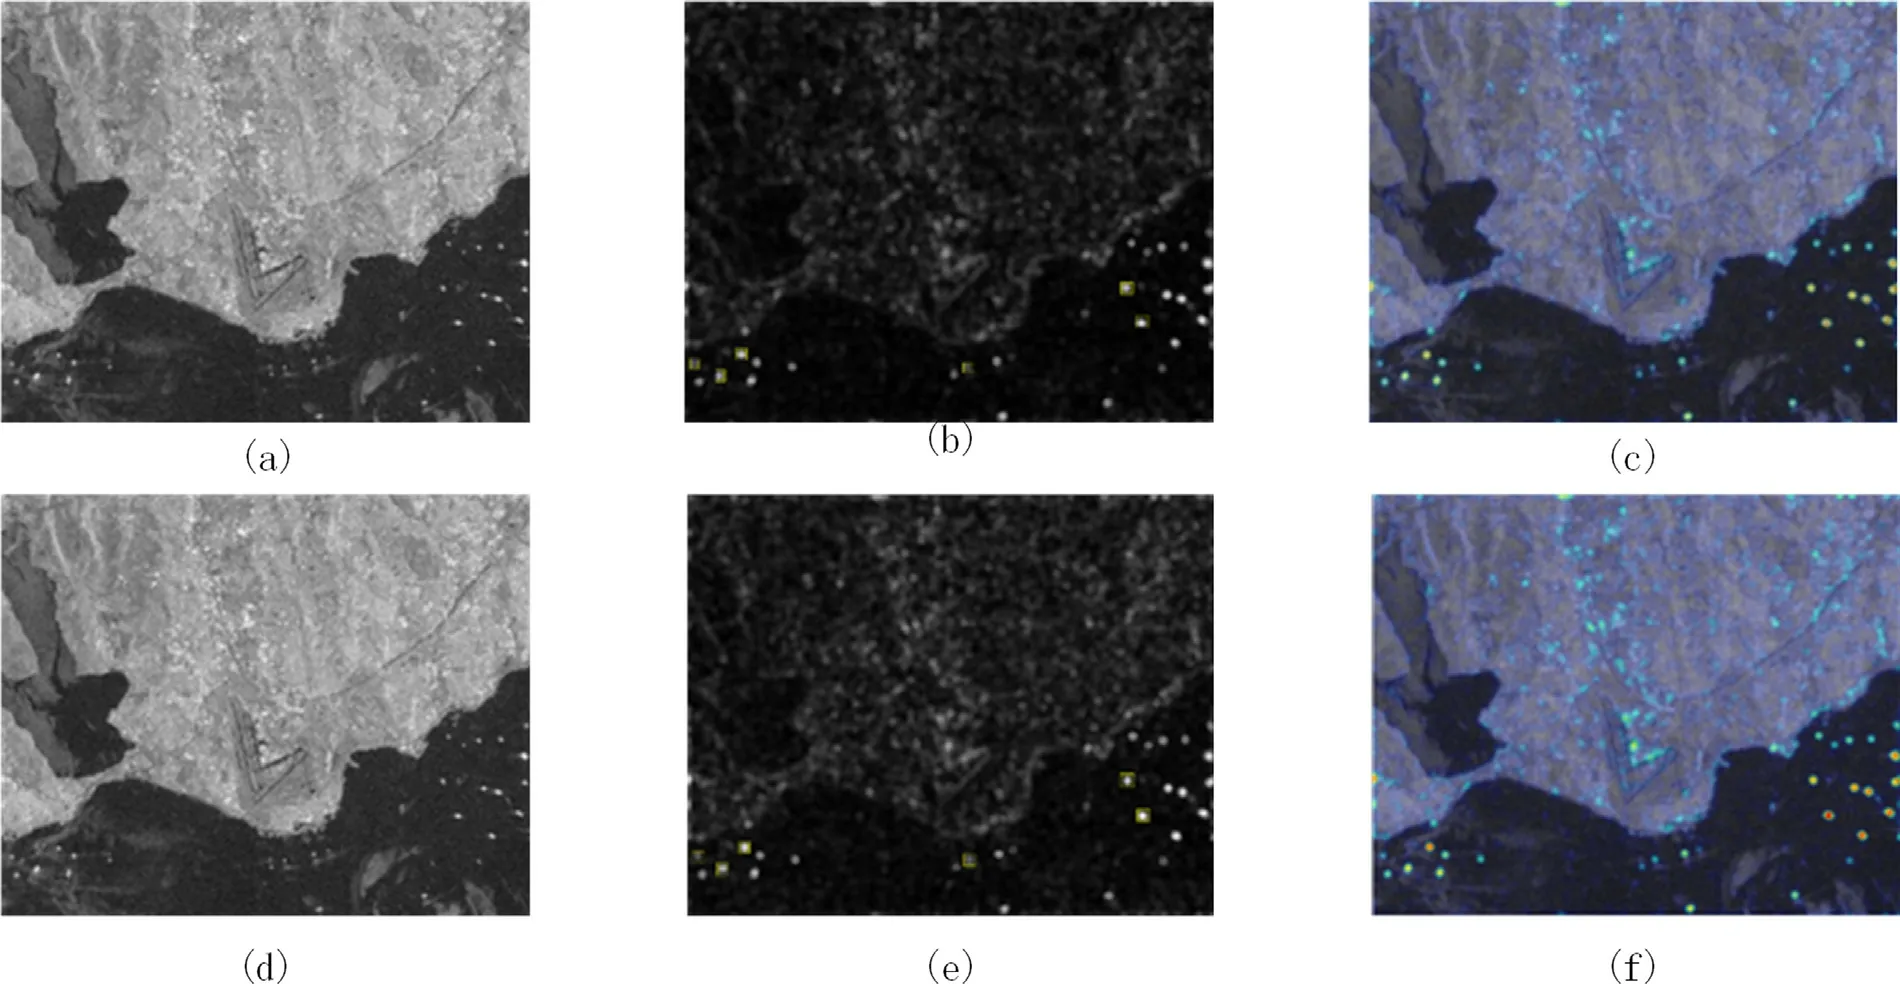
Fig.9.Saliency detection based on SR algorithm and the proposed method: (a) Original image,(b) Saliency detection,(c) Saliency heat map,(d) Original image,(e) Saliency detection,(f) Saliency heat map.
Fig.9 (b) and (e) illustrate the Saliency detection results based on SR (spectral residual) algorithm [27]and our proposed method,respectively.As can be seen in Fig.9 (b),although SR algorithm can effectively detect all the ships,the saliency of the algorithm is not as significant as that of the proposed method.Fig.9 (b) and (e) both give six annotations to detect the ship’s saliency index,as shown in Table2.Points 1 to 6 in Table2 correspond to the six ships from left to right in Fig.9 (b) and (e).Except for the first ship whose saliency index is comparable to that of the SR algorithm,the others by our proposed method obtain a satisfying performance.
Fig.10.Ship detection based on OS-CFAR algorithm and the proposed method: (a) Sea area,(b) Ship detection based on OS-CFAR,(c) Saliency heat map,(d) Ship detection based on saliency.
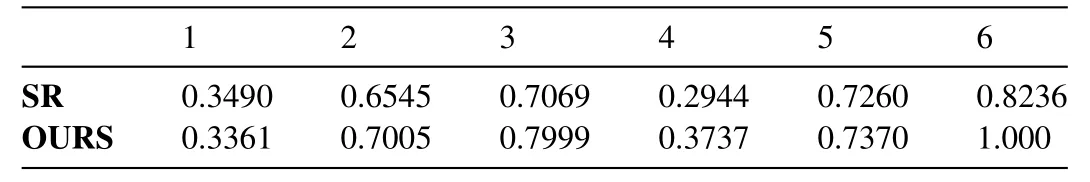
Table2 Saliency index based on SR algorithm and the proposed method.
Fig.10 (b) and (d) illustrate the detection results based on OS-CFAR (order-statistics constant false alarm rate) algorithm and our proposed method,respectively.As can be seen in Fig.10 (b),although OS-CFAR algorithm can effectively detect all the ships,large amount of false alarms is simultaneously generated.However,our proposed method obtains a satisfying performance.
Similarly,OS-CFAR algorithm and our proposed method are performed on the heterogeneous sea background illustrated in Fig.11 (a),and the detection results are shown in Fig.11 (b) and (d),respectively.It should be noted that,as demonstrated in Fig.11 (a),the sea clutter noises located on the sea surface are caused by fierce winds or other weather factors,which cause the high non-homogeneity of sea clutter in the image and make it difficult for ships detection.Even so,our method can obtain ideal detection results while the OS-CFAR method causes many false alarms.
As shown in Fig.12,the original SAR image is inherently degraded by multiplicative speckle,which poses great challenges on the automatic ship detection.Fig.12 (b) and (c)give the saliency map and the detection result by our method respectively.As can be seen,our method highlights the ships in the saliency map,and the ship’s locations pop out and can be perfectly detected.Fig.12 (d) gives the detection result by OS-CFAR.Although OS-CFAR method has an excellent recall ratio,the detection results still contain some false alarms.
As shown in Figs.10-12,each image has some challenges for ship detection.Fig.10 provides an example of several little ships on the low contrast sea surface,the lower contrast and low intensity appearance of several little ships increase the difficulty of detection.Fig.11 shows a complex sea surface with heterogeneous intensity and texture.Fig.12 gives an image which is seriously degraded by multiplicative speckle.Furthermore,in order to quantitatively evaluate the performances of the aforementioned two methods,Recall and Precision are employed.They are defined as:
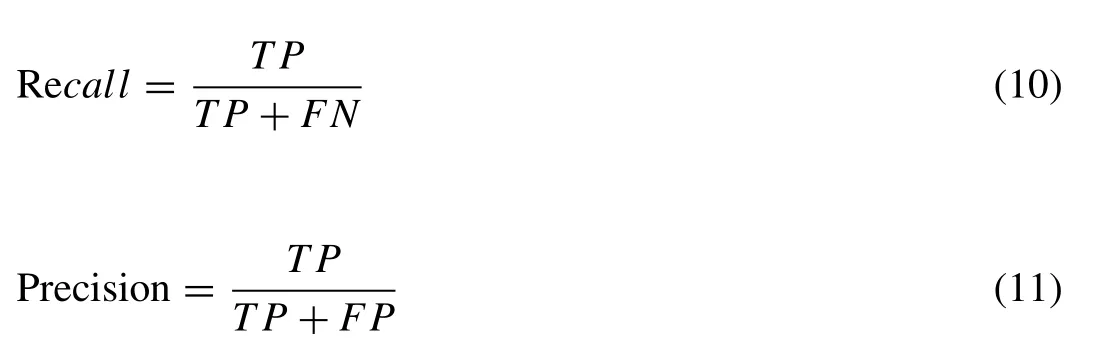
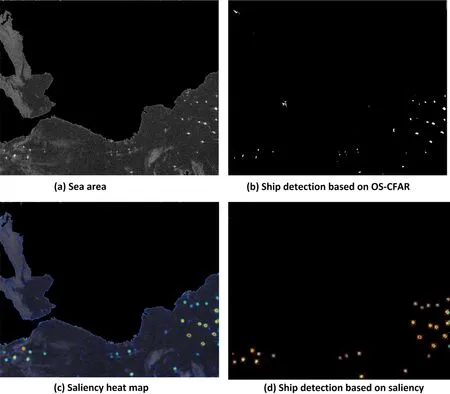
Fig.11.Ship detection based on OS-CFAR algorithm and the proposed method: (a) Sea area,(b) Ship detection based on OS-CFAR,(c) Saliency heat map,(d) Ship detection based on saliency.
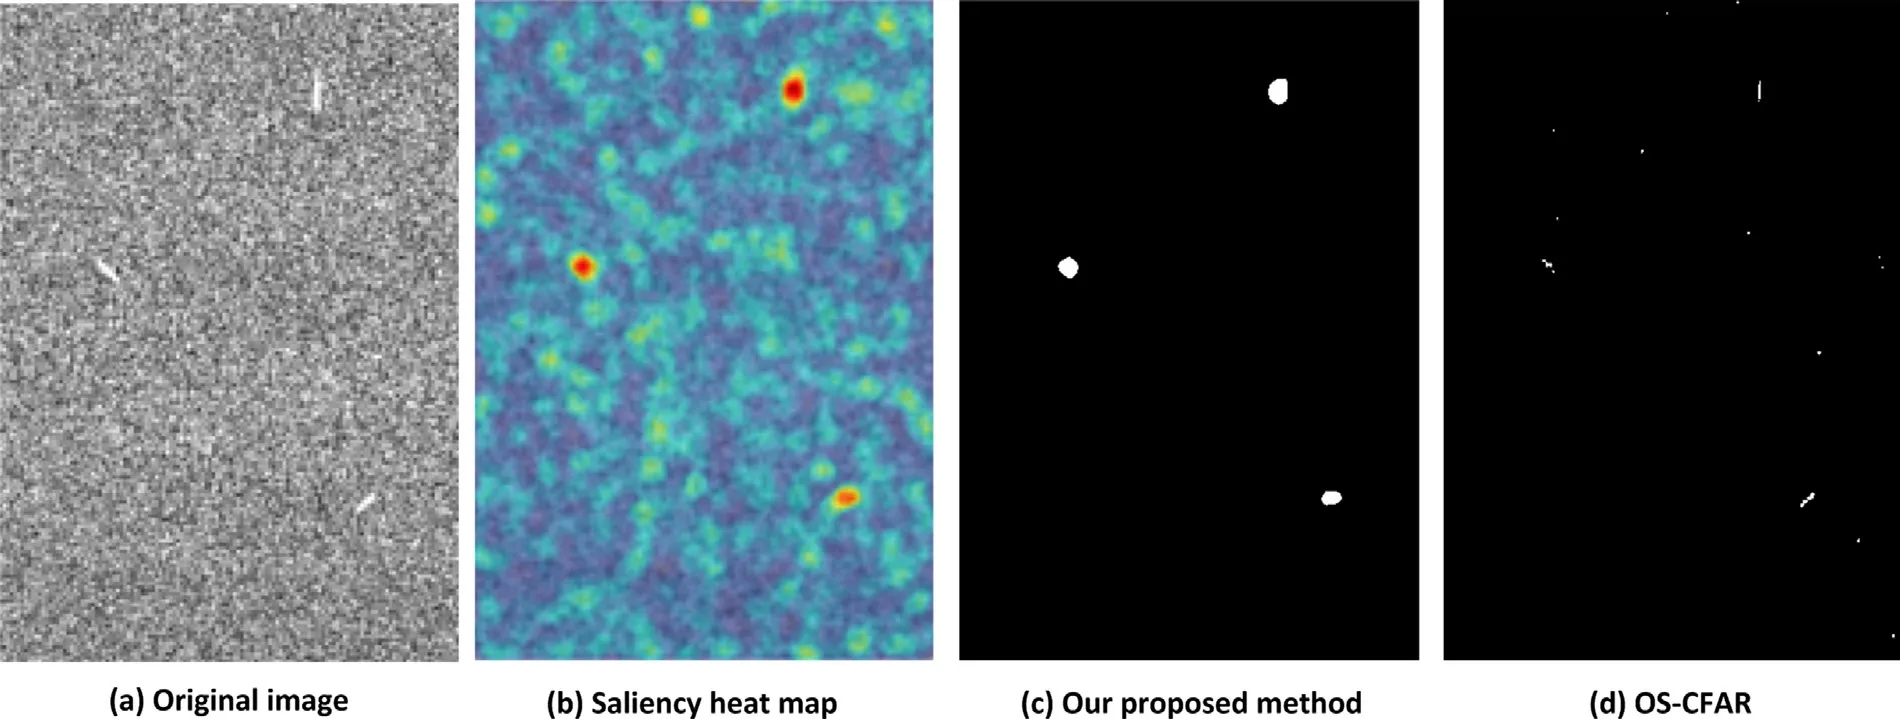
Fig.12.Ship detection based on image affected by multiplicative speckle: (a) Original image,(b) Saliency heat map,(c) Our proposed method,(d) OS-CFAR.
As demonstrated in Fig.10 - 12,the total number of real ship targets is manually counted as 16,28 and 3,respectively.The quantitative comparisons on different sea surfaces between OS-CFAR and ours are illustrated in Table3.As can be seen from Table3,although OS-CFAR obtains con-siderable high values of Recall in each image,the values of Precision drop dramatically.For ours,both Recall and Precision have stable and high values on all tested images.
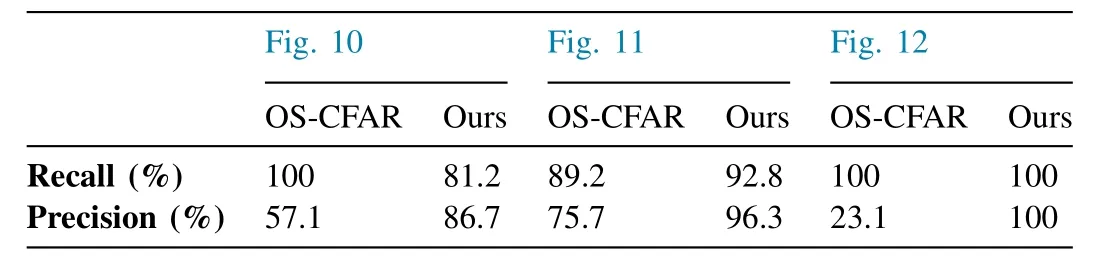
Table3 Detection results with challenging SAR images.
5.Conclusions and future research work
This paper presents an automatic ship detection approach using phase spectrum in SAR images.In order to eliminate the influence of land regions,Harris corner detector and MS clustering algorithm are employed to obtain land samples;furthermore,according to the fitting land PDF,an appropriate segmentation threshold is acquired;finally,the saliency map is generated by reconstructing the phase spectrum,and ship targets are accordingly detected.The experimental results demonstrate the satisfying performances against the low contrast,speckles and heterogeneous SAR images.In future work,we plan to further explore methods of fusing Harris corner detection results with the proposed algorithm.
The proposed method is of low complexity but high efficiency.However,there are still some limitations in it,one of which is that some parameters need to be set manually.For the future work,we will focus on the robustness and generalization ability of the proposed algorithm.
Declaration of Competing Interest
The authors declare that they have no known competing financial interests or personal relationships that could have appeared to influence the work reported in this paper.
Acknowledgements
Please add: This research was funded by China Postdoctoral Science Foundation,grant 2015M582182,Fund of Henan Province Young Key Teacher,grant 2017GGJS019,foundation of Henan Education Department,grant 19A520002,Henan Postdoctoral Foundation,grant 001703007.
杂志排行
Journal of Ocean Engineering and Science的其它文章
- Propagation of oblique water waves by an asymmetric trench in the presence of surface tension
- Fundamental calculus of the fractional derivative defined with Rabotnov exponential kernel and application to nonlinear dispersive wave model
- Data learning and expert judgment in a Bayesian belief network for aiding human reliability assessment in offshore decommissioning risk assessment
- Fluid dynamics of a self-propelled biomimetic underwater vehicle with pectoral fins
- Numerical analysis of an over-boarding operation for a subsea template
- Bivariate joint distribution analysis of the flood characteristics under semiparametric copula distribution framework for the Kelantan River basin in Malaysia