Continuous droplet rebound on heated surfaces and its effects on heat transfer property: A lattice Boltzmann study∗
2021-05-06QingYuZhang张庆宇QiPengDong董其鹏ShanLinWang王山林ZhiJunWang王志军andJianZhou周健
Qing-Yu Zhang(张庆宇), Qi-Peng Dong(董其鹏), Shan-Lin Wang(王山林),Zhi-Jun Wang(王志军), and Jian Zhou(周健),†
1Shagang School of Iron and Steel,Soochow University,Suzhou 215137,China
2State Key Laboratory of Environmental-Friendly Energy Materials,School of Materials Science and Engineering,Southwest University of Science and Technology,Mianyang 621010,China
3State Key Laboratory of Solidification Processing,Northwestern Polytechnical University,Xi’an 710072,China
Keywords: droplet rebound,heat transfer,droplet impact,lattice Boltzmann model
1. Introduction
The heat transfer properties for the case of droplets impinging on heated surfaces are of great importance in industrial applications, such as cooling systems for electronic devices,internal combustion engines, and alloy casting.[1,2]When a liquid droplet is deposited on a surface having a temperature far higher than the boiling point,the droplet is likely to be levitated by its vapor due to the vigorous boiling at the droplet bottom. This phenomenon is named the Leidenfrost effect,[3]in which the droplet little contacts the solid surface,presenting a superhydrophobic state. As a result,the droplet is insulated by the vapor film and the efficiency of heat transfer to the solid surface is somewhat low.[4]
For a liquid droplet on a hot surface,the liquid–gas phase change not only influences the temperature field and hence the heat transfer property,but also affects the droplet state on the hot surface.[5]Consequently, the effects of liquid–gas phase change,heat transfer property,and droplet state have complex interactions. Many experimental studies have been performed to investigate the droplet state on heated surfaces and its heat transfer property. Shen et al.[6]used high-speed infrared thermography to measure the evolving temperature of the droplets during their impacting on a smooth hot surface and nanostructured hot surface. The morphological characteristics of the droplets on the hot surfaces were observed,which include the typical spreading and retraction behavior. It was found that in the case of droplet impinging on the nanostructured surface the heat transfer for evaporative cooling is enhanced compared with that on the smooth surface. The dynamics and temperature variations of droplets impinging on superhydrophobic hot surfaces were also analyzed by using simultaneous high-speed video and infrared imaging in the work of Guo et al.[7]It was observed that the droplet rebounds from the superhydrophobic surface after the spreading and retracting stages, and the heat transfer property is dependent on the cavity fraction of the superhydrophobic surface. Even though the experimental setup based on infrared thermography can capture the hydrodynamics and temperatures of the impinging droplets on hot surfaces, at present it is still a challenge to quantify the temperature variations and heat distributions in the vapor phase,which are supposed to influence the heat transfer efficiency.
Owing to the rapid development of computer hardware and numerical modeling, several computational fluid dynamics (CFD) models have been developed for dealing with the multiphase flow problems.[8,9]The techniques of numerical modeling could fully trace the quantities of density, temperature, and pressure for each node in the computation domain, which have attracted great attention in the research field concerning the heat and mass transfer in a gas–liquid–solid coexisting system.[10,11]Combined with the experimental observation, a coupled level-set and volume of fluid(VOF) model was used to simulate the gyrating motion of an impacting droplet on a smooth surface with heterogeneous wettability.[12]Through the simulation results,the correlation between the driving force for the gyrating motion and the surface heterogeneity was established. Pasandideh-Fard et al.[13]studied the cooling effectiveness of a droplet impinging on a smooth hot surface by using the VOF model. The droplet morphological evolution and the heat transfer efficiency, under the conditions of various impact velocities and surface temperatures, were simulated and compared with the experimental observation. The influence of the impact velocity on the heat flux from the hot surface is found to be trivial. In addition to the VOF approaches, the multiphase flow models based on the lattice Boltzmann(LB)method have emerged as a powerful alternative for handling the interfacial phenomena that involve solid surfaces with complex geometries,since the LB model inherently has the merit of easily dealing with the solid–fluid boundary conditions.[14–16]Ma et al.[17]and Li et al.[18]carried out the LB simulations of pool boiling on rough surfaces having micro-pillars by using the thermal multiphase LB model, which the calculations of fluid flow and temperature fields, as well as the liquid–gas phase change are incorporated into. The bubble nucleation on the micro-pillar surfaces and bubble morphology change during rising were reproduced. The local wettability and pillar geometry were found to affect the transient heat flux on the solid–fluid boundary drastically,and the heat transfer coefficient is not a monotonic function of superheat. Li et al.[19]performed the LB simulation of self-propelled Leidenfrost droplets on ratchet surfaces.The driving force of the droplet motion was found to include the asymmetry of the ratchets and the vapor flows underneath the droplets. The phenomenon of Leidenfrost droplets over a heated liquid pool was simulated by using a hybrid LB model in the work of Qiao et al.[20]The simulation results not only reproduced the distribution of temperature and velocity near the Leidenfrost droplet,but also visualized the effects of various dimensionless numbers on the evolution of the evaporation dynamics.
In the previous articles by some of the present authors,[21,22]the LB simulations of droplet condensation and evaporation on rough surfaces composed of micro/nano-pillars were performed under isothermal conditions. Yet, the heat transfer properties in the cases concerning liquid–gas phase change were not characterized. In the present work,a thermal multiphase LB model[19,23,24]is employed to investigate the behavior of droplet impacting on smooth surface and rough surface, in which the rough surface is composed of microholes. After validating the correctness of the code, the morphologies of the droplets on the smooth and micro-hole heated surfaces are compared with each other. The influences of intrinsic wettability and superheat of the surfaces on droplet state and heat transfer property are analyzed in detail.
2. Model description
In the thermal multiphase LB model, the flow field in a gas–liquid–solid system is calculated by the pseudopotential approach, while the heat transfer calculation is implemented by the finite difference method(FDM).Unlike the traditional CFD methods that calculate the flow fields by solving the Navier–Stokes equations, the LB model characterizes the macroscopic flow phenomena by describing the streaming process and collision process of the pseudoparticles. The mathematical deduction of the thermal multiphase LB model can be found in the work of Li et al.,[19,23,24]and we only present the essence of this model in the present article.
The LB equation in the multi-relaxation-time (MRT)scheme is written as


where the elements are the relaxation times. In the present work, the relaxation times are set to be τρ=τj=1.0, τe=τζ=1.25, and τq=10/11, respectively. The values of τν,which determine the kinematic viscosity,are set to be 0.9 and 1.1 for the liquid phase and gas phase,respectively.
The collision process of the pseudoparticles can be expressed as


Table 1. Simulation parameters used in the present work.
The equation for heat transfer calculation is written as[19]


In the LB calculation of the flow field, the bounce-back boundary condition is employed on the solid–fluid boundaries,whilst the periodic boundary condition is adopted on the domain walls. In the heat transfer calculation, the temperatures of the liquid and gas nodes adjacent to the solid boundaries remain constant,which are implemented by the Dirichlet boundary condition. The boundary condition of the domain walls is selected as the Neumann(zero-flux)type.
3. Results and discussion
3.1. The D2 law test and simulations of contact angle and surface tension


Fig.1. Simulated squared non-dimensional droplet diameters versus time.

Fig.2. Simulated intrinsic contact angle versus solid–fluid interaction strength.
Since the solid–fluid interaction strength,Gw,determines the intrinsic wettability of the solid phase,it is necessary to obtain the correlation between Gwand the intrinsic contact angle,θ. In the beginning of the contact angle simulation,a droplet with 20-lu radius is placed on the smooth surface. The temperature in the computation domain is uniform and is set to be T =0.73Tc. After the droplet achieves the equilibrium state,which needs 40000 ts–50000 ts in the cases,the contact angle is determined. Figure 2 illustrates the simulated intrinsic contact angle,θ,as a function of solid–fluid interaction strength,Gw.The insets present the snapshots of different intrinsic contact angles of the droplets. It is seen that the intrinsic contact angle increases with Gwincreasing, and the variation trend of the θ–Gwcurve is identical with that of previous work by some of the present authors.[25]
In addition,the surface tension,γ,is quantified as the temperature,T,evolves.In the present study,the values of the surface tension are obtained according to the Laplace’s law in the two dimensions,[25]∆p=γ/R,where R and ∆p are the radius and the pressure difference between the inside and the outside of an equilibrium droplet. Under isothermal conditions at different temperatures,static droplets with various radii equilibrating with the surrounding gas phase are simulated.By linearly fitting the ∆p–1/R plots,the slopes of the ∆p–1/R lines correspond to the values of surface tension. Figure 3 shows the plot of the surface tension versus temperature. The unit of the surface tension is lu·mu·ts−2,where mu is the abbreviation of mass unit. It can be seen that the surface tension decreases with temperature increasing in a nearly linear manner, which has the same trend as the experimental data of the surface tension of water.[28]

Fig.3. Simulated surface tension versus temperature.
3.2. Droplet impacting on smooth and rough hot surfaces
The phenomena of droplet impacting on hot surfaces are investigated through numerical simulations using the thermal multiphase LB model. Two types of solid surfaces are considered, i.e. smooth surface and rough surface with microholes. The solid–fluid interaction strength, Gw, is set to be−1.4, so that the intrinsic contact angle, θ, is determined to be 21.7◦(see Fig.2) in this subsection. In a 300 lu×520 lu computation domain,a 30-lu radius droplet is initialized above the smooth/rough surface with a height of 120 lu. Under the effect of gravity, the droplet starts to fall until touching the smooth/rough surface. The initial temperature of the droplet and the surrounding vapor are both set to be 0.73Tc,while the temperature of the solid surface maintains 1.16Tc. As a result,the superheat is calculated to be ∆T =0.43Tc.
Figure 4 presents the morphological evolutions for water density, pressure, and temperature fields of the droplet in the process of impacting on the smooth hot surface, respectively. Before the droplet reaches the smooth surface (see 3000 ts),the temperature of the droplet and the temperature of surrounding vapor are both lower than that near the hot solid surface. At the simulation time of 5500 ts,the droplet presents an elongated shape after landing on the smooth surface. Local boiling occurs in the solid–liquid contacting area, which consumes heat, hence leading temperature to decrease in the nearby area. As shown at 6500 ts, the droplet bounces a little bit on the smooth surface and retracts horizontally. Under the effect of gravity,the droplet bottom quickly returns to the solid surface at 8000 ts and resumes to a transient spherical shape at 8500 ts. Then, the droplet repeatedly touches and leaves the heated surface,displaying a‘trembling’state on the smooth surface until being totally evaporated. In this period,the droplet almost remains spherical and has little morphological change.This is because only a small portion of the droplet bottom contacts the heated smooth surface, and local boiling occurs subsequently. The small area between the droplet and the heated surface turns into the vapor phase immediately,so that the droplet bottom retracts and leaves the heated surface. Under the effect of gravity,a small portion of the droplet bottom contacts the heated surface again, and the local boiling takes place accordingly. The repeated contacting-boilingleaving behavior generates the above-described ‘trembling’state. The panels of the temperature field show that the vapor region near the droplet becomes even cooler than the droplet.Yet,in the panels shown by the pressure field,the pressure in the vapor is relatively uniform,and it remains lower than that inside the droplet. Thus,for the case of droplet impacting on the smooth hot surface,the local boiling at the contacting area influences the temperature field effectively. However, the effect of local boiling on the pressure distribution in the vapor is limited.

Fig.4. Simulated evolution of water density,pressure,and temperature fields for droplet impacting on smooth heated surface,respectively. Simulated evolution can also be seen in Supplementary video 1.
Figure 5 exhibits the simulated evolution of droplet impacting and bouncing on the rough hot surface decorated with micro-holes. The micro-holes are indicated by the arrows on the first panel that is shown by the density field. The width,spacing, and depth of the micro-holes are 5, 5, and 10 lu, respectively. The other simulation conditions are identical with those of Fig.4. In Fig.5, it is obvious that the droplet rebounds much higher than that in Fig.4. At the simulation time of 5000 ts, the droplet also lands and spreads on the rough hot surface. In addition to the higher pressure inside the droplet, however, the pressure in the micro-holes underneath the droplet is found to be higher than in the other vapor areas. Accordingly, the high pressure spontaneously drives the droplet to move upwards, which is indicated by the upward flow velocity vectors around the droplet in a period from 5000 ts to 7000 ts. Then, in the process of droplet flying in the vapor, the two ends of the droplet merge, and the droplet presents an elongated morphology at 8000 ts. The droplet lands on the rough surface at 12500 ts and then rebounds periodically in the following computation process. As shown by the temperature field in Fig.5, the heat in the micro-holes is consumed during droplet touching the rough surface,since the micro-holes and solid‘pillars’become visible in this transient period. This is because local boiling occurs at the droplet bottom when the droplet contacts the rough hot surface, which absorbs a large amount of heat. Therefore,a great number of water molecules turn into vapor immediately,which inflate the micro-holes rapidly. Meanwhile, the micro-holes underneath the droplet are blocked by the droplet,so that the vapor pressure inside the micro-holes abruptly increases. As a result, a vapor cushion with higher pressure is formed underneath the droplet. When the underneath pressure exceeds the droplet gravity, the droplet is forced to move upwards. The comparison between Figs. 4 and 5 shows that the micro-holes in the hot surface provide the favorable sites for generating a vapor cushion with high pressure, which facilitates the continuous rebound of the droplet.
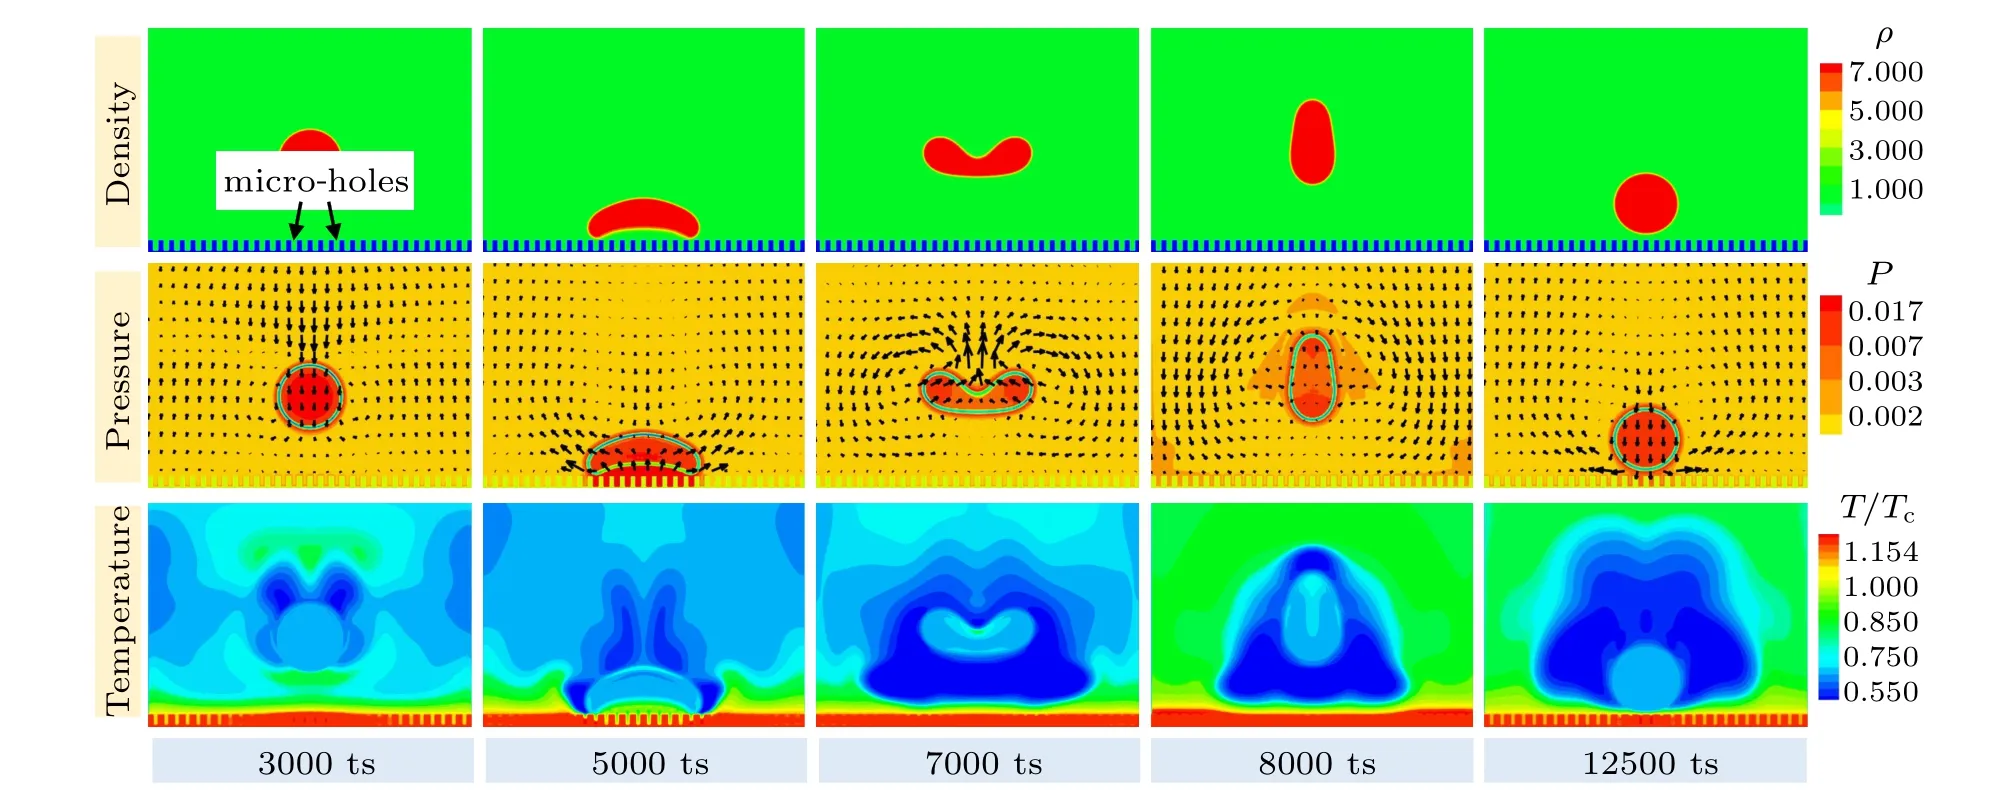
Fig.5.Simulated evolution of water density,pressure,and temperature fields for droplet impacting on a heated micro-hole surface,respectively,with simulated evolution seen in Supplementary video 2.

Fig.6. Comparison of time evolution of(a)droplet height,(b)pressure underneath the droplet,(c)droplet volume,and(d)relative temperature of the droplet,between droplet impacting on the smooth hot place and droplet impacting on rough hot surface.
For the simulations of droplet impacting on the smooth and rough hot surfaces, the droplet height (HDrop), pressure underneath the droplet (P), droplet volume (VDrop), and relative temperature of the droplet (TDrop/Tc) are recorded and plotted in Fig.6,respectively. In Fig.6(a),the value of HDropis calculated for the centroid of the droplet. As shown in Fig.6(a), for the case of droplet impacting on the rough hot surface with micro-holes,the oscillation of the droplet height denotes the behavior of the continuous droplet rebound. The maximum height of the rebounding droplet is found to decrease with time increasing before it becomes relatively stable. For the case of droplet impacting on the smooth hot surface, however, the height of the droplet almost remains identical with the droplet radius after 20000 ts, implying that the droplet is static in this period. It is seen in Fig.6(b) that the pressure underneath the droplet also presents obvious oscillations, which correspond to the data of droplet height plotted in Fig.6(a). The peaks of the pressure curve appear when the droplet touches the surface and local boiling occurs. For the case of droplet impacting on the smooth surface, some oscillations of the pressure curve are visible in the early stage,but they resume to a small value in the late stage. This denotes that the gaseous water molecules produced by the local boiling effect are unable to be reserved underneath the droplet,so that high pressure is hardly generated on the smooth surface.Moreover,as shown in Fig.6(c),the droplet volume decreases,while the droplet temperature increases, varying with time in both cases. Apparently,the decrease of the droplet volume is due to the effect of evaporation and local boiling, while the increase of the droplet temperature is due to the superheat between the droplet and the hot surfaces. For the case of droplet impacting on the rough hot surface, neither the volume nor temperature curve is smooth. This is because the decrease of droplet volume and the increase of droplet temperature essentially occur when the droplet contacts the rough surface. Since the droplet presents a continuous rebounding behavior on the rough surface, the curves in Figs. 6(c) and 6(d) present obvious oscillations. The oscillations of the temperature curve are also visible for the droplet impacting on the smooth surface,which corresponds to the‘trembling’state of the droplet.On the other hand, it is seen that within the entire simulation process the temperature of the droplet on the rough surface is lower than that on the smooth surface. The transient heat flux between the hot micro-hole surface and the continuously rebounding droplet should be higher than that in the other case,since a greater temperature difference exists between the droplet and the heated surface. Thus, it is expected that the behaviour of continuous droplet rebounding on the micro-hole surface is beneficial to elevating the efficiency of heat transfer.
3.3. Effects of intrinsic wettability on droplet rebound on micro-hole surfaces
In order to further investigate the phenomena of droplet rebounding on the hot surfaces with micro-holes,the LB simulations are carried out by setting different values of the solid–fluid interaction strength,Gw. The geometrical parameters of the micro-holes are identical with those in Fig.5. The values of Gware set to be Gw=−1.2 and Gw=−1.6, which determine the intrinsic contact angles to be θ = 33.3◦and θ =18.0◦,respectively. Figure 7 exhibits the simulated evolution of density,pressure,and temperature fields in the process of droplet impacting on the heated micro-hole surfaces with intrinsic contact angles of θ =33.3◦and θ =18.0◦. In each column,the snapshots are taken at the same time step. As shown in Fig.7(a), in the early stage, the droplet rebounds a little bit. It is obvious that the pressure in the micro-holes increases as the droplet contacts the heated surface. However,the pressure is not high enough to support the continuous rebounding behavior. As a result,in the late simulation stage,the droplet gradually resides on the micro-hole surface and remains stable.This phenomenon is similar to the cold Leidenfrost regime of a droplet on a heated superhydrophobic surface reported in the work of Bourrianne et al.[29]On the other hand, it is seen in Fig.7(b) that the droplet rebounds continuously in the entire simulation period, which is similar to the case of Fig.5. In particular,the rebounding droplet in Fig.7(b)is found to jump higher than that in Fig.5,denoting that the better intrinsic wettability is beneficial to producing the continuous rebounding behavior. In addition, it can be observed at 90000 ts that the droplet volume in Fig.7(b) is smaller than that in Fig.7(a).Thus, in the case of Fig.7(b), bigger fraction of the droplet evaporates in the process of continuous rebound, which consumes more heat in the surrounding area of the heated surface.Therefore,it is expected that the heat transfer efficiency for the case of Fig.7(b)should be better than that of Fig.7(a).
In addition to the qualitative comparison in Fig.7, the time evolution of height, underneath pressure, volume, and relative temperature of the droplets on the rough surfaces having different intrinsic wettabilities are quantified as shown in Fig.8. Figure 8(a) shows for the case of Gw= −1.6(θ = 18.0◦), the droplet height oscillates obviously, which corresponds to the continuously rebounding behavior of the droplet. Additionally,a comparison of Fig.6(a)with Fig.8(a)shows that the peaks of the droplet height curve for the case of Gw=−1.6(θ =18.0◦)in Fig.8(a)are higher than those for the case of Gw=−1.4(θ =21.7◦)in Fig.6(a).Yet,within the period from 0 ts to 90000 ts,the time of droplet contacting the rough surface in the case of Gw=−1.6(θ =18.0◦)is smaller,since the droplet jumps higher and spends more time in the air.For the case of(Gw=−1.2,θ =33.3◦),however,the oscillations are only visible in the early stage,and the droplet height almost remains stable in the late stage. In Fig.8(b), repeated oscillations of the pressure underneath the droplet are observed for the case of Gw=−1.6(θ=18.0◦)in the whole simulation period, while the pressure for the case of Gw=−1.2(θ =33.3◦) remains relatively stable in the late stage. Thus,under the condition of Gw=−1.2 (θ =33.3◦), it is demonstrated that the vapor cushion is unable to be formed. For the case of Gw=−1.6 (θ =18.0◦), the P–t curve oscillates drastically, and the transient maximum values of the underneath pressure are higher than those when setting Gw=−1.4(see Fig.6(b)). In addition, it can be seen that the varying trends of the curves in Figs.8(c)and 8(d)are similar to those in Figs. 6(c) and 6(d). For the case of Gw=−1.6, the plots of VDrop–t and TDrop/Tc–t present decreasing and increasing tendencies with obvious fluctuations. However, the plots for the case of Gw=−1.2 are more smooth,especially in the late stage of the simulations. Apparently, the variations for these curves are determined by the different states of the droplets on the micro-hole surfaces with various intrinsic wettabilities. For the rough surface having better intrinsic wettability, the solid phase has a stronger local adsorption effect on the fluid particles. Thus, the liquid water is easier to enter into the micro-holes during droplet impact, and hence more gaseous water is produced due to the immediate local boiling in the micro-holes. This mechanism can also be observed in Fig.8(c), in which the decreasing rate of the droplet volume on the micro-hole surface with better intrinsic wettability(Gw=−1.6, θ =18.0◦) is apparently higher than that in the other case. As a result,a vapor cushion with higher pressure is generated on the micro-hole surface with better intrinsic wettability,so that the droplet could bounce higher.

Fig.7. Simulated evolution of water density,pressure,and temperature fields for droplet impacting on the heated micro-hole surfaces with intrinsic contact angle of(a)θ =33.3◦and(b)θ =18.0◦by setting Gw=−1.2 and Gw=−1.6,with simulated evolution seen in Supplementary videos 3 and 4.
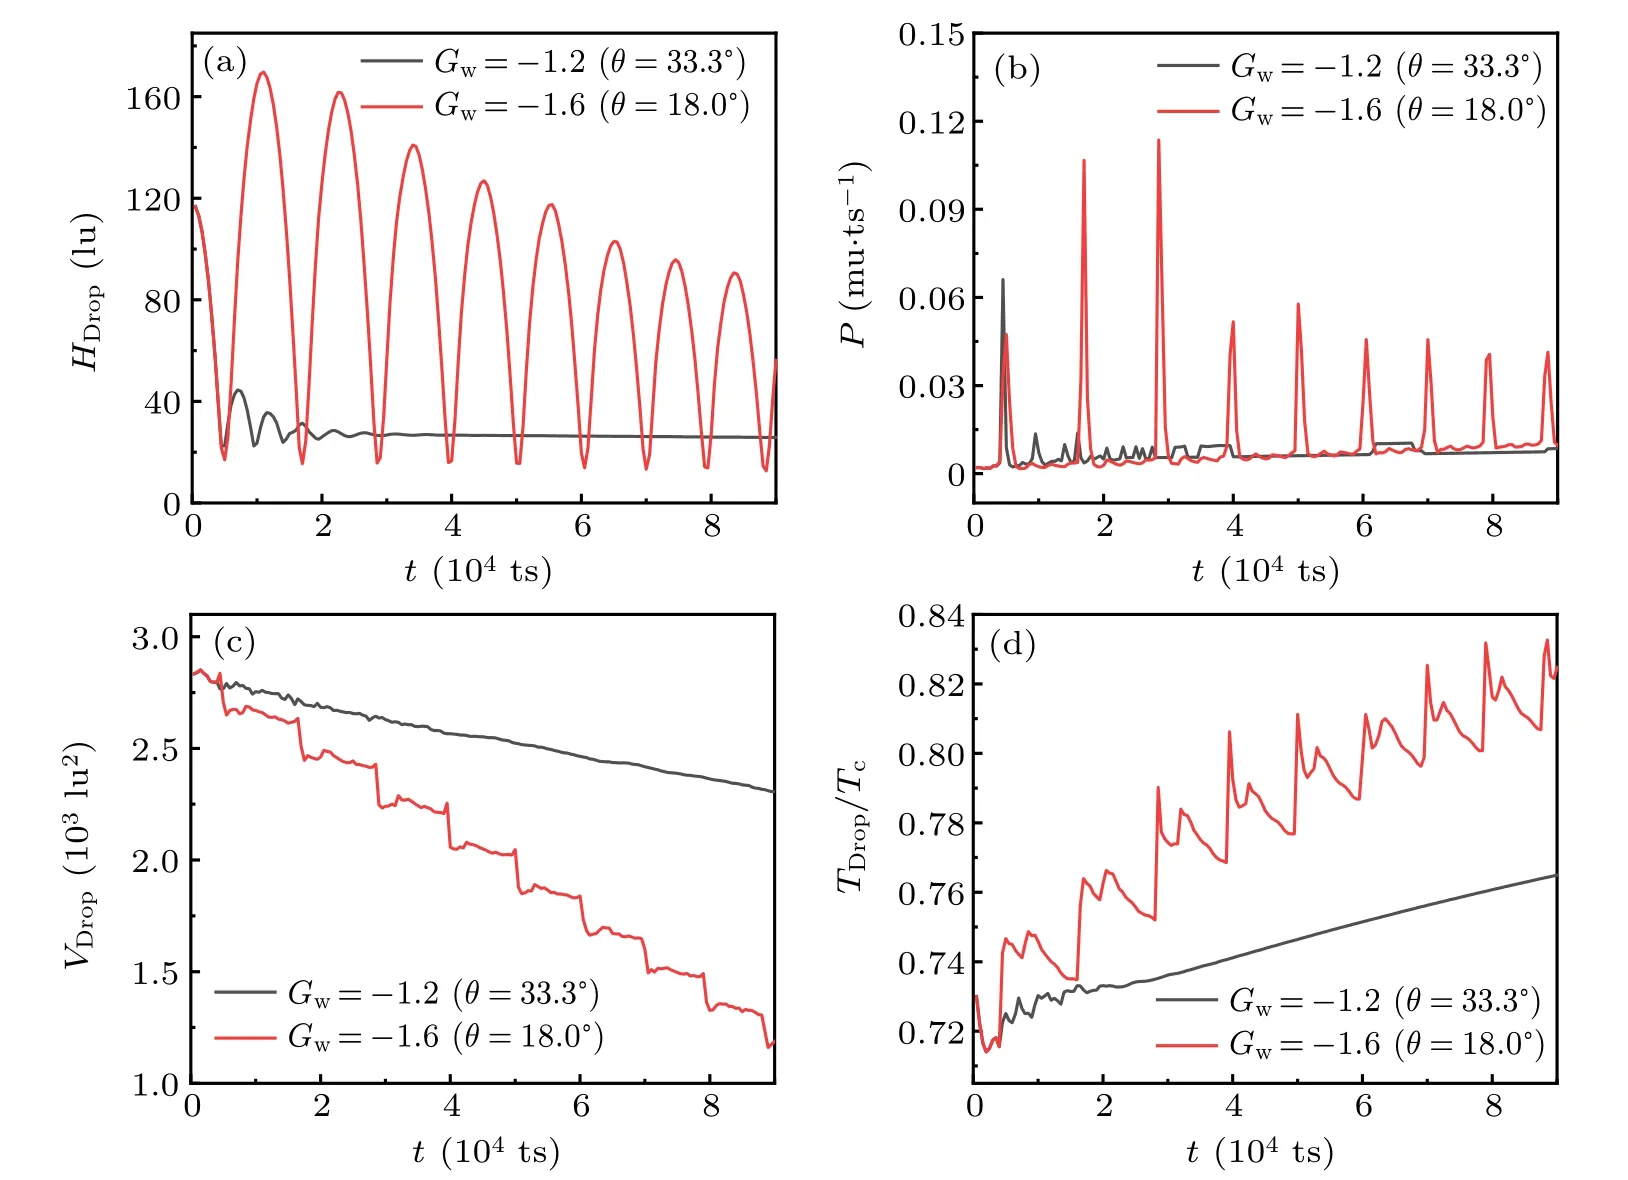
Fig.8. Comparison of time evolution of(a)height,(b)underneath pressure,(c)volume,and(d)relative temperature for droplet impacting on hot micro-hole surfaces with different intrinsic wettabilities between Gw=−1.2(θ =33.3◦)and Gw=−1.6(θ =18.0◦).
3.4. Heat transfer analyses of droplet impacting on smooth and micro-hole surfaces

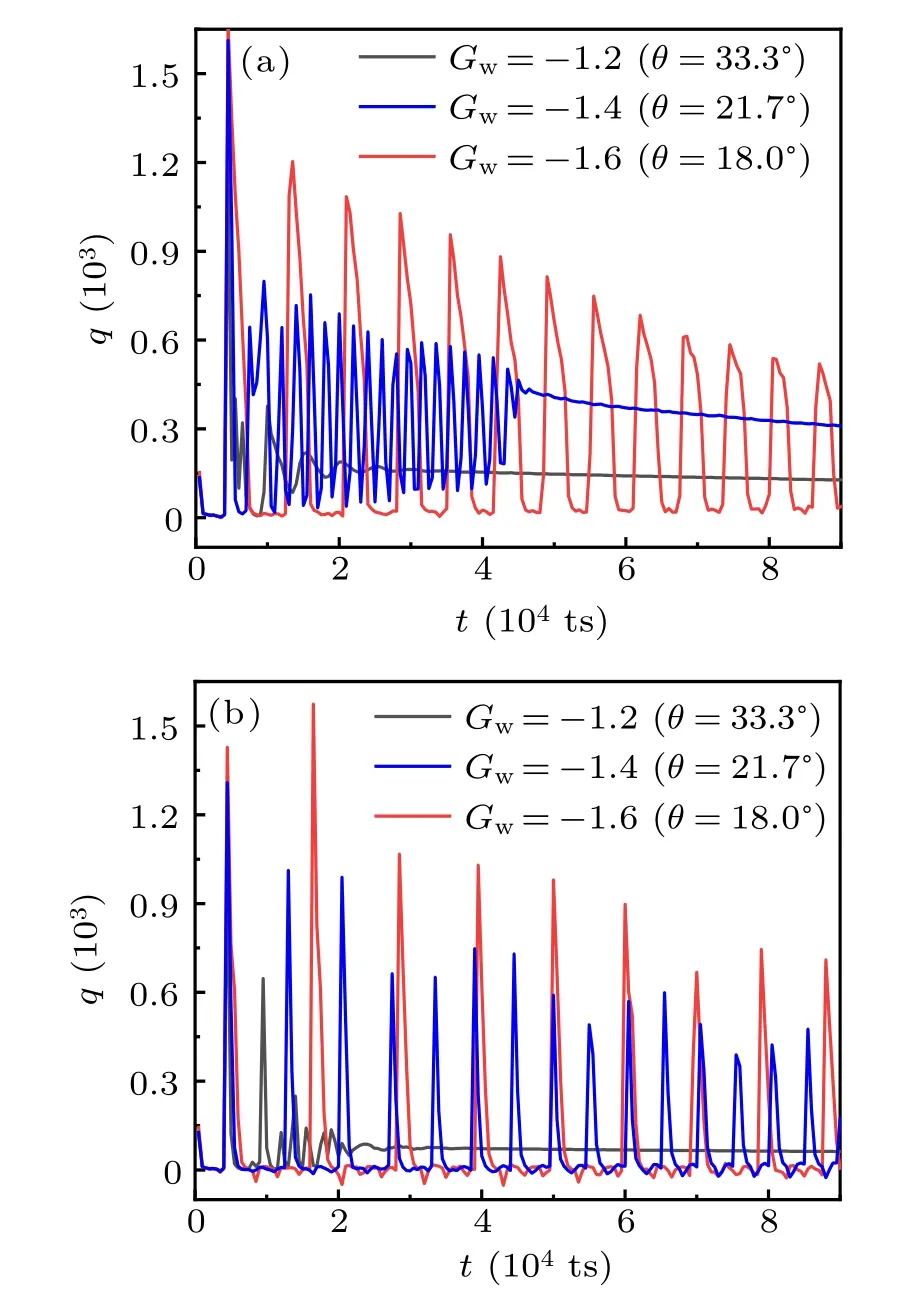
Fig.9. Time-dependent transient heat flux during droplet impacting on (a)smooth and(b)rough hot surfaces with various intrinsic wettabilities.
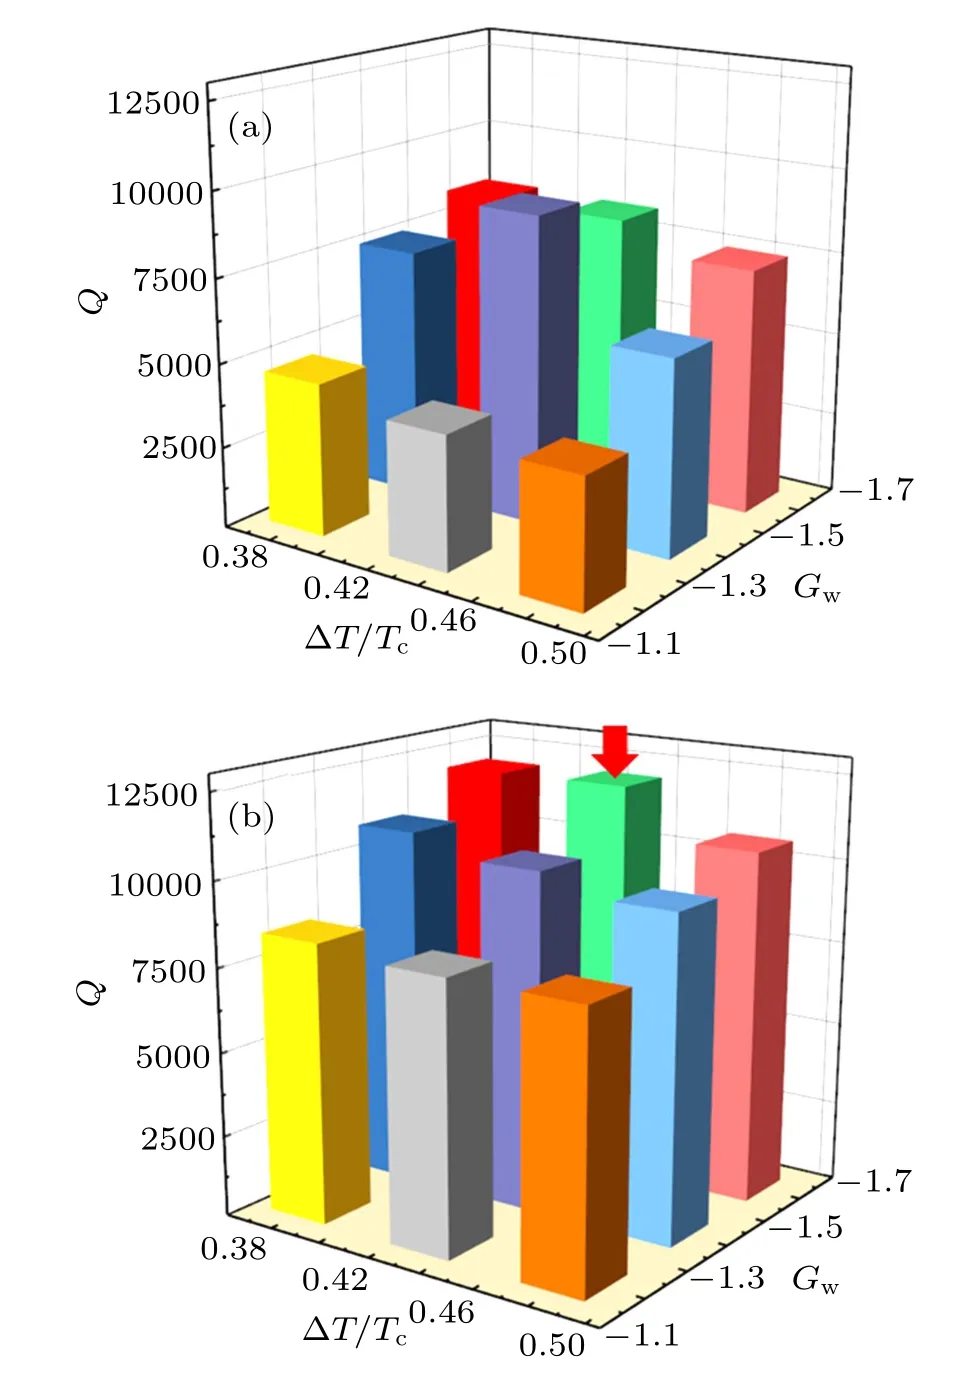
Fig.10. Comparison between(a)total heat quantity,Q,during droplet impacting on smooth surface and(b)that on micro-hole surfaces for various values of superheat, ∆T, and different intrinsic wettabilities controlled by Gw. Red arrow in panel (b) indicates the set of data with maximum value of Q on micro-hole surface.
4. Conclusions
The phenomena of droplet impacting on hot surfaces and the heat transfer features are studied through numerical simulation by using a thermal multiphase LB model. For the simulation of quasi-steady evaporation,the simulated squared droplet diameter is found to decrease linearly with time increasing, which is consistent with the D2law. The intrinsic contact angle of the droplet,θ,and the temperature-dependent surface tension,γ,are simulated. It is demonstrated that θ increases as the solid–fluid interaction strength, Gw, increases,while γ decreases nearly linearly with temperature rising.
The droplet impacting on the hot surface is simulated by using the thermal multiphase model. It is revealed that a fairly good intrinsic wettability is necessary to produce the continuous rebounding behavior of the droplet,while the presence of the micro-holes facilitates this phenomenon. For the case of droplet impacting on the heated surface decorated with microholes, the continuous rebound of the droplet is due to the periodically high-pressure vapor cushion generated by the local boiling of the droplet bottom. It is demonstrated that the continuous droplet rebounding is beneficial to enhancing the heat transfer efficiency. The total heat in the period from 0 ts to 90000 ts is calculated and compared as the intrinsic wettability (Gw, θ) and superheat (∆T) vary. The total heat quantity on the micro-holes surface is generally higher than that on the smooth surface. It is found that the total heat on the micro-hole surface achieves a maximum value in the case of Gw= −1.4 (θ = 21.7◦) and ∆T = 0.43Tc. The simulation results not only visualize the morphological evolution of the droplets, but also provides an insight into the complex interactions among the multiphase flow dynamics, heat transfer,liquid–gas phase change, and pressure field evolution during droplet impacting on heated surfaces.
猜你喜欢
杂志排行

Chinese Physics B的其它文章
- Quantum annealing for semi-supervised learning
- Taking tomographic measurements for photonic qubits 88 ns before they are created*
- First principles study of behavior of helium at Fe(110)–graphene interface∗
- Instability of single-walled carbon nanotubes conveying Jeffrey fluid∗
- Relationship between manifold smoothness and adversarial vulnerability in deep learning with local errors∗
- Weak-focused acoustic vortex generated by a focused ring array of planar transducers and its application in large-scale rotational object manipulation∗