面向绿色基础设施的城市信息学:纽约市行道树数据收集、分析与公众科学的综合研究
2021-04-19来源王钰林添怿
著:来源 译:王钰 校:林添怿
0 引言
大数据和物联网的兴起产生了观察、测量、量化和分析城市的新方法,为研究城市动态系统提供了新的契机。在城市环境中收集的大批量、高精度、高质量的数据使我们能够从不同尺度和维度对城市时空属性进行研究。新的数据整合和分析进一步揭示了城市景观与人类活动之间复杂的相互作用关系,以及其对社会—生态—经济产生的长期影响。数据分析和人工智能技术已在城市基础设施的各个子系统中得到广泛应用。先前的相关研究已对城市环境中的交通运输、能源利用、商业零售、人居活动以及其他社会经济活动的时空动态进行了广泛讨论。
相比之下,城市树木所具有的时空特征仍有待学者进行更加广泛和深入的研究。在大部分城市中,有关城市绿色基础设施(尤其是树木)的数据挖掘、集成和分析相对较少,而且数据难以获取。行道树是城市景观系统的重要组成部分,具有丰富的生态、环境和美学价值。然而,目前许多城市中行道树的信息缺失限制了研究人员对当地城市林业进行准确的现状评估和调查。具体体现在哪些因素(例如地理条件、城市形态、城市设计和当地社会经济条件)影响了城市树木的布局、位置,以及相应的空间格局在社区尺度上如何进一步影响当地的环境条件、公众健康、归属感和生活质量。对城市景观进行数字化分析有助于进一步探索“量化场所”(quantifying place)的方法,理解如何通过整合多源且异构的城市数据来获取具有高时空分辨率和高维度的地点特征[1]。这种量化方法可以进一步将普适计算过程中产生的数据转化成可以应用于具体地点的超本地化智能(hyper-local intelligence),从而通过数据分析和机器学习来实现城市环境中的地域与情境感知(locational and situational awareness)[2]。
本研究介绍了现今与城市树木相关的数字化研究和实践。文献综述总结了与行道树密切相关的研究与实践,例如行道树在生态韧性、环境健康、城市设计质量、社区文化建设等方面如何发挥作用,以及城市信息学如何将树木数据应用于城市设计规划与数据驱动的运营管理。本研究介绍了公众科学(citizen science)的概念,其作为一种参与性的数据收集方法如何能够丰富城市林业的数字化过程和数据利用,并创造额外的社会效益和教育意义。随后的案例研究聚焦于纽约市的树木普查计划,详细说明了该城市树木数据项目的动机、规划、实施过程以及后续的研究应用。考虑到城市系统的生态—社会—技术复杂性,笔者提出了一个包含数据集成、协作和公民参与的城市信息框架。该框架总结了新数据和技术如何扩展我们对于城市林业时空动态的理解。
1 文献综述
1.1 作为绿色基础设施的城市林业
行道树作为城市绿色基础设施的重要组成部分,具有改善局部小气候、促进环境健康、定义社区景观文化、提升生活品质的作用。从生态与环境健康角度出发,城市树木可通过降低温室气体排放、调节温度、净化空气等产生长期的环境效益、促进身心健康[3-4]。研究证明,行道树的种植和管理是维持城市绿色基础设施的重要组成部分[5]。据统计,纽约市城市林业对包括雨洪控制(每年总计34亿L)和空气净化(每年总计减少 2 200t污染物)在内的生态环境影响,每年大约可产生1.22亿美元(约7.97亿人民币)的经济效益[6-7]。从城市设计的角度出发,树木作为街景的重要组成部分,在车辆交通和行人之间具有建立视觉秩序、进行物理缓冲的作用,同时还可以提升公共空间的品质[8]。
行道树通常是由规划师和风景园林师共同设计的城市景观。城市林业的空间格局不仅受到地理和气候因素影响,还受到城市形态、规划政策和设计决策的影响。随着城市中精细粒度数据的增多,越来越多的研究开始对城市树木的空间格局以及相应的生态环境影响进行量化和比对分析。例如,有研究收集了来自美国58个城市的数据以调查不同地区影响城市树木覆盖率的潜在因素。结果表明,城市局部的树木覆盖率主要取决于该区域具体的土地利用特征[9]。而城市树木分布的空间差异会进一步形成不同的小气候条件,具体体现在城市中不同地点的温度差异。例如,一项对美国多个城市中树木分布与局部地区温度的比对分析表明,同一时间里,城市中不同地区的温度差异最大高达12 ℃,温度差具体取决于土地利用和树木覆盖率[10]。遗憾的是,在大多数情况下,这种空间差异并不是随机偶然的,而是由之前的城市规划决策和景观设计造成的。树木的空间差异也引发了规划决策更深层次的问题,例如环境公平(environmental justice)伦理争议和潜在的城市设计偏见。在美国城市中,这种空间差异通常反映出在城市发展历史中由政策、规划和设计偏见形成的景观公平问题。先前对美国城市的研究表明,空气污染、土地使用、林木覆盖与弱势社群(包括移民、少数族裔和低收入社区)的长期健康之间存在潜在联系[11-12]。
城市林业对人居健康的影响,以及其在时间、空间和类型方面的分布特征带来了更多复杂的问题和争议。传统观点认为行道树是宝贵的公共设施,可通过净化空气对环境产生积极的影响,同时也能促进更多的步行活动和运动锻炼,以鼓励积极的生活方式。然而,近年来也有一些研究质疑城市林业对当地环境的影响是否为绝对积极的,并考查行道树作为花粉重要来源对城市生态环境和公民健康的影响。例如,2013年的一项研究在花粉高峰季节对纽约市45个地点的行道树花粉散播情况进行了监测,结果表明,树冠覆盖区域的500m半径辐射范围内可接触到的花粉量为当地总量的39%[13]。而在纽约市进行的另一项研究还证明,青年人群接触树木花粉(半径为250 m)与过敏的风险在统计学上存在显著相关性[14]。不止在纽约,其他研究在北美多个城市进行了专项调查,发现某些树种可能会加剧人对花粉的过敏反应,从而增加哮喘的发病风险[15-16]。以上的争议的解决需进行更全面的数据采集和分析研究,从而进一步揭示城市中人、生态和建成环境之间的复杂关系。
1.2 城市信息学
遥感技术、物联网、计算机视觉、大数据和机器学习等技术的发展创造了新的数据源,并为城市科学研究开拓了新的方向。在讨论智慧城市时,Ratti总结了城市系统中信息流的3个关键组成部分:感知、分析和执行[17]。感知是指通过传感器、虚拟参与或人机交互中获取实时数据的能力和过程[18]。分析是指通过数据分析、建模、模拟和可视化等手段来解决城市问题,通常强调应用程序和决策制定。与“商务分析”利用数据进行投资优化和业务运营相似,城市分析利用数据来论证与城市治理、规划、设计、开发和管理相关的政策、决定和运营模式。执行是指利用安装有传感器的组件(例如自动电源开关)来执行的自动化控制或信息反馈行为。在智慧城市中,这套智能系统通常被称为“传感器和执行器网络”。
通常,城市林业数据的生成基于高清卫星图像或遥感影像,通过高光谱和激光雷达技术定位树冠的位置。例如,有学者结合高光谱影像数据和高分辨率LiDAR数据来绘制美国加利福尼亚州圣塔芭芭拉市的树木分布图[19]。另一类研究方法基于街景图像数据,使用计算机视觉和算法识别来实现更加复杂的图像检测分类技术。例如,Seiferling等使用计算机视觉算法来量化街道图像(Google街景视图)中的绿色像素,以估算街道树木覆盖程度[20]。这种新方法以人的视角模拟了行人在城市环境中对树木的视觉感知。与此同时,最近的研究也显示了这种技术的应用前景以及局限性。例如,一项研究探索了在美国加利福尼亚州的5个城市中利用街景图像和深度学习进行街道树木自动检测的可行性[21]。尽管初步的结果表明自动识别记录树木地理位置的准确率较低(38%),但是此项探索性研究测试了一种新的城市信息收集方式,即通过图像识别(例如卫星图像或街景图像)来自动更新现有的城市树木数据库。
城市信息学是一个新兴的跨学科研究领域,旨在结合城市系统中的人文因素、环境因素和技术因素从而创造新的城市问题解决方案[22]。城市信息学也激发了城市景观和绿色基础设施相关的前沿探索研究。从技术的角度出发,城市信息学关注于数据的收集、挖掘、集成、分析和应用过程,并通过定量统计和数据科学来研究城市现象[23]。“开放数据”是指可公开使用和发布,且不涉及隐私、机密或安全性问题的数据集[24]。例如,纽约市于 2012年通过了《第11号地方法》(NYC Local Law 11,通常称为《开放数据法》),要求市政府机构通过称为“纽约市开放数据”的通用数字门户网站提供可公开的城市数据[25]。通常,一个城市中的不同机构都会收集、管理和发布有关城市基础设施系统和公共资产(包括土地使用、建筑物、街道网络、行道树和交通设施)的清单列表。尽管城市开放数据的最终目的是为了提升政务信息的透明度,促进数字创业和公众参与,目前大多数此类信息资源仍是自上而下由市政府机构发布的。这些可供下载的城市数据大多与公共服务、政策管理和业务运营等方面相关。与此同时,为了推动政府开放场景,实现市民在智慧城市项目中的参与程度,并充分发挥城市开放数据的潜在价值,自下而上的社区项目和公众参与对于支持、补充并最终主导一些数据收集决策至关重要。
1.3 公众科学
除了遥感和计算机视觉技术外,基于众包过程的城市数据收集也开始流行起来。尽管对于应用传感技术和人工智能进行城市数据挖掘已经开展了广泛探索,但此类数据收集方式的可行性和可靠性仍需要更加深入地论证。由于机器自动采集的数据准确率较低,而实际的城市树木的信息系统和数据管理工作又会同时涉及人工参与和机器自动化学习,仅靠机器进行采集既不可行也不可取,所以公众在城市景观数字化、智能化的过程中扮演着不可或缺的角色。一项研究通过对美国和瑞典的多个城市的行道树数据收集过程进行记录分析并得出结论:经过6 h培训的志愿者,可以相当准确地报告树木的属和种,准确率分别达到90.7%和84.6%[26]。这项研究还发现在所选择的城市中,所有常见树种中的槭树属、七叶树属、山楂属、皂荚属、悬铃木属和椴树属的报告的准确性较高。因此,当地居民的参与作为人工数据收集的一部分,有助于进一步检验现有数据库的准确性。
除了提供技术支持外,此类参与过程还可以作为公共教育的一部分,以提升社区意识,并产生积极的社会效益。在公众科学应用的进程中,当地居民能够参与科学研究或试点项目以促进科学知识普及,并向研究人员提供本地经验和反馈。此过程加强了市政单位、研究机构、利益相关者和社区成员之间的协同关系[27]。在行道树数据收集过程中,公众科学还可以让群众参与城市绿色基础设施建设和社区韧性建设,培养社区意识。不过先前美国城市林业公众科学项目相关的记录表明,参与人群大多是受教育程度和收入水平相对较高的中产阶级[28]。参与群体的不均衡性可能会引发规划决策的公平性争议,尤其是与开发用地规则、房屋所有权政策和设计决策相关的社区发展与贫富差异问题。因此,基于环境公平的考量,城市规划部门鼓励更多的少数族群或弱势群体积极参与当地的公众科学项目,从而使社区规划和设计决策过程更加平等公正[29]。
2 案例研究:纽约市的城市树木数据
纽约市是美国人口最多的城市,也是全球最大的城市之一。纽约市包括曼哈顿区、布鲁克林区、皇后区、布朗克斯区和斯塔滕岛区5个行政区,总人口超过830万人。得益于其高密度的建成环境、街道网络和公共交通设施,纽约市被评为北美最适宜步行的城市之一。在促进可持续发展与健康公平的城市生活方面,纽约市是城市规划和设计实践创新的先驱。自20世纪70年代以来,纽约市开展了许多始于草根基层或由社区主导的植树运动,旨在促进少数族裔和边缘人群享有更加公平的城市资源和更好的生活质量[30]。2007年,纽约市公园与游憩局推出了“植树百万在纽约”(Million Trees NYC)城市计划。这是一项在全市范围内开展的长期行动,计划在5个行政区增种100万棵树木。在社区组织、当地合作伙伴以及大约50 000名公民和志愿者的支持下,这一计划最终在2015年顺利完成[31]。“植树百万在纽约”计划的成功使其成为城市林业和景观都市主义的实践案例。与此同时,纽约市还是城市开放数据以及城市科学(urban science)的先驱。2012年,该市颁布了一项城市公共数据开放法案,以提高市政信息的透明度、问责制和可获得性。随后纽约市启动了一个城市开放数据门户“OpenNYC”,市民可以在该平台查找、浏览和下载城市公共数据集。截至2019年底,该平台已发布并管理多达2 167个数据集,包含建筑、交通、公共基础设施、环境、社区和住房、人口、社会经济活动等与城市相关的信息资源[32]。
纽约市于1995年发起了第一次树木普查(“NYC TreesCount!”)。与人口普查类似,纽约市每10年通过调查来更新全市范围的树木信息。在2015年进行的第3次树木普查中,纽约市公园与游憩局首次利用了手机应用程序“TreeKIT”,并邀请公众参与树木普查,包括在线教学、专业人员的现场培训以及树木实地调查等多个模块。此次普查还为每位志愿者(被纽约市称为“公众科学家”)提供了一个工具包,其中包含用于测量树木位置和标准周长的测量轮和卷尺,以及用于报告树木信息的树种识别图册等工具[33]。该活动自启动以来,历经一年的时间完成了树木数据的收集、清理和验证。最初的原始数据收集包括了666 134棵行道树,其中的225 595棵是由 2 000多名居民参与,通过对当地社区树木进行地图标注和数字化记录[33]所收集的(图1)。
纽约树木普查活动最终于2016年在当地数千名居民的参与下完成。最终692 892棵行道树被绘制在地图上,并在确认其所属的 233个树种后被纳入正式的城市树木普查数据库[34]。通过对树木普查得到的数据质量进行比对检查,研究人员发现与受过专业培训的树木学家相比,以公民为主导的数据收集准确率达到了大约97%[35]。纽约市将最终的树木普查数据通过网站“纽约行道树地图”(NYC street tree map)进行发布,并利用交互式数据可视化工具将全市5个行政区的行道树统计结果进行共享[36](图2)。网站访问者可以选择特定的区域来进一步获取更详细的行道树信息,例如地理位置、种类和大小(按树干直径)。搜索窗口允许用户查询特定街道地址周围的行道树情况。网站访问者还可以注册成为用户,并对一些特定区域的树木进行监测(例如用户住宅附近的树木)。据统计,截至2017年5月,纽约市行道树地图已经为10 000多项活动提供了数据支持,包括涉及特定的树木维护、树木普查数据更新以及其他城市环境生态监测项目[33]。
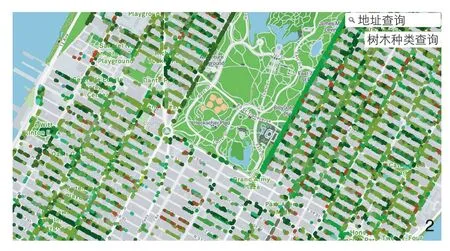
2 纽约行道树地图网站NYC street tree map website
为了进一步宣传和推广树木普查数据,纽约市公园与游憩局于2016年6月举办了城市树木数据大赛“TreesCount! Data Jam”。该活动的赞助商和合作伙伴包括了众多私有企业、公共机构、教育研究机构以及倡导城市科技和公民数字化参与的非营利性组织,例如纽约市市长技术创新办公室、NYC OpenData、微软、地图公司CartoDB(现更名为CARTO)、Civic Hall和BetaNYC。活动关注以下5个研究任务:1)统计1995年、2005—2015年的城市林业的变化;2)利用纽约市行道树普查数据可视化开展城市环境意识的公共教育;3)调查行道树与其他环境或社会经济因素之间的潜在联系;4)开发树木数据在城市可持续发展和绿色基础设施管理方面的创新应用;5)探索如何将社区管理和公众参与更好地与城市林业实践相结合[37]。
纽约市2015年的树木普查项目历时超过一年,如果加上前期准备工作和后期的推广活动时间,整个计划甚至需要更长的时间。正如本文文献综述部分提到的那样,新的信息技术和人工智能可以从街景图像中快速收集城市数据,这种创新方法也被应用到纽约市行道树数据自动收集的测试之中。例如,一个研究小组利用谷歌街景(Google Street View, GSV)收集的336 998张纽约街景图像开发了一种树木检测算法[20]。该团队使用多步图像分割和分类算法,根据街景图像像素对各种街道对象进行了识别。根据对树冠数据的验证,该方法在街区或社区等尺度下相对准确(R2≈0.7),而其中产生的系统性误差是由于从图像提取的数据质量问题引起的,例如重叠的树木和建筑物、树木阴影以及曝光不足或曝光过度等问题。除了技术上的不确定性外,缺乏人为参与也限制了城市数据收集过程中所产生的额外社会效益。尽管存在上述种种缺陷,这种新颖的行道树检测方法是对传统树木普查的补充,为快速广泛地收集城市林业数据提供了独特的参考价值。
行道树数据为日常的城市绿色基础设施管理创造了长期价值,并为与城市规划、景观设计、生态环境可持续性以及公共卫生有关的研究提供了新的数据来源。尽管先前研究已经针对城市树木的生态、环境和美学效益开展了广泛的调查,但树木的种植位置及其种类如何影响人类健康仍需更深入的研究。来源等[38]最近进行的一项研究调查了行道树密度和树种对呼吸系统健康的潜在影响,尤其是哮喘住院率与接触性树木花粉过敏之间的关系。该研究广泛整合了城市开放数据,用以量化局部地区空气质量(以PM2.5密度衡量)、呼吸道疾病患病率(以邮政编码区的哮喘就医率衡量)、土地利用、住房条件、邻里人口统计学特征,以及按树种分类的当地林木密度和花粉过敏原严重程度。地理加权回归模型的结果显示:在复杂的环境、建筑(室内居住条件)和社会经济因素的驱动下,呼吸健康存在显著的空间分布差异。回归模型还表明:具有严重致敏花粉的树木密度可能会增加局部地区尤其是弱势社群中的哮喘住院率。
传统研究主要关注城市林业作为城市绿色基础设施的一部分对生态的贡献,而新的数据则能够进一步探索人居活动与城市树木间的互动关系及其所呈现出的时空差异。例如,纽约市设有城市热线311(NYC311)用于响应非紧急服务请求和市民投诉[39]。在2019年,该市共计约有4 400万次市民热线呼叫,包括了与邻里环境、公共安全、噪音扰民和其他生活质量状况有关的投诉或反映市政的服务需求[40]。其中多项市政服务与行道树相关,例如报告受损或死亡树木、要求修剪树木或请求在特定位置种植新树等。这样的服务为居民参与当地社区环境建设提供了平台,而在此过程中产生的数据可作为公众对城市林业关注度的数字跟踪。例如,笔者从2010—2020年,市民报告的超过2 200万次 (n=22 131 777)的服务请求中提取了所有本地社区希望种植新树木的请求。图3是纽约4个主要行政区(曼哈顿区、布鲁克林区、布朗克斯区和皇后区)按月汇总的市政服务需求与种植新树木数量,按时间序列展开的数据可视化图。市民服务热线呼叫作为一种集体社会行为,反映了公民参与城市林业活动的季节性规律(图3)。服务请求在不同地区显示出类似的时间模式,尤其是在布鲁克林区和布朗克斯区。每年,该市在 5月左右收到的种植树木相关的服务请求最多,而在2月收到的请求最少。这可能是因为居民在5月进行户外休闲或园艺活动的时间最长,从而对城市林业相关的工作关注度最高。由于物资运输和工作准备,纽约市园林部门将2个种植季节定为3—5月和10—12月[41],因此在旺季期间种植新树木的市民服务请求通常可能需要等待半年才能得到解决。
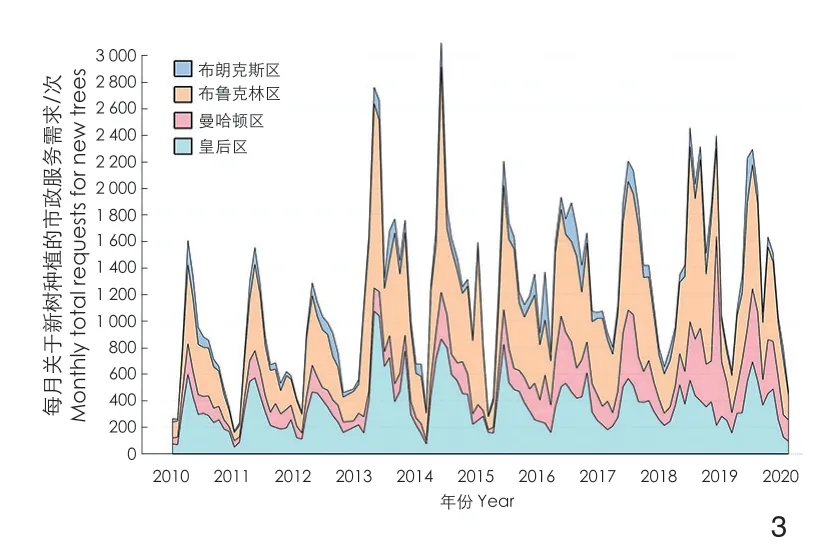
3 与纽约街头树木有关的市民投诉和服务请求的季节性变化模式Seasonal patterns of citizen complaints and service requests related to street trees in NYC
行道树普查与其他城市开放数据的收集整合提供了一种以高空间分辨率深入了解社区的物质、环境和社会方面的新视角。例如,图4-1展示的是南布朗克斯的一个低收入社区——莫特黑文街区,2015年,纽约市卫生局在全市59个社区进行了人口健康调查,并发布了《纽约市社区健康概况》。该报告指出,莫特黑文是纽约市哮喘住院率最高的街区(儿童住院率最高,成年人住院率为第3高)[42]。之前对该社区的调查发现居民有超过66%的概率得哮喘住院,该社区健康问题或与邻近土地的污染有关[43]。尽管邻近的工业用地和土壤污染是影响当地环境空气质量的关键原因,笔者的研究揭示了另一个可能的潜在原因——花粉过敏原暴露风险。通过对城市数据挖掘和整合,笔者基于不同树种花粉的致敏程度(即引起花粉过敏的严重程度),在单棵树木尺度上根据树种绘制了城市行道树花粉致敏程度地图。结果显示,由于莫特黑文社区的大多数行道树为高致敏性(红色),该街区是纽约市的花粉过敏多发地之一(图4-2),笔者同时也根据NYC311收到的居民对于清理枯树(图4-3)或修剪树木(图4-4)的服务请求将数据进行了可视化分析。
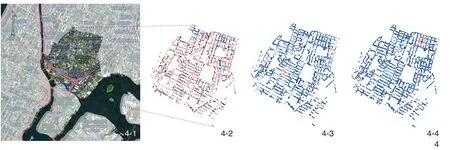
4-1 纽约市布朗克斯区莫特黑文街区的行道树 Street trees in Mott Haven, a neighborhood in Bronx, NYC4-2 莫特黑文街区的行道树花粉致敏程度地图Street trees allergenic map in Mott Haven4-3 居民对于清理枯树的服务请求可视化分析图Visualization of residents reporting dead trees according to NYC 311 service requests data4-4 居民对于修剪树木的服务请求可视化分析图Visualization of residents reporting overgrown trees (for pruning) according to NYC 311 service requests data
3 讨论
行道树的数据表明,城市作为一个复杂的社会—技术—生态系统,其自然生态、建筑环境、技术和社会经济各方面都存在动态变化。本文文献综述部分通过总结比较不同方法的优缺点,阐释了单纯由人工主导的众包(crowdsourcing)或者完全依靠人工智能进行数据收集都无法实现城市树木数据收集管理的全部目的。例如,使用高分辨率的航空图像数据或遥感数据在大尺度上统计树木很容易实现,但是要根据特定的地理位置从人体尺度来对树木进行精准定位则准确性较低。相比之下,以人为主导进行树木普查得到的数据空间分辨率较高,但由于这种方式属于重复劳动和时间密集型工作,人工与时间成本高,且仅依靠公众参与难以保证数据质量。
考虑到上述不同技术各自的利弊,笔者认为应当将以人为主导和以机器为主导生成的城市树木数据进行融合。首先,可以使用自动航空影像数据或LiDAR数据对树冠基准数据进行收集,以刻画城市树木集群的总体格局。其次,可以根据计算机从街景图像中提取的数据来修正基准数据,此过程可以进一步确定特定的树干位置,尤其在建筑物密度极高的城市地区。接着,通过类似于纽约市树木普查项目的众包流程进一步丰富带有地理标签的信息,并增加社区参与度。最后,可以发布基于网络或移动设备的具有可视化和其他应用程序的数据门户,用来协助城市职能部门的规划决策,也可利用该信息资源推广城市环境公共教育并带来其他社会福利。这种面向公众的数字工具可以让本地居民、社区团体和公共服务供应商通过更新和使用数据,使数据“实时”发挥关键作用。
笔者近期的另一项城市健康数据整合研究阐述了在数据项目中取得成功的基本原则和要素,包括清晰的技术方法、基于社会伦理争议的考量,机构间相互协调的沟通模式、跨学科的合作研究以及可持续的伙伴关系[44],这些原则同样适用于城市林业数据项目。纽约市行道树普查项目之所以取得成效,是因为其对城市数据基础设施进行了长期的投资,通过有意义的市民参与使其与当地社区进行互动,并在数据发布后推广使用和鼓励后续研究。图5展示了一个高层框架,该框架将数据、计算、环境、公民和城市管理一体化,成为一个互联互通的城市信息系统。该系统基于信息反馈回路机制,将数据收集、分析、产品、用户反馈联系起来,从而帮助规划、设计和与政策相关的决策论证与实际执行。这种互联互通的内部连接实现了3个关键的城市信息反馈循环,即城市系统中的物质属性、社会属性以及科技属性间的联通。传统的城市设计、建筑和风景园林学科广泛研究了城市形态、街道景观和公共空间的物理形态如何影响社会行为和公众健康。“物质—科技”联系代表了数字信息如何显示和实体空间的规划、设计和运营。这种连接类型主要是指用于决策支持系统、数据驱动操作和自动控制物理环境的智能城市技术。而“科技—社会”联系是指数据和技术与人和社区之间产生的动态交互,尤其是如何平衡、协调信息技术对于教育、安全、健康和其他社会方面的劳动密集型服务带来的积极效益和潜在风险。在用户层面,通过这样的人机交互实用工具或应用程序可以提供有效信息来支持人们的日常生活,并且建立新的信息反馈和数据联通机制。例如,由于哮喘患者的高分辨时空数据(具有患者定位和时间的哮喘病例)的缺失,目前在更微观尺度上对与健康相关的城市分析仍十分困难,而未来的研究将探索公众参与如何作为用户反馈数据被应用于公共健康领域。长久而言,持续的城市数据迭代更新以及信息应用产品将全面支持可持续城市管理和公众科学。
纽约市行道树普查的案例在美国并非个例。其他许多城市,包括旧金山、洛杉矶、西雅图、丹佛、波士顿和芝加哥,也开展了类似的行道树数据收集项目[45](表1)。尽管许多城市已开展行道树数据收集,但目前通常是由特定的城市机构独立进行数据收集工作,缺乏国家级别的统一的城市树木信息标准。因此,各个城市之间的数据无法直接进行整合和比较,未来城市树木数据的收集管理工作仍需要更加明确的采集方法和通用标准。数据集的数量取决于城市的规模以及基于地理和气候条件的城市树木覆盖范围。各个城市的树木数据由不同的部门机构收集和管理,其中包括公园与游憩局、交通运输局和公共事务局。而这些数据标准和格式上的差异不可避免地限制了更大范围的数据集成和跨城市信息交换[44]。这种跨城市的实践不仅包括数据收集,还包括针对公共利益而开发的应用技术。城市树木普查除了将数据进行可视化分析之外,也为不同城市测试这种新技术的可靠性创造了机会。新技术的使用必须要借鉴试点项目的成功经验,并通过在其他城市进行推广来进一步扩大应用范围。例如,自从纽约市树木普查获得成功以来,TreeKIT的开发团队开始在全球其他城市积极推广类似的技术和产品,包括美国波士顿、美国阿尔伯克基、古巴哈瓦那和中国深圳[35]。
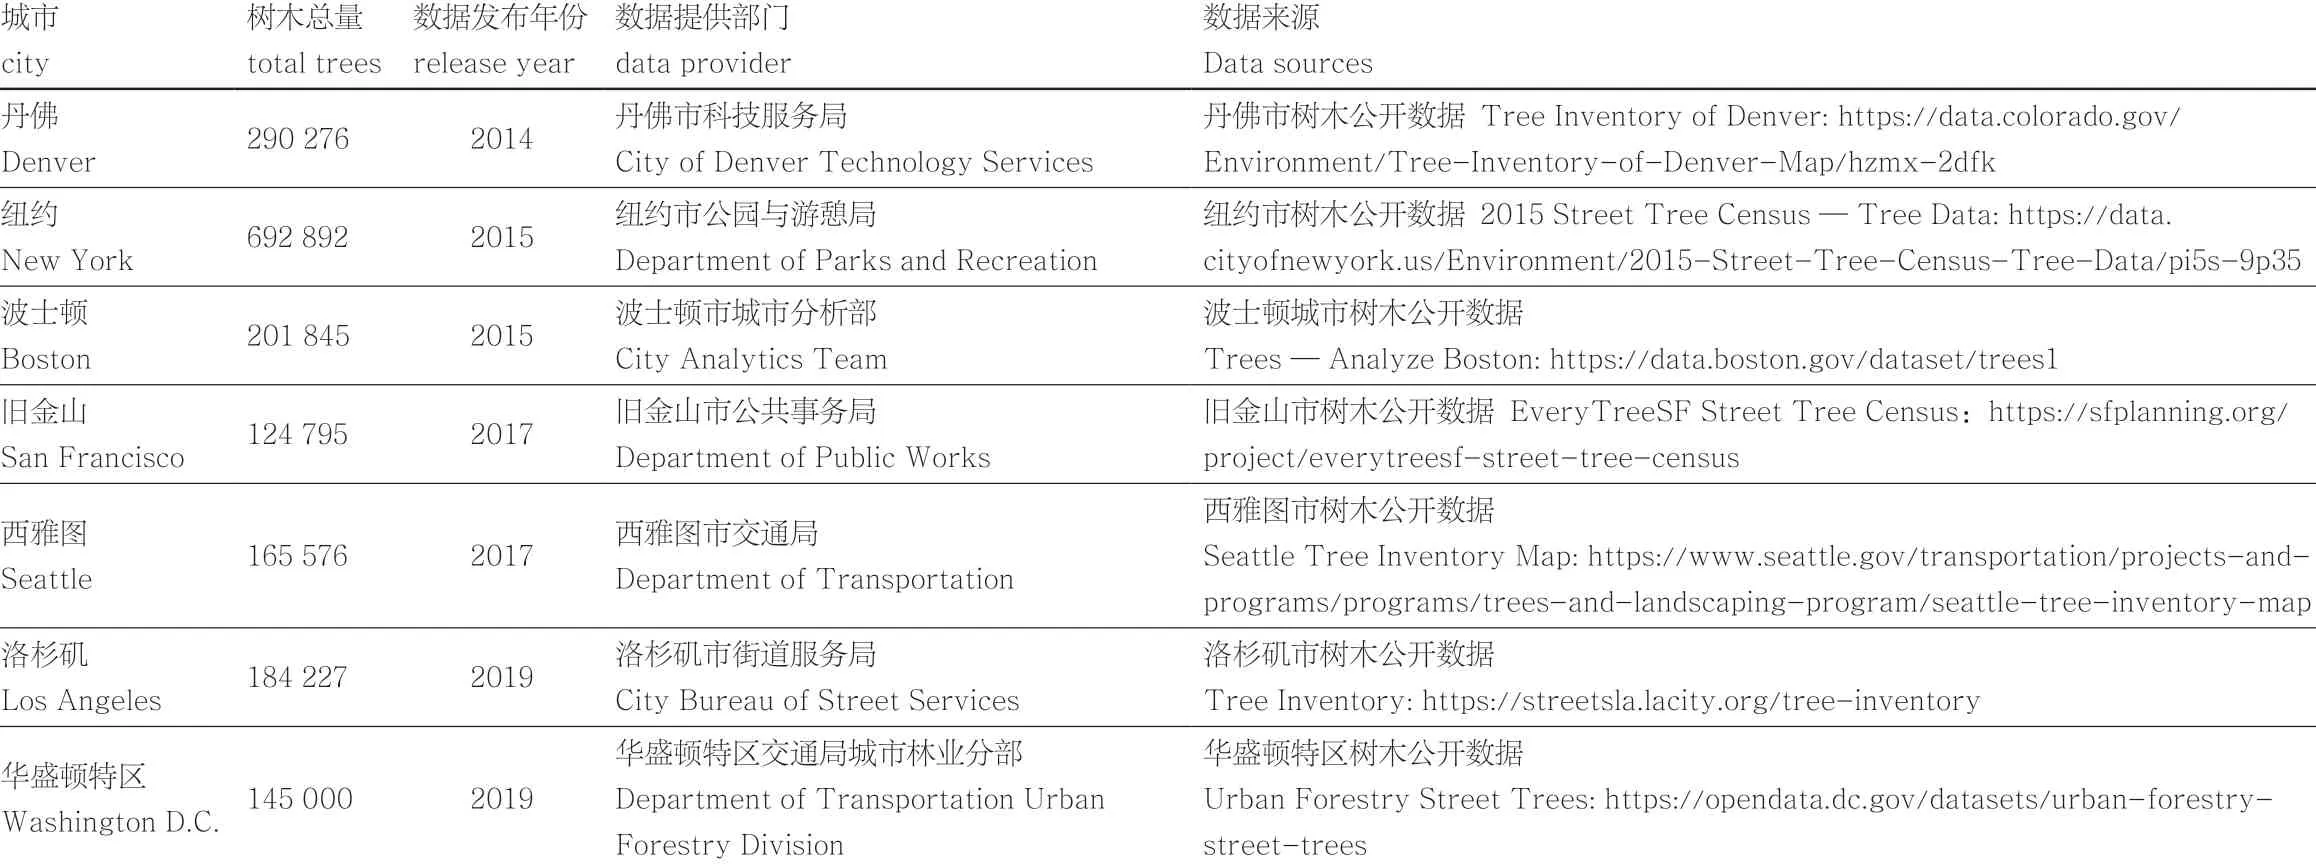
表 1美国部分城市树木数据Tab. 1 A summary of all urban tree data in U.S. cities
中国城市林业在缓解空气污染和热岛效应方面起着至关重要的作用。2015年,美国自然保护协会(The Nature Conservancy)与C40国际城市气候领导联盟(C40 Cities Climate Leadership Group)合作,对全球城市树木的环境效益、社会效益和经济效益进行了研究[46]。这项报告中有2项研究结果与中国城市高度关联。首先,一项对全球城市植树的投资回报率比较分析的结果表明,中国城市树木规划的投资回报率更高。其次,报告强调了以使用高空间分辨率的数据来确保在合适的地方植树造林从而让城市林业能够服务最需要的人群社区的重要性。尽管之前的研究通过ALOS(Advanced Land Observation Satellite)和SPOT-5(Satellite pour l’observation de la Terre)等地球观测卫星数据发现了中国9个主要城市的城市林业空间格局及其变化[47],但大多数城市尚未公开提供全市范围内带有地理坐标的树木数据。由于缺乏高空间分辨率的城市林业数据,城市范围的科学研究和应用分析受到了一定限制。而在选定的研究区域或特定社区内,城市树木对环境和生态的影响仍然有限。例如,最近一项研究通过在封闭的校园(以北京林业大学为例)内收集数据,检测了不同树种对空气中颗粒物的吸收效果[48]。另一项研究是在北京城区采用空间随机抽样方法,以行道树碳储量为研究重点,使用基于道路网络的分层随机抽样技术收集了12种、共计2 040棵行道树的数据[49]。尽管这些项目使用了合理有效的采样和分析方法,但由于目前城市尺度数据的缺乏,其研究范围有限,未来全市树木普查数据将为上述研究提供重要支持并使其研究模型得以在全市范围内得到验证。因此,全面而高质量的城市数据开放共享对于将特定地点的研究扩展到“城市科学”范围至关重要。例如,近期的另一项研究在中国245个城市中分析了超过100万张腾讯街景图像来验证大数据应用于城市林业的可行性,结果证明了街景图像分类是一种便捷可行的城市林业数据收集和分析方法[50]。与上文提到的纽约树木普查案例一样,使用街景图像的树木测算方法很有可能将与以市民为主导的树木数据收集活动相辅相成,在大规模城市数据收集的同时也充分发挥公众科学的社会效益。而公众参与城市数据收集过程所发挥的特殊作用也很好地回应了上文提出的结合数据、计算和公众科学一体化的城市林业信息整体框架(图5)。

5 结合数据、计算和公众科学一体化的城市林业信息整体框架A framework integrating data, computation, and citizen science for urban forestry
4 结论
城市景观随着自然、人与机器之间复杂的相互作用而动态发展。瑞士风景园林师、设计理论家乔治·德斯科姆斯(Georges Descombes)认为:“景观不存在完成或结束状态,景观是随着事件和故事的积累,不断发展的产物。”[51]数字化城市景观或是智慧城市项目亦是如此,其过程是长期而复杂的,涉及定量和定性的分析以及设计方面的论证工作。这样的过程不会也不应当完全依赖人工智能,亦不能拘泥于传统的人工收集方式。本研究对用于收集和分析城市林业数据的新技术进行了综述,并介绍了美国参与范围最广的城市林业项目之一——纽约市行道树普查项目的起因、经过和结果。与NYC311服务请求数据相结合的描述性数据分析则揭示了包括社区人口健康和城市运营在内的复杂环境和社会影响因素。
城市林业中社会—生态—技术多方面的动态变化需要综合运用信息科学、城市规划、城市管理和社区参与等跨学科的方法对城市系统进行研究。由于城市林业涉及范围的广阔性和复杂性,城市树木数据收集不应仅仅依靠人工调查或者完全由机器自动检测。众包数据收集和公众参与项目不仅具有社会效益和教育意义,而且能够提升公众的数字意识,尤其是对城市大数据的认知。这些长期的努力将不断促进城市中自然、科技和人文的有机联系,并为未来城市科学的全面发展做出贡献。
图表来源:
图1由作者使用QGIS创建,数据来源于2015年纽约市树木普查数据以及纽约市公园与游憩局提供的公园和开放空间数据;图2引自https://tree-map.nycgovparks.org;图3数据来源于https://data.cityofnewyork.us/Social-Services/311-Service-Requests-from-2010-to-Present/erm2-nwe9,由作者从NYC311提取和汇总数据后创建的数据可视化图像;图4由作者使用NYC Tree Census和NYC 311数据创建的数据可视化图像;图5由作者绘制;表1由作者整理绘制。
(编辑/王亚莺)
Urban Informatics for Green Infrastructure: An Integrated Approach for Street Trees Data Collection, Analytics, and Citizen Science in New York City
LAI Yuan
0 Introduction
The emergence of big data and the Internet of Things (IoT) create new research opportunities to investigate cities as dynamic systems through new observation, measurement, quantification, and analytics. Large volume, high granularity, and better-quality data collected in the urban environment enable us to look into cities’ spatialtemporal attributes at various scales. Novel data integration and analytics further unravel the complex interactions between urban landscape and human activity and the resultant long-term social-ecologicaleconomic impact. Advanced analytics and artificial intelligence have been widely implemented in various sub-systems of urban infrastructure. Previous studies have widely investigated spatial-temporal dynamics transportation, energy utility, retail, human mobility, and other socio-economic activities in the urban environment.
In contrast, the spatial — temporal characteristics of urban trees are still mostly unexplored. Data mining, integration, and analysis on urban green infrastructure, especially trees, are relevant new or not available in most cities. Street trees are critical components of urban landscape systems with ecological, environmental, and aesthetic benefits. However, a lack of urban tree data constrains accurate assessment and datadriven investigation of urban forestry’s current status. In particular, what factors (e.g., geography, urban form, urban design, and local socioeconomic conditions) drive urban trees’ location, and how do such spatial patterns further shape the local environmental condition, population health, sense of place, and quality of life at neighborhood scale? Digitization and analytics of urban landscape contributes to a broader vision of “quantifying place” for gaining a high-dimensional understanding of places at high spatial resolution by integrating heterogeneous data sources[1]. Such quantification can further support hyper-local intelligence for pervasive computing applications, which enables locational and situational awareness through data analytics and machine learning[2].
This article provides an overview of current research and practice related digitalization of urban trees. The introduction first describes the background context of trees as a vital part of urban green infrastructure, regarding their ecological, economic, social benefits, and how new data sources and novel analytical methods can extend our understandings in urban forestry. The literature review section summarizes critical aspects that are highly relevant to street tree data research,including previous findings on how street trees contribute to ecological resilience, environmental health, urban design quality, and social coherence with a sense of community. The author overviews urban informatics extends technical capacity and information resources for quantitative research for landscape design and data-driven operation to support urban management. Citizen science as a participatory data collection approach enriches the digitization process of urban forestry with additional social and educational benefits. A case study follows, focusing on NYC Tree Census Program in New York City. This case study provides detailed explanations on the motivation, plan, conduction process, and research and applications that utilize this dataset. The discussion summarizes the experience learned and critical insights from NYC’s case and relevant controversies and ongoing investigations. With considerations regarding cities’ ecological-social-technical complexities, the author proposes a framework for urban forestry data integration, collaboration, and civic participation. This framework concludes how new data and technology extend the understanding of the spatial-temporal dynamics of urban forestry.
1 Literature Review
1.1 Urban Forestry as Green Infrastructure
Street trees are a vital part of urban green infrastructure contributing to local microclimate, environment health, a sense of place, and qualityof-life necessitates. Ecologically, urban trees provide long-term environmental benefits, including greenhouse gas emission reduction, cooling effect, and air purification to promote physical and mental health[3-4]. Previous research proves the importance of planting and managing street trees as a vital part of urban green infrastructure[5]. It is estimated that in NYC the ecological impact of urban forestry includes stormwater mitigation (3 billion and 4 hundred million liter per year in total) and air purification (2,200tons of pollutants reduction per year in total), representing an estimated $122 million (7.97 RMB) economic benefits[6-7]. From an urban design aspect, trees are significant streetscape components that create visual order and physical buffer between motorists and pedestrian, contributing to the quality of public space at the human scale[8].
Street trees are urban landscape designed by planners and landscape architects. The spatial pattern of urban forestry is not only shaped by geographical and climate factors, but determined by urban form, planning policy, and design decisions as well. With more granular data available, increasing studies start to quantify and compare urban tree patterns and ecological and environmental impact. Previous research collected data from 58 U.S. cities to investigate underlying drivers of urban tree coverage across different regions. Results indicate that within a particular city, local-scale spatial variation of tree coverage mainly depends on land use characteristics[9]. One direct outcome of such spatial variation is the different microclimate conditions, especially the temperature differences at the hyper-local scale. For example, one study measured multiple U.S. cities’ temperature at high spatial-temporal resolution and local trees. The results show that different parts of a city may experience different temperature as large as nearly 12 Celsius Degree, depending on land use and tree canopy coverage[10]. Unfortunately, in most cases, such patterns are neither random nor accidental but derived by previous urban planning decisions and landscape architecture design interventions. The spatial disparity of trees raises questions on planning decisions and deeper issues such as environmental justice and underlying urban design biases. In the U.S. cities, such spatial variation often reflects environmental justice issues shaped by policy, planning, and design biases through urban development history. Recent research reveals the underlying connections between ambient air pollution exposure, land use, street trees coverage, and long-term health differences among vulnerable population including immigrants, ethnic minorities, and low-income communities[11-12].
The spatial, temporal, and typological variation of urban forestry’s impact even brings more complexities and controversies. Traditionally, street trees are considered valuable public amenities that create positive environmental effects and impact local population health by cleaning the air and promoting an active lifestyle with more walking and physical exercises. However, some studies question whether urban forestry always brings positive impacts to the local environment, considering street trees as significant sources of pollen in cities. In NYC, a previous study monitored tree pollen at 45 sites during the pollen season in 2013. Results indicate that tree canopy cover with 500meters radial zone explained 39% local pollen exposure variation[13]. Separate research in NYC also prove a statistically significant relationship between local tree pollen exposure (0.25 km radius) and risk of developing allergic sensitization in the youth population[14]. Not just in NYC, different groups of researchers conducted separate investigations in multiple cities in North America, and find out certain tree species may exacerbate allergic reactions to pollen with increased risk of asthma[15-16]. All the above-unsolved questions and controversies require better data and more robust analytics to unpack the complicated relationship between people, ecology, and built environment in cities.
1.2 Urban Informatics
Recent technological development in remote sensing, the Internet of Things (IoT), computer vision, big data, and machine learning has created novel data sources and untapped new research opportunities for cities’ scientific research. In a discussion of smart cities, Ratti summarized three critical components of the information flows in urban systems: instrumentation, analytics, and actuators[17]. Instrumentation refers to the capacity (as well as the process) of acquiring new-real-time and real-world data from physical sensors, virtual participations, or human-computer interactions[18]. In cities, analytics refers to the (big) data analysis, modeling, simulation, and visualization for urban problem-solving, often emphasizing application and decision-making. Equivalent to the popular term “business analytics” that focuses on leveraging data for investment optimizations and business operations, urban analytics utilizes data for policy, decisions, and operation relevant to urban governance, planning, design, development, and management. Actuators refer to the physical or digital components (e.g., an automated power switch) in charge of execution according to the instrumented sensors. Such intelligence systems often refer as the “sensor and actuator networks” in smart cities.
Conventionally, the generation of urban forestry data relies on satellite imagery data or remote sensing, such as mapping street trees location via hyperspectral and lidar technology. For example, a previous study utilized combined top-view hyperspectral imagery data and highresolution LiDAR data to map trees’ location and species in Santa Barbara, California, U.S.[19]. Increasing data from or street-level imagery data enable more sophisticated image detection/classification techniques using computer vision. For example, Seiferling et al. used a computer vision algorithm to quantify how “green” in street-level images (Google Street Views) as a proxy of tree cover in cities[20]. These new methods mimic the identification of trees in the urban environment from a human perspective. Recent research proves promising application of such technology as well as current constraints. For example, one study explored possible automated detection utilizing deep learning in five cities of California, USA[21]. Although the preliminary results indicate a low accuracy rate (38%) to correctly identify the documented trees’ geo-location, this exploration tested an algorithm to process alternative data (e.g., satellite images or street views) to update the existing urban trees database automatically.
Urban informatics is an emerging transdisciplinary field that investigates and implements innovative solutions at the intersections of people, places, and technology[22]. New technology also inspired new research investigations relevant to the urban landscape and green infrastructure. From a technical aspect, urban informatics investigates urban phenomena through quantitative and computational approaches involving data collection, mining, integration, analytics, and applications[23]. “Open Data” refer datasets that are publicly available for use and distribution without restrictions regarding privacy, confidentiality, or security concerns[24]. In 2012, NYC passed Local Law 11 of 2012 (often known as the “Open Data Law”) that requires city agencies to make administrative data publicly available through a common digital portal known as NYC Open Data[25]. Each agency collects, manages, and publishes a digital inventory of the physical component of urban infrastructure systems and public assets, including land use, buildings, street network, street trees, and transit facilities. While city open data intend to promote more transparent governance, digital entrepreneurship, and civic engagement, it has been mostly topdown, led by the city agencies publishing publicaccessible records involving public services, policy administration, and business operation. To fulfill the purpose of city open data, bottom-up efforts from citizen science projects are critical for supporting, complementing, and eventually leading some data collection decisions.
1.3 Citizen Science
In addition to remote sensing or computer vision technology, data collection based on a crowdsourcing process starts to gain popularity in cities. While urban data mining through sensing technology and artificial intelligence are widely explored, it is crucial to consider the feasibility and reliability during data collection. Mostly, information systems and data management streams for urban trees involve both human engagement and automation utilizing machine learning. Several reasons make human participation necessary in the urban landscape digitization process. Considering the limitations above, solely relying on automated data collection is neither feasible nor desirable due to its low accuracy. One study reviews the street tree data collection in multiple cities in U.S. and Sweden and concludes that with a 6-hour training session, volunteer participates were able to report tree genera and species quite accurately, with an accuracy rate of 90.7% and 84.6%[26]. This study also finds that Acer, Aesculus, Crataegus, Gleditsia, Platanus, and Tilia report the highest reporting accuracy among all common tree genera in selected cities. Thus, local residents’ involvement as a part of human input contributes to further inspecting, validating existing databases.
Besides a purely technical perspective, such engagement processes could serve as a part of public education to build a sense of community with social benefits. Citizen science is a process that general public and residents participate in scientific research or pilot projects for advancing scientific knowledge, providing local experience and feedback to the researchers, as well as constructing robust synergy between the city agency, research institutions, stakeholders, and community members[27]. Potentially, citizen science projects in street trees can cultivate a sense of community and citizen empowerment involving urban green infrastructure and community resilience. However, the historical records on urban forestry projects indicate the participates are predominately middle-class population with relatively higher education attainment and income[28]. Such imbalanced involvement raises equity issues, especially considering the historical spatial injustice embedded in previous zoning regulations, homeownership policy, and planning decisions. For environmental justice, cities need to proactively engage underrepresented or disadvantaged communities for more meaningful participation in planning and design decision-making process in their neighborhoods[29].
2 Case Study: Urban Trees Data in New York City
New York City (NYC) is the most populous city in the U.S. and one of the largest global cities. The City includes five boroughs, including Manhattan, Brooklyn, Queens, the Bronx, and State Island, with over a total of 8.3 million people. Thanks to its built density, street grids, and public transit network, NYC is often ranked as one of the most walkable North American cities. The City has been pioneering in urban planning and design practices to promote more sustainable, healthy, and equitable urban living. The City has a legacy of urban forestry, especially the grassroot, communityled tree planting movement for more equitable and better quality-of-life in minority and marginalized neighborhood since 1970s[30]. In 2007, the NYC Department of Parks and Recreation launched MillionTressNYC, a citywide long-term program aiming to plant 1 million trees in five boroughs. With supports from the community-based organizations, local partners, and approximate 50,000citizens and volunteers, the City achieved this goal in 2015[31]. The triumphant story of MillionTressNYC becomes one of the best practices in urban forestry and landscape urbanism. Meanwhile, NYC is also a pioneer in collecting and utilizing open data for applied urban science and analytics. In 2012, the city signed a local law 11 (often referred to as “open data law”) to increase the transparency, accountability, and accessibility of city-data. The city has launched OpenNYC, an urban open data portal for citizens to view, explore, and download public city datasets through this website. By the end of 2019, OpenNYC has published and managed 2,167 datasets that related to the buildings, transportation, utility infrastructure, environment, neighborhood and housing, population, and socio-economic activities[32].
NYC launched its first tree census in 1995. Similar to the population census, the City conducts a survey and update its tree inventory decennially. During the third tree census conducted in 2015, the NYC Department of Parks and Recreation implemented a mobile crowdsourcing application for tree census for the first-time (“TreeKIT”). Typical participation includes an online tutorial, an on-site training tour with a professional staff, and an on-site tree survey process. The program also provides each volunteer (named as “citizen scientist” by the City) a toolkit with various tools, including a measuring wheel and a tape measure for measuring the location and standard circumference of the trees, and a tree identification guide for reporting the tree species[33]. Since its first launch, the program took one year for the City to collect, clean, organize and validate the data collected from the tree counting program. The initial data collection identified 666,134 street trees, including 225,595 trees mapped and digitized by more than 2000residents through this participatory process[33]. Fig. 1 visualized all documented trees within the 2015 NYC Tree Census, with different colors by species and parkland area in grey.
By 2016, the NYC TreesCount! project completed along with thousands of local citizens’ contributions. The final Tree Census mapped 692,892 street trees and digitized them into the census database with 233 species identified[34]. A data inspection of tree census data quality concludes that citizen-led data collection has approximate 97% accuracy comparing to a professionallytrained arborists[35]. The City shares the final tree census data by publishing a website (“NYC Street Tree Map”) with interactive data visualization and citywide statistical summary of street trees across five boroughs[36](Fig. 2). A website visitor can select specific districts to zoom in for more detailed street tree information such as geolocation, species, and size (by trunk diameter). The search window allows a user to learn about street trees around the specific street address. Besides, website visitors can register as regular users to monitor specific trees, mostly near their home location. It estimates that by May 2017, the NYC Street Tree Map has supported more than 10,000activities involving specific tree maintenance, census data update, and other urban ecological monitoring programs[33].
In June 2016, the NYC Department of Parks and Recreation further organization TreesCount! Data Jam in the same year to promote this data advocacy and outreach for private, public, nonprofit, and educational organizations for data partnerships. Sponsors of this event include NYC Mayor’s Office of Tech and Innovation, NYC OpenData, Microsoft, CartoDB (now rebranded as CARTO), Civic Hall, and BetaNYC, a non-profit organization advocating urban technology advocacy and civic digital participation in NYC. According to the organizer, this one-day event aims to tackle the following five questions, including: 1) urban forestry change through time between 1995, 2005, and 2015; 2) novel data visualization of NYC street tree census for public education; 3) investigate underlying relationships between street trees and other environmental or socioeconomic factors; 4) create potential applications of tree data for urban sustainability and green infrastructure management; and 5) explore the better practice and use cases for community stewardship and public engagement with urban forestry[37].
The crowdsourcing process for the 2015 NYC Tree Census takes more than one year, and the entire program even takes much longer when taking into account preparation and post-release promotion events. As mentioned in the literature review, recent new data and artificial intelligence enable rapid urban data collection from street view images. Such innovative methods have also been tested in NYC for an automated street tree data collection. For example, a research team developed a tree detection algorithm utilizing 336,998 images collected from Google Street View (GSV) in NYC[20]. Using a multi-step image segmentation and classification method, the team classified various street objects based on street view image pixels. Validation with the tree canopy data proves a moderate accuracy (R2value ≈ 0.7) at the block or community district level. Systemic errors are due to some data quality issues derived from GSV images, including the overlapping trees and buildings, tree shadows, and underexposure or overexposure. Besides the technical uncertainties, a lack of human engagement constrains additional social benefit of community engagement throughout the process of urban data collection. Nonetheless, this novel street tree detection method is complementary to the tree census, providing unique value for rapid and scalable urban forestry data collection.
Street tree data create prolonged values for day-to-day urban green infrastructure management and provides a new data source for research related to urban planning, landscape architecture, ecology, and environmental sustainability, and public health. One recent study conducted by the author investigated the underlying spatial impact of street tree density and species to respiratory health, especially relationships between the prevalence of asthma hospitalization and allergic tree pollen exposure[38]. Although urban trees’ ecological, environmental, and aesthetic benefits have been widely investigated, how specific location and species of trees may have localized health effects is still less explored. Thus, this study first integrates a wide range of city open data to quantify localized air quality (measure by PM2.5density), respiratory disease prevalence (measured by ZIP code level asthma hospitalization rate), land use, housing conditions, neighborhood demographic characteristics, along with local street trees density and pollen allergen severity classified by tree species. The geographically weighted multivariate regression model’s results reveal a significant spatial disparity of respiratory health driven by complex environmental, built (indoor housing condition), and socioeconomic factors. The regression model also indicates that the concentration of tree species with severe allergenic pollen may increase local asthma prevalence, especially in vulnerable populations.
While conventional studies focus on urban forestry’s environmental and ecological contribution, a novel aspect of urban green infrastructure research explores human activities as societal behaviors interacting with street trees. Such citizen engagement with street trees demonstrates spatial and temporal patterns as well. NYC operates a city hotline, NYC311, for responding non-emergency service requests[39]. In 2019, the city reports approximate 44 million citizen interactions with NYC311 in one year, reporting complaints or requests that relate to neighborhood environment, public safety, noise, and other quality-of-life conditions[40]. Multiple service categories are associated with street trees, such as reporting damaged or dead trees, calling for pruning services, or requesting for new trees at a specific location. Such service data provide an additional digital trace of citizens’ engagement with the local community environment and public attention to NYC’s urban forestry. For example, the author extracted all local requests for new trees from more than 22 million (n=22,131,777) service requests reported in recent ten years (2010—2020). Fig. 3 is a time-series data visualization of monthlyaggregated service calls requesting news trees in four major boroughs, including Manhattan, Brooklyn, the Bronx, and Queens. The x-axis represents time by months, and the y-axis represents the monthly total number of requests. As this fig. shows, the temporal patterns service calls, as the digital representation of collective social behavior, reveals the seasonality of citizens’ engagement with urban forestry. Monthly patterns of service requests demonstrate similar temporal patterns in different boroughs, especially in Brooklyn and Bronx. Annually, the city receives most service requests around May and the least requests in February. One assumption is that residents spent the most time outdoor leisure activity or gardening during May, generating the greatest public attention on urban forestry maintenance ace and expansion. However, due to stuff logistics and work preparation, the department scheduled two planting seasons as March-May, and October-December[41]. This indicates that residents who have requested new trees during the peak season may wait for half-year to complete this service request.
Novel data integration among street tree census and other city open data provides additional insights into a neighborhood’s physical, environmental, and social aspects at high spatial resolution. Fig. 4-1 highlights Mott Haven, a low-income neighborhood in South Bronx. In 2015, the NYC Department of Health conducted a citywide population health survey among all 59 neighborhood districts and summarized the research report as NYC Community Health Profiles. The report identified that Mott Haven as the neighborhood with the highest asthma hospitalization rate (highest among children and the third-highest among adults)[42]. Previous investigations in this specific neighborhood find out residents face more than 66% likelihood in asthma hospitalization, possibly due to the approximation to noxious land use areas[43]. While the local ambient air quality close to industrial or toxic land uses is a critical issue, our study reveals another potential cause — pollen allergen exposure. Using data mining and integration, the author classifies pollen allergenicity (i.e., the severity of tree pollen causing raspatory reactions such as asthma) at individual tree level and map street trees based on allergenicity. As Fig. 4-2 shown, most street trees are classified as highly allergenic, making this neighborhood one of the pollen hotspots in NYC. Fig. 4-3~4-4 visualize residents reporting dead trees or overgrown trees (for pruning) according to NYC 311 service requests data.
3 Discussion
Urban street tree data demonstrate that cities as complex social-technical-ecological systems involve nature, built environment, technology, and socioeconomic dynamics. As the literature review summarized the strengths and weaknesses in different approaches, we consider that neither human-led crowdsourcing nor A.I. based data collection can serve the full purpose of urban tree data collection. For example, tree counting based on canopy detection using high-resolution aerial imagery data or remote-sensing data (e.g., LiDAR) can be easily implemented at a large regional scale. However, there is a lack of human-scale and low accuracy for pinpointing trees based on their specific geo-location. In contrast, human-led collection reports data at the high spatial resolution, but it is labor and timeintensive, lacking data quality control, especially when engaging the general public through a participatory crowdsourcing process.
We propose a fusion of human-led and machine-lead data generation of urban trees for cities regarding the aforementioned pros and cons related to a different technology. First, a baseline data collection on tree canopy can be conducted using automated aerial imagery data or LiDAR data. This initial data collection enables cities to capture the tree canopy and urban forestry clusters’ general pattern. Further, the baseline data can be improved with data collected from object detection with computer visions from street view images. This process can further identify specific tree trunk locations, especially in urban areas with extremely high building density. Then, geo-tagged information can be further enriched through a crowdsourcing process similar to the NYC Tree Census, with additional community engagement components. Finally, a web- or mobile-based data portal with visualization and other applications can be published for the public education and other social benefits. Such a residentsfacing digital tool plays a crucial role in making the data “live” with updates from local residents, community groups, and public service providers. A recent research on data integration for urban health, the author identified essential principles to succeed in a data project, including methodological clarity, social and ethical awareness, inter-agency coordination, transdisciplinary collaboration, and sustainable partnerships[44]. Such principles also apply to urban forestry data management. NYC Street Tree Census project is successful thanks to a long-term commitment to invest in urban data infrastructure, engage with the local community for meaningful participation, and promote extended use cases and research after releasing the data. Fig. 5 illustrates a high-level framework that integrates data, computation, environment, citizens, and city management as a connected, holistic system. Such a system connects the information feedback loop with data collection, analytics, civic product, user feedback as new input to inform planning, design, and policyrelated decisions.
The inner connections enable three critical information feedback loops as physical-social, cyber- and cyber-social connections in cities. Traditionally, urban design, architecture, and landscape architecture research have extensively investigated how physical configuration of urban form, streetscape, and public space shape collective social behavior and population wellness (i.e., physical-social connection). Some well-known research include studies conducted by William H. Whyte and Jan Gehl, who investigated the interplay between physical space and human behavior. Physical-cyber connections represent how digital information represents and augment physical planning, design, and operation in reality.
This type of connection primarily refers to smart city technology for decision-support systems, data-driven operation, and automated control physical environment. Cyber-social connections refer to the dynamic interactions among data and technology with people and communities. In particular, how to positively aid social benefits while minimizing underlying adverse effects when utilizing information technology and artificial intelligence for human-intensive services involving education, safety, health, and other social aspects. At a user level, practical tools or applications can provide useful information to support people’s daily lives and, hopefully, get feedback and new data input through such user-machine interactions. For example, currently, there is no high-resolution data on asthma patients (e.g., asthma cases with patients’ location and time), which creates barriers for further validating some health-related spatial analysis at a more granular scale. Thus, future research will explore how participatory sensing and public engagement can serve as part of ground-truth validation and user-based data input on population health. Ultimately, such iterative analytical cycles will support sustainable urban data management and holistic citizen science.
The story of the NYC Street Tree Census is not a single case in the U.S. As Tab. 1 shown, many other cities, including San Francisco, Los Angeles, Seattle, Denver, Boston, and Chicago, have conducted similar projects to collect street trees data[45]. While many cities started to invest data collection on street trees, these efforts are often siloed and solely determined by specific city agencies without a generalizable data standard specifying common variable and spatial resolution. The datasets’ volume varies depending on the size of the city and urban forestry coverage based on local geography and climate condition. Urban tree data are collected and managed by different departmental agencies in cities, ranging from the Department of Parks and Recreation, Department of Transportation to the Department of Public Works. Such differences in data standards and format inevitably create constraints for greater data integration efforts and cross-city information exchange protocols[44]. Such cross-cities practice does not just limit to data collection but also involves developing and deploying technology for civic purpose and the public good. Besides data visualization and analytics, the urban tree census provides unique opportunities for testing civic technology implementation in different cities. The novel technology deployment must continue the pilot project’s success and extend the scope by testing and deploying in other cities. Since the success of the NYC Tree Census, the developer of TreeKIT has been actively deploying similar technology and product in other cities worldwide, including Boston, Havana, Shenzhen, and Albuquerque[35].
Reflecting on China’s cities, urban forestry plays a critical role in alleviating air pollution and heat island effects. In 2015, The Nature Conservancy, in a partnership with the C40 Cities Climate Leadership Group, conducted research on the environmental, social, and economic benefits of urban trees in global cities[46]. This report provides two insights that are highly relevant to Chinese cities. First, a comparative estimation of the return on investment (ROI) of tree planting in cities worldwide indicates a much higher ROI for tree planning in Chinese cities. Second, the report highlights the importance of targeting urban forestry at the high spatial resolution to ensure planting trees in the right places to benefit the most-needed population. While previous studies using remote sensing or satellite images to discover urban forestry’s spatial patterns and its changes in nine major Chinese cities using ALOS (Advanced Land Observation Satellite) and SPOT-5 (Systeme Probatoire d’Observation de la Terre) data[47], citywide geo-tagged trees data is not yet publicly available in most cities in China. A lack of urban forestry data at high spatial resolution create constrain for conducting scientific research and applied analytics at an urban scale. The environmental and ecological impact of urban trees is still limited within a selected study area or a specific neighborhood. For example, recent research measured airborne particulate matter mitigation effectiveness by different tree species, based on data collected within an enclosed campus site (in Beijing Forestry University)[48]. An alternative approach is to adopt a randomized spatial sampling technique in the city area. One study focusing on carbon storage of street trees in Beijing, as another example, uses a stratified random sampling technique based on the road networks and collects 2040 street trees in 12 species[49]. While these studies conducted research properly with valid methods and analysis, a lack of city-scale data constrains extending the work scope. Citywide trees census will significantly support the above studies with scaled-up spatial analysis and model validation. Thus, a comprehensive and high-quality city open data is essential for scaling up research from a site-specific study into “urban science” as more extensive investigations with broader impact. Recent research also explored the feasibility of measuring urban forestry using over 1 million street view images from Tencent Street View in 245 major cities in China[50]. The results prove that street view image classification is a feasible and scalable method for rapid urban forestry data collection and analytics. Like the NYC case mentioned above, the tree detection algorithm using street view images is most likely to be a complementary approach to integrate with citizen-led tree data collection regarding the social benefit of the urban data crowdsourcing program. The special role of human engagement in urban data collection process resonates with the proposed integration framework (Fig. 5) as well.
4 Conclusion
Urban landscape dynamically evolves with complex interplays among nature, humans, and machines. Georges Descombes, a Swiss landscape architect, and design theorist describes that “landscape is never finished or completed, like a can of preserves; it is an accumulation of events and stories, a continuously unfolding inheritance.”[51]Digitizing the urban landscape involves a complicated process and requires quantitative, qualitative, and design expertise. Such a process will and shall not be solely relied on human labor nor entirely by A.I. automation. This article provides an extensive overview of recent technological innovations for collecting and analyzing urban forestry data. Using the NYC Street Tree Census as an example, the author describes the motivation, process, and results from one of the largest participatory urban forestry projects in the U.S. A descriptive data analysis integrating with NYC 311 service request data reveals the complex environmental and social factors involving neighborhood population health and city operations.
The multi-faceted social-ecologicaltechnical dynamics in urban forestry require a transdisciplinary view on urban systems and an integrated approach that connects information science, urban planning, city management, and community engagement. Due to the vast scope of urban forestry and complexities mentioned above, urban tree data collection should not solely rely on manual surveys or automated detection entirely conducted by the machine. The participatory nature of crowdsourcing data collection and citizen science projects brings social and educational benefits, raises digital awareness, and makes big data tangible and usable for the general public. Such efforts eventually connect nature, technology, and people in cities and contribute to holistic urban science.
Sources of Figures and Table:
Fig. 1 © the author using QGIS with 2015 NYC Tree Census data and Parks and Open Space data provided by the City of New York Department of Parks and Recreation; Fig. 2 © the NYC Department on NYC Street Tree Map, retrieved from https://tree-map.nycgovparks.org; Fig. 3 © the author after extracting, aggregating, and visualize data from NYC311, data source from https://data.cityofnewyork.us/Social-Services/311-Service-Requests-from-2010-to-Present/erm2-nwe9; Fig. 4 © the author using both NYC Tree Census and NYC 311 data; Fig. 5 © the author; Tab. 1 organized by the author.
(Editor / WANG Yaying)
