A new general index of home range overlap and segregation: the Lesser Kestrel in Southern Italy as a case study
2021-04-19AlessandroFerrariniGiuseppeGiglioStefaniaCaterinaPellegrinoandMarcoGustin
Alessandro Ferrarini, Giuseppe Giglio, Stefania Caterina Pellegrino and Marco Gustin
Abstract Background: There is increasing interest in evaluating home-range overlap (or, otherwise, segregation) between bird species, and between or within bird populations, to inform spatial planning. So far, studies of home-range overlap typically make use of comparisons between pairs of individuals, populations or species, and return a matrix of pairwise overlaps (e.g., percent overlaps). However, when the number of individuals, populations or species to be compared is elevated, an overlarge overlap matrix is difficult to interpret from an ecological viewpoint.Methods: We propose here a new, conceptually simple and computationally efficient index (general overlap index;GOI) for the ready computation within GIS of home range overlap of an arbitrarily large number (i.e., n ≥ 2) of individuals, populations or species. Whatever the number of home ranges to be compared, GOI always returns a single score between 0 and 100. As a case study, we applied our index to 24,074 GPS points of 10 Lesser Kestrels (Falco naumanni)in order to estimate within-colony and between-colony overlaps in two neighboring colonies in Southern Italy.Results: Within-colony overlap was elevated for both colonies (96.41% at Cassano delle Murge, n = 5 individuals;81.38% at Santeramo in Colle, n = 5 individuals), while between-colony overlap was low (19.12%; n = 2 colonies) and,after a randomization procedure, more spatially-segregated than expected by chance.Conclusions: Modern biotelemetry offers huge amounts of data describing the space use of animal species. The use of intuitive and straightforward indices, like GOI, can be useful to promptly extract ecological information from such an amount of data (e.g. detecting change in space use over successive years, evaluating the reliability of various home-range estimators).
Keywords: Between-colony overlap, Falco naumanni, Home range randomization, Overlap estimator, Spatial segregation, Within-colony overlap
Background
Intraspecific and interspecific interactions impact the extent and spatial patterning of animal home ranges(Adams 2001). Animals compete for resources (e.g. food,shelter and mates) and it has long been known (e.g.,Brown and Orians 1970; Davies 1978; Newton 1998) that one way to compete is to exclude potential competitors from the area containing resources. Overlap, or otherwise segregation, between bird species (Warning and Benedict 2015; Zhao et al. 2015), and between or within bird populations (Yang et al. 2011; Clay et al. 2016) has been progressively recorded in recent years due to the increased availability of telemetry data (Wang et al.2010). The increasing popularity of multi-species studies in the context of spatial management (e.g. Lascelles et al.2016) has enhanced the need to calculate home range overlap for a large number of individuals, populations or species.
Home-range overlap indices have several important applications to wildlife research and management.Overlap indices can be useful for assessing the degree of interaction among individuals as well as site fidelity for a particular individual. In addition, overlap measures may be used to measure the reliability of various home-range estimators (Fieberg and Kochanny 2005).There are several overlap indices available in the literature (Kernohan et al. 2001). The available approaches make use of comparisons between pairs of individuals,populations or species, and return a matrix of pairwise overlaps. The most common and intuitive approach is percent overlap, i.e. the proportion of animali
’s home range that is overlapped by animalj
’s home range(Kernohan et al. 2001). However, when the number of individuals, populations or species to be compared is elevated, an overlarge overlap matrix is difficult to interpret from an ecological viewpoint. For example,with only 10 individuals (populations, or species), a 10 × 10 pairwise overlap matrix is produced, whose ecological interpretation could be not that simple.Researchers have interpreted multiple pairwise comparisons using mean overlaps (e.g., Macias-Duarte and Panjabi 2013), however mean values can be scarcely representative of the pairwise overlap matrix if the dispersion of overlap values around the mean is elevated.Accordingly, we propose here a new, conceptually simple and computationally efficient index (general overlap index;GOI
hereafter) for the ready computation within GIS of home range overlap of an arbitrarily large number (i.e.,n
≥ 2) of individuals, populations or species. As a case study, we applied our index to ten Lesser Kestrels (Falco naumanni
) in order to estimate within-colony and between-colony overlap/segregation in two neighboring urban colonies (Cassano delle Murge and Santeramo in Colle; Apulia region) in Southern Italy. From an ecological point of view, it was a good study system to investigate competition during the breeding season as the two colonies represent the most elevated density of Lesser Kestrels in urban areas worldwide (Gustin et al. 2013).The Lesser Kestrel is a colonial, small falcon breeding in steppe-like grasslands and cultivated landscapes with short vegetation and extensive crops (BirdLife International 2017). It is present among Annex I species of EU Wild Birds Directive (2009/147/EEC), and its important breeding habitats have been designated as Special Protection Areas of the Natura 2000 Network.In Southern Italy, the Lesser Kestrel has been widely studied in the nearby colonies of Gravina in Puglia and Altamura (Gustin et al. 2014a, b, 2017a; Gustin et al. 2014b, 2017b, 2018; Ferrarini et al. 2018a, b;Ferrarini et al. 2018b, 2019). The study area (Fig. 1) is an agricultural landscape located within the SPA (Special Protection Area) “Murgia Alta” IT9120007, and also included within the IBA (Important Bird Area)“Murge”.
Methods
We monitored ten birds (5 at Cassano delle Murge and 5 at Santeramo in Colle; Table 1) during the nestling period (Additional file 1: Fig. S1) in the two urban colonies of Cassano delle Murge (between June 22th and July 6th 2017; 11,993 GPS points) and Santeramo in Colle (between June 13th and June 29th 2017; 12,081 GPS points) where Lesser Kestrels have their artificial nests (Additional file 1: Fig. S2). We tracked birds using TechnoSmart GiPSy-4 and GiPSy-5 data loggers(23 × 15 × 6 mm, 5 g weight; Additional file 1: Fig. S3),which provided information about date, time, latitude,longitude, altitude (m a.s.l.) and instantaneous speed(m/s). GPS sampling frequency was one fix every three minutes. We fitted birds with data loggers at their nest boxes when they were delivering food to nestlings. All devices were tied dorsally to the base of two central tail feathers (Additional file 1: Fig. S4). The weight of the devices in relation to that of the birds was less than 4%for all individuals. The attachment of transmitters did not take more than 15 min, and had no visible deleterious effects on the birds. To download the data from the data-loggers, we recaptured birds at their nest boxes.
We imported GPS data into GIS and estimated the individual home ranges using the fixed-mean minimum convex polygons (Kenward 1987) which calculates the arithmetic mean of allX
(longitude) andY
(latitude)coordinates, then selects the requested percentage of points closest to that arithmetic mean point. We also estimated colony-specific home ranges (i.e. home ranges calculated after pooling the locations of all individuals of each colony). We chose the 95% isopleth to represent home range as this value is widely used in the literature (White and Garrott 1990).In order to quantify home range overlaps, we first used the most common method (percent overlap;Kernohan et al. 2001), i.e.HR
= 100 ×A
/A
, whereHR
is the proportion of home-rangei
that is overlapped by home-rangej
,A
is the area of home-rangei
, andA
is the area of overlap between the two homeranges. AsHR
≠HR
(i.e., directional indices), we quantified the degree of overlap using bothHR
andHR
. In addition, we also employed our general overlap index (GOI
). In the case of perfectly disjoint (i.e.non-overlapping) home ranges (Fig. 2a), the total area(A
) covered by the home ranges is simply the sum of their extents (i.e. ∑A). In the case of perfectly nested(i.e. overlapping) home ranges (Fig. 2b),A
is simply the extent of the largest home range (i.e. max(A
)). In the intermediate case (i.e., partially overlapping home ranges; Fig. 2c),A
corresponds to the union of the home range polygons (i.e. ∪A). Unioning a set of (partially)overlapping polygons is a standard GIS procedure with the effect of merging their areas (Fig. 2d). Therefore,the difference between ∑Aand max(A
) represents the maximum distance possible (Dist
) from a perfectly non-overlapping situation. The difference between ∑Aand ∪Ais the observed distance (Dist
) from the perfectly disjoint situation.GOI
was calculated as (Eq. 1):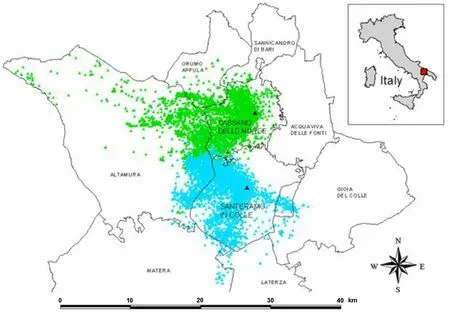
Fig. 1 Study area (Apulia, Italy). Municipalities (outlined in black) and GPS points of the two Lesser Kestrel’s colonies under study (Cassano delle Murge, green points; Santeramo in Colle, blue points) are shown. The two black triangles indicate the two urban colonies where the nests of the tracked Lesser Kestrels are located

Table 1 Description of the tracked Lesser Kestrels
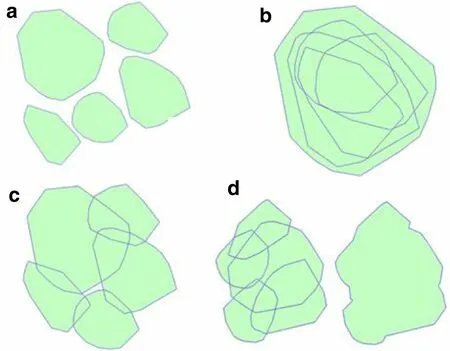
Fig. 2 a Perfectly disjoint (i.e., non-overlapping) home ranges, b perfectly nested (i.e., overlapping) home ranges, c partially-overlapping home ranges, d union (on the right) of partially-overlapping home range polygons (on the left)

n
is the number of home ranges under study.GOI
thus measures the distance of the observed overlaps from two extremes (perfect overlap and perfect non-overlap).IfDist
= 0, thenGOI
= 0 (perfect non-overlap); ifDist
=Dist
, thenGOI
= 100 (perfect overlap). If home ranges partially overlap, then 0 <GOI
< 100. The pseudocode of the algorithm used to calculateGOI
is described in the Additional file 2: Text S1.Our overlap index corresponds, in essence, to the linear equationY
= 100 × (b
-X
)/(b
-a
) wherea
is the extent of the largest home range polygon,b
is the sum of the home range extents andX
is the extent of the union of home range polygons, which varies depending upon the degree of overlap. Sinceb
≥X
andb
>a
, then the denominator is always positive while the numerator can be positive or null. In addition, sinceX
≥a
, thenb
-X
is always less than, or equal to,b
-a
. ThusGOI
is constrained in the interval [0, 100], independently of the number of home ranges under study. In the case of perfectly non-overlapping home ranges,X
=b
thenGOI
= 0. In the case of perfectly overlapping home ranges,X
=a
thenGOI
= 100.Finally, a general segregation index (GSI
) was computed as the complement to 100 ofGOI
(Eq. 2):
GOI
andGSI
(Eqs. 3, 4) show their rate of change with respect toA:

GOI
to the individual and the colonyspecific home ranges, in order to estimate withincolony (GOI
) and between-colony (GOI
) overlaps respectively. As suggested by the “diplomacy” hypothesis (Grémillet et al. 2004), spatial segregation among nearby colonies may mitigate intraspecific competition for resources. In order to test this hypothesis, we used a randomization procedure to determine ifGOI
was greater than expected by chance. Under the null hypothesis of no spatial segregation between the two colonies,GOI
should not be significantly different from the size of the overlap if the GPS points of each colony were randomly and independently assigned. As Lesser Kestrels are central place foragers, distance is highly relevant and thus we could not assume they were free to visit all locations within the study area. Thus, we generated our null expectation by using a rotation with a random angle of the observed GPS points (by anchoring points to the coordinates of the correspondent urban colony), therefore randomly positioning the GPS points of each colony while keeping distances from the colony equal (Ferrarini et al. 2018a, b). In order to apply a rotational resampling of the colony data, all the data from each individual were randomly rotated around its nest location, independently from the other individuals. Mathematically, we used the standard algorithm(Eq. 5 and Eq. 6) for rotating points around a centre of rotation:
x
,y
) is the point to be rotated, (x
,y
) are the coordinates of the nest location,θ
is the angle of rotation(positive counterclockwise), (x
,y
) are the coordinates of point after rotation.We then computed the randomly created home ranges(HR
) for each colony, and overlaps (GOI
hereafter) between the two colonies. We repeated our randomizations 9999 times. TheP
-value for each colony was determined by the proportion of randomly created overlapsGOI
that were smaller than the observed overlapGOI
.Results
In total, we collected 24,074 GPS points, 11,993 at Cassano nelle Murge and 12,081 at Santeramo in Colle respectively (Table 1).
The five Lesser Kestrels of Cassano nelle Murge had an average home range size equal to 11,129.33 ha (± 6764.46 std. dev.). The smallest and largest home ranges were 3802.39 ha (individual M6 C) and 21,142.96 ha (individual F6 C) respectively (Table 1). Pairwise percent overlaps (Table 2) ranged from 17.98% to 100%, with an average value equal to 65.51% (± 27.64 std. dev.). Individual home ranges were almost completely nested within the largest home range (individual F6 C; Fig. 3), in factGOI
was equal to 96.41% (i.e., ∑A= 55,646.66 ha;max(A
) = 21,142.96 ha; ∪A= 22,378.92 ha), thusGSI
was equal to 3.59% (Fig. 3).The five Lesser Kestrels of Santeramo in Colle scored an average home range size equal to 6132.58 ha (± 4026.29 std. dev.). The smallest and largest home ranges were2275.81 ha (individual F18 S) and 11,147.12 (individual M4 S) ha respectively (Table 1). Pairwise percent overlaps (Table 3) ranged from 20.42% to 100%, with an average value equal to 58.09% (± 27.09 std. dev.). Individual home ranges were mostly nested within the home range of the second largest home range (individual M24 S),except for individual M4 S (Fig. 3).GOI
was equal to 81.38% (i.e.,A= 30,662.86 ha; max(A
) = 11,147.12 ha;∪A= 14,779.66 ha), thusGSI
was equal to = 18.62%(Fig. 3).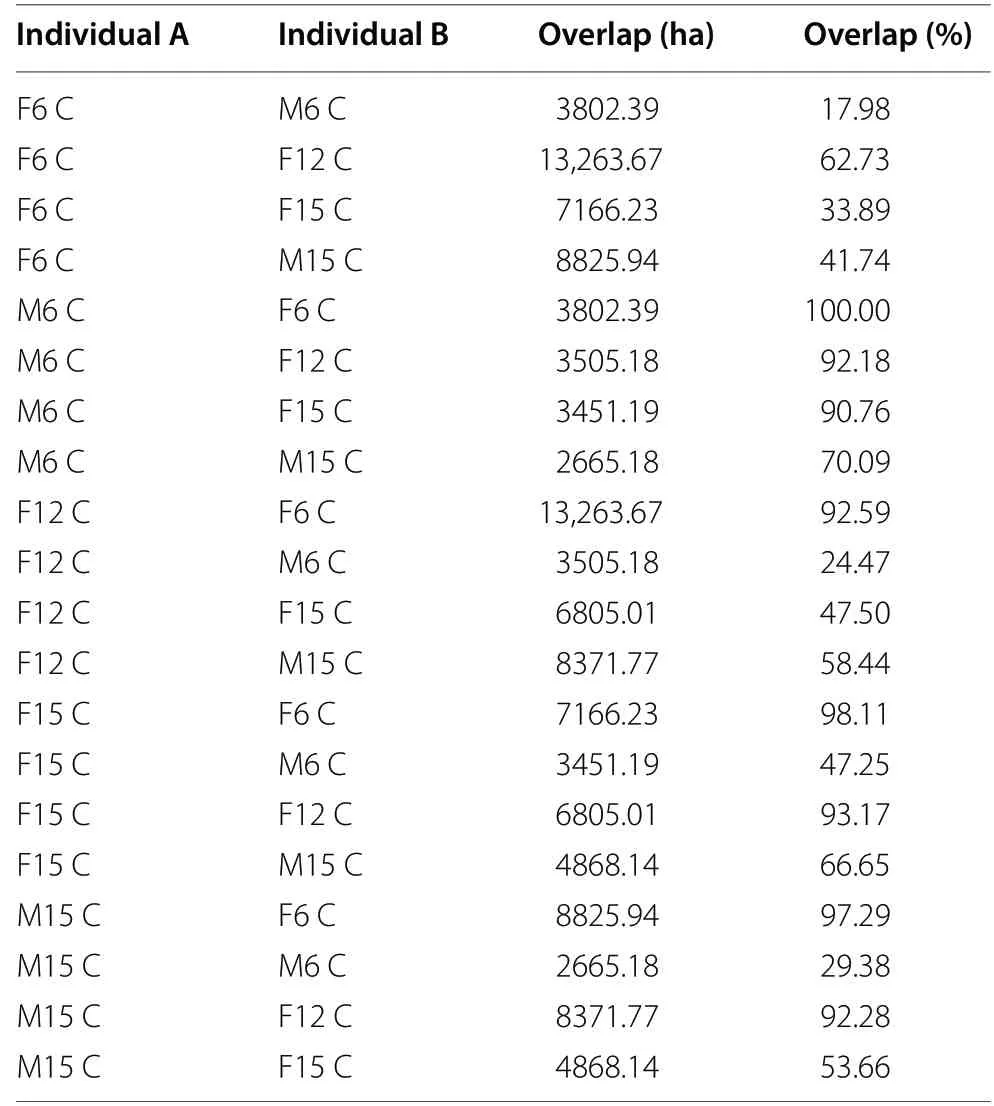
Table 2 Pairwise percent overlap (in hectares and %)between tracked Lesser Kestrels from Cassano delle Murge
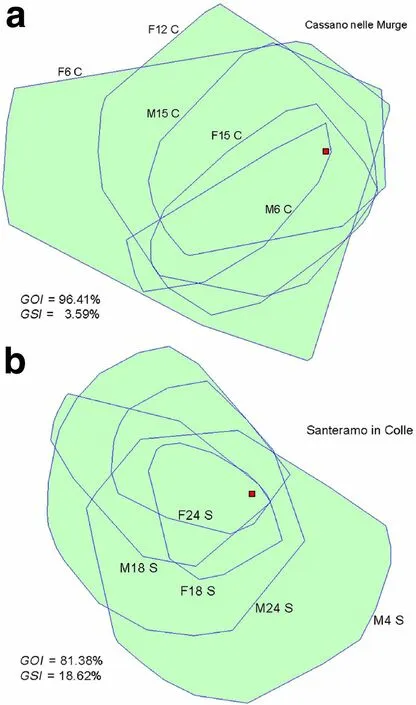
Fig. 3 Individual home ranges of the Lesser Kestrels tracked at Cassano nelle Murge (a) and Santeramo in Colle (b). See Table 1 for the GPS ID of the individuals. The red squares represent the towns of Cassano and Santeramo where the Lesser Kestrels have their nests. GOI and GSI stand for general overlap index and general segregation index, respectively
Colony-specific home ranges were 17,652.74 ha at Cassano and 13,228.31 ha at Santeramo, respectively. Between-colony overlap was 2529.46 ha.GOI
was equal to 19.12% (i.e., ∑HR= 30,881.05 ha;max(A
) = 17,652.74 ha; ∪A= 28,351.58 ha; Fig. 4), thusGSI
was 80.88%. The proportion of randomly created overlapsGOI
that were smaller than the observedoverlapGOI
was 4.36% (436 randomizations out of 9999;P
= 0.0436), therefore the null hypothesis of no spatial segregation was rejected (P
< 0.05).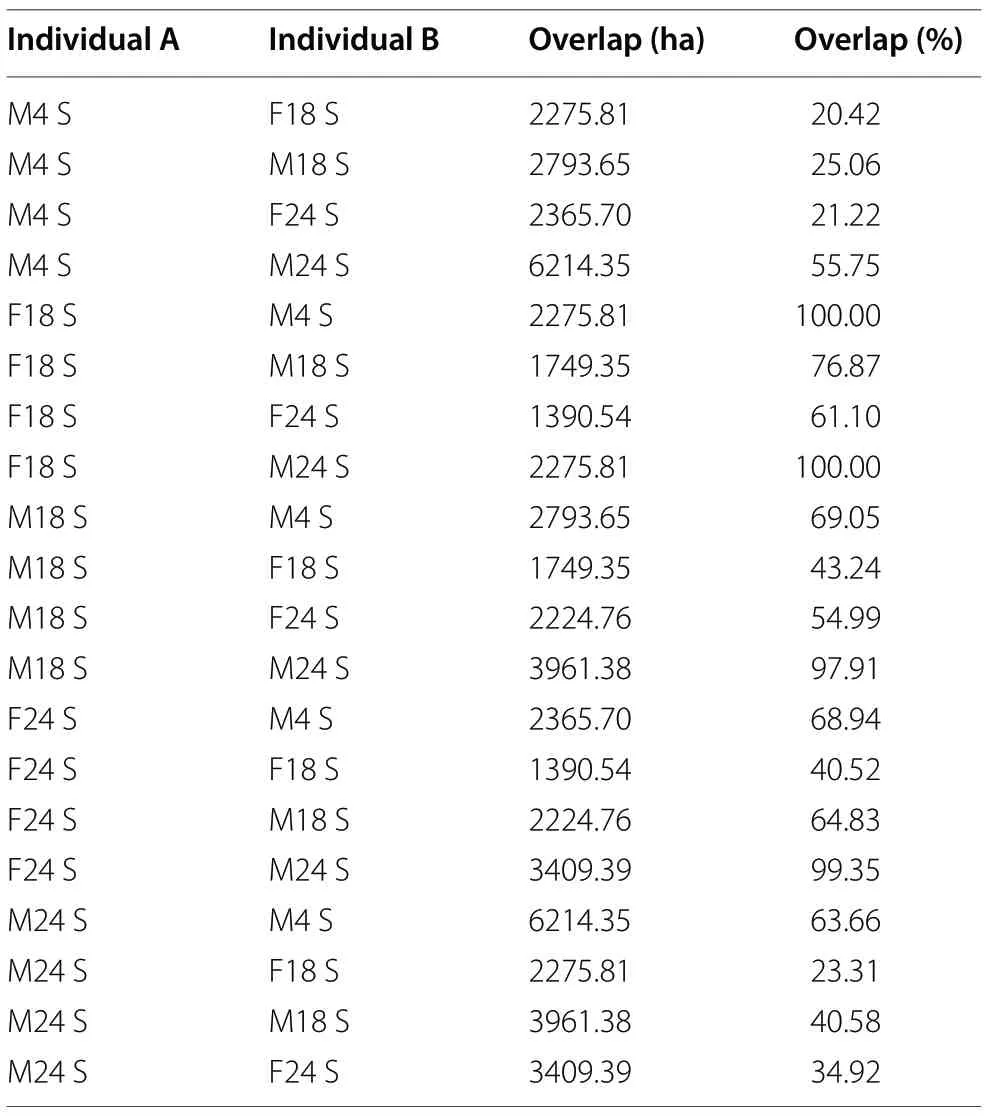
Table 3 Pairwise percent overlap (in hectares and %)between tracked Lesser Kestrels from Santeramo in Colle
Discussion
In this study, we have proposed a non-pairwise metric of home range overlap/segregation, and have applied it to two neighboring Lesser Kestrel’s colonies in Southern Italy.
Our overlap index follows a simple idea: givenn
home ranges, it is always possible to calculate the extent of two spatial configurations, perfect segregation and perfect overlap. In the former case (Fig. 2a),the extent covered by the home ranges is simply the sum of their areas, and in the latter case (Fig. 2b) it is equal to the area of the largest home range. Our index simply measures the distance of the observed overlaps from these two extremes. In doing so, our overlap index does not require calculating pairwise overlaps among individual home ranges. The uniquely non-pairwise nature of the metric leads to two interesting properties: first, it is computationally fast as it just requires the union of home range polygons (Fig. 2d) to be calculated within GIS; second, the overlap score provided byGOI
is semantically different from the overlap scores provided by pairwise overlap indices. In fact,GOI
provides an estimate of how nested different home ranges areas are. This explains why in both coloniesGOI
did not duplicate the information provided by pairwise overlap measures (Tables 2, 3), and not even some statistical properties (e.g. mean or median) of such pairwise measures. In fact, mean pairwise overlap was 65.51% ± 27.64 (mean ± std. dev.) at Cassano, and it was 58.09% ± 27.09 at Santeramo. Therefore,GOI
was outside the mean ± std. dev. interval at Cassano, and almost outside the right tail of the same interval at Santeramo. In addition,GOI
was much easier to interpret in comparison to the 5 × 5 pairwise overlap matrices(Tables 2, 3).Our overlap index also has several other desirable properties: (1)GOI
can be applied to an arbitrarily large number of home ranges (i.e.,n
≥ 2) belonging to individuals, populations (colonies) or species; (2) whatever the number of home ranges under study,GOI
returns a single overlap measure; (3) in the case of perfectly disjoint home ranges,GOI
is equal to 0; (4) in the case of perfectly nested (overlapping) home ranges,GOI
is equal to 100; (5) in any other case,GOI
returns a value between 0 and 100; (6)GOI
varies linearly between 0 and 100, independently of the number of home ranges under study. In fact, Eqs. 1-4 ensure thatGOI
andGSI
and their rates of change are independent of (a) the number of observations and (b) the initial value assumed by ∪A, but only depend on the geometric and positional properties of the home ranges. The linear nature of these metrics also ensures that small/big changes to the home range overlaps proportionally determine small/big changes toGOI
(Additional file 2: Text S2).In this study, we have appliedGOI
to 2D home ranges,however our overlap index can be readily applied to 3D home ranges as well (Tracey et al. 2014; Ferrarini et al.2018b). In the case of volumetric home ranges, the 2D home range size should be simply replaced by 3D estimation, butGOI
(and alsoGSI
) would maintain the same properties described above. We estimated home ranges through the minimum convex polygons algorithm, however the application ofGOI
(and alsoGSI
) is successive,and thus independent, of the type of algorithm (e.g. low convex hull; Getz et al. 2007) employed to assess birds’home ranges. Thus, bothGOI
andGSI
can be applied to home range polygons derived from any type of home range estimator (Signer et al. 2015). We have appliedGOI
to a central-place forager, as this type of species presents elevated within-colony overlap thus making the use of an overlap index very appropriate. In the case of bird species with low overlaps, the alternativeGSI
index could be more suitable to readily assess the degree of home range segregation.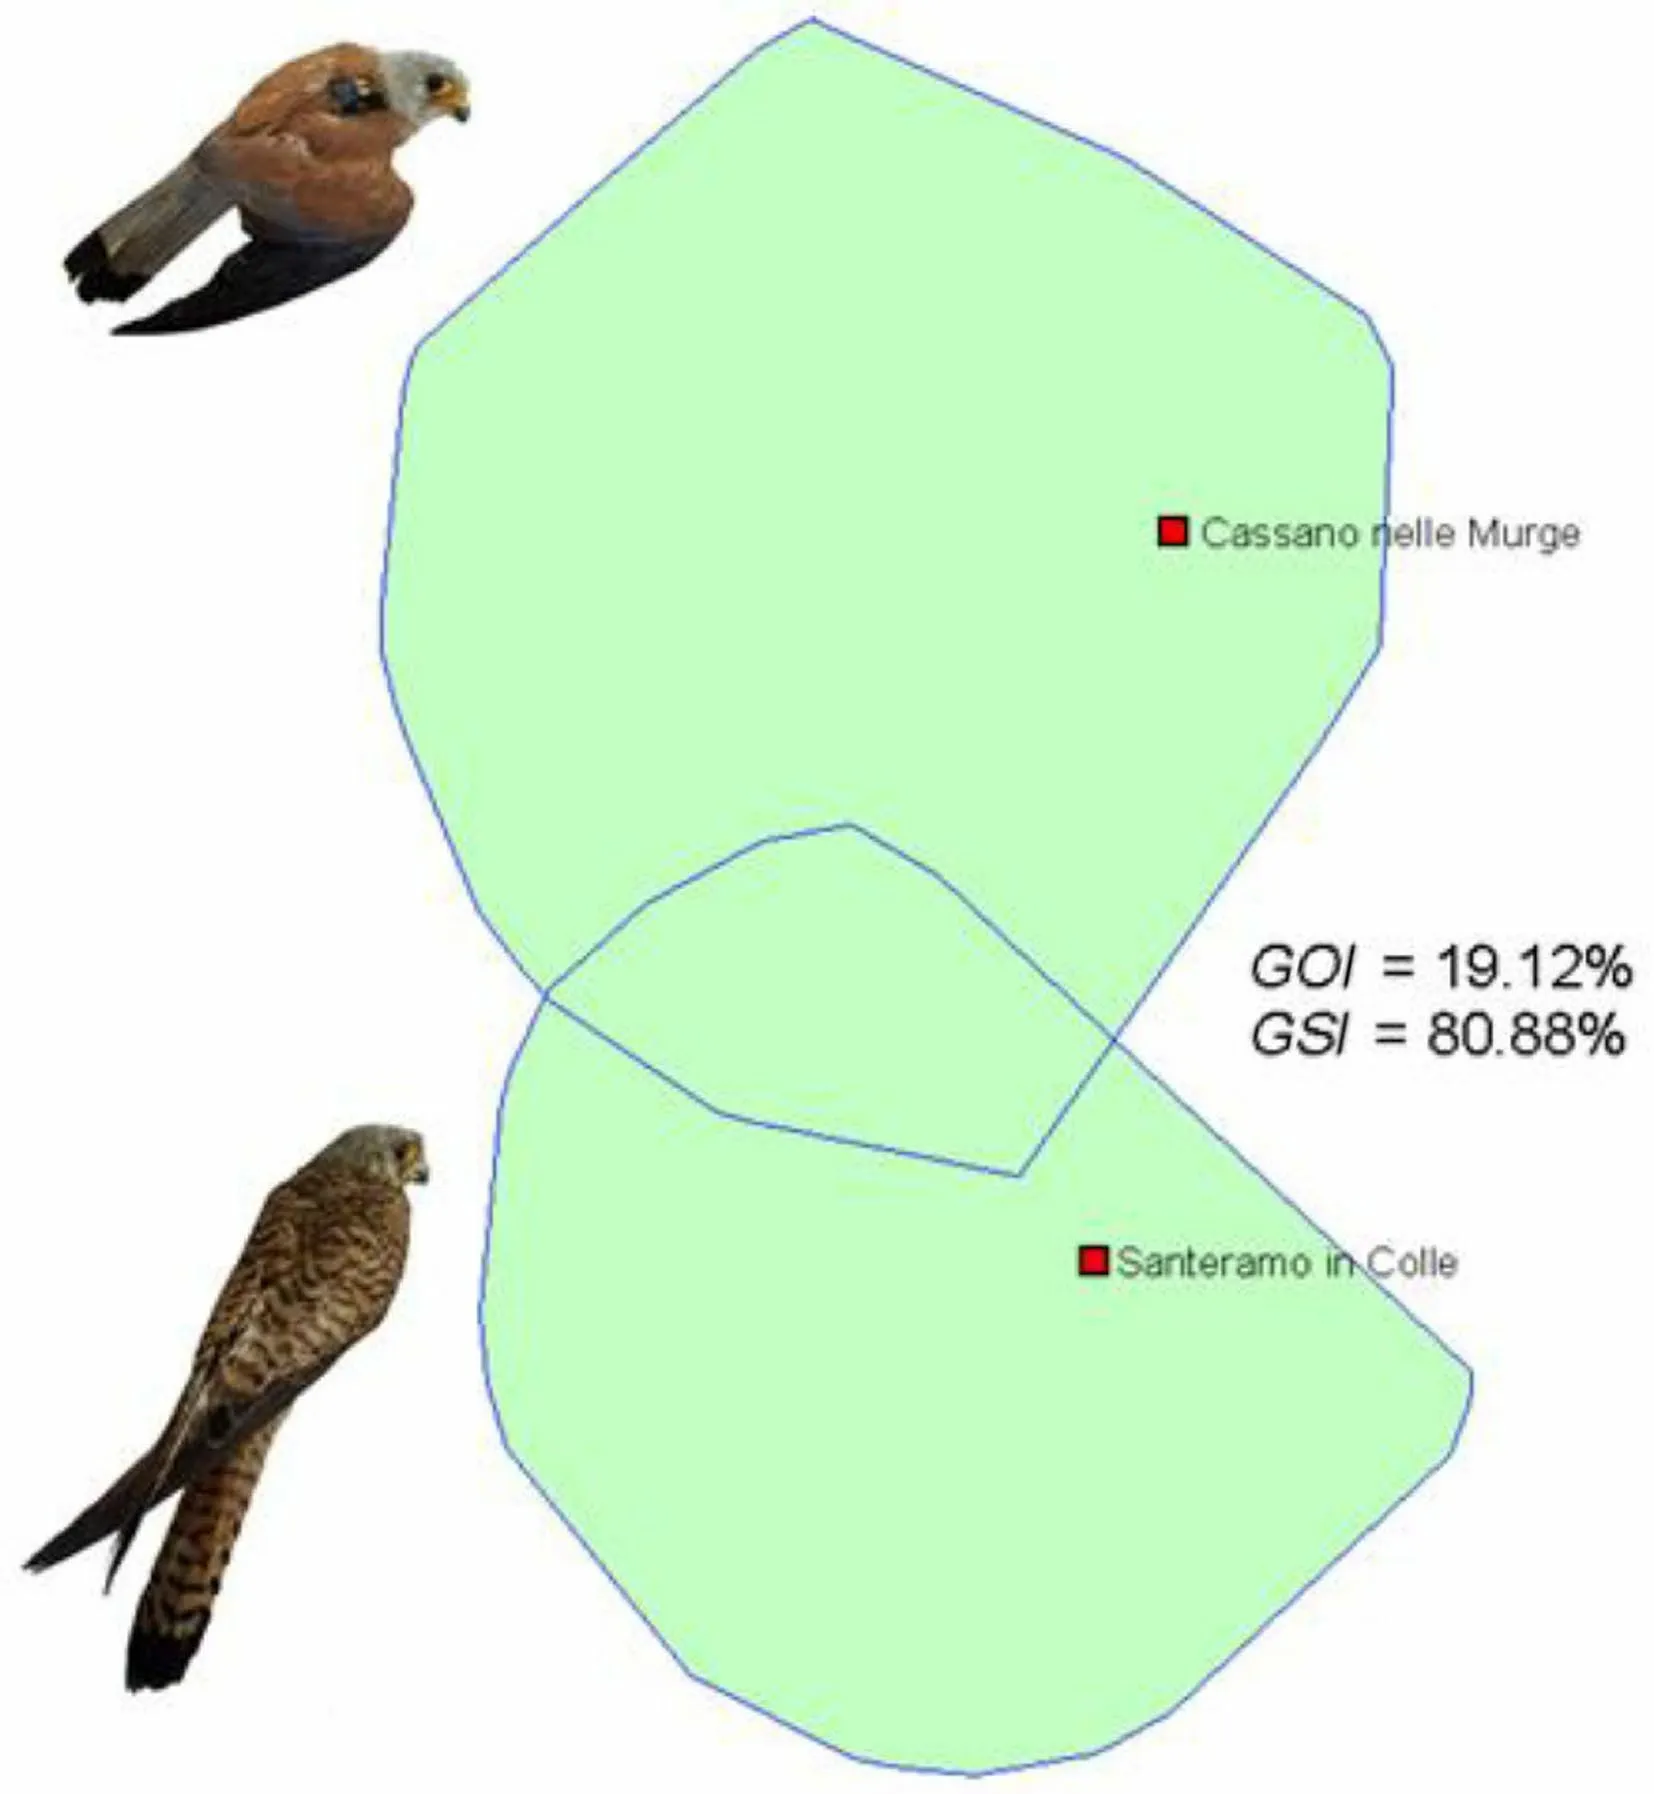
Fig. 4 Between-colony overlap. We first estimated colony-specific home ranges (i.e. home ranges calculated after pooling the locations of all individuals of each colony), then we calculated the between-colony overlap. The red squares represent the towns of Cassano and Santeramo where the Lesser Kestrels have their nests. GOI and GSI stand for general overlap index and general segregation index, respectively
The populations studied here showed elevated intracolony overlap and between-colony segregation. These results are in agreement with findings from the nearby colonies of Gravina in Puglia and Altamura (Ferrarini et al. 2018a, b), although in that case segregation was computed using a standard pairwise overlap index. During the chick rearing interval the demand for food is the highest, thus this might affect spatial segregation between the colonies. By foraging in spatially segregated areas, individuals from different colonies may avoid interference competition for food (Grémillet et al. 2004).It is therefore plausible that spatial segregation is relaxed in other periods when food demand is lower.
Conclusions
Our overlap index addresses the question of generalizing pairwise measures of home range overlap to a single measure of overlap within or across populations or species. It is not intended to replace the commonly used pairwise approach, just represents a prompt measure of home range overlap/segregation, which is particularly useful when the number of home ranges to be analyzed is elevated. As home range overlap/segregation is an ecologically significant property of animal space use and interactions,GOI
can be useful to promptly summarize ecological information from a set of home ranges estimated at individual, population or species level, and readily formulate working hypotheses and address successive analyses. Real-life applications of this metric can include (a) measuring intra-specific competition during the breeding season, (b) detecting change in space use over successive years, (c) evaluating degree of competition among various age classes, and (d) evaluating the reliability of home-range assessment by measuring the degree of overlap of several estimators.Supplementary Information
The online version contains supplementary material available at https://doi.org/10.1186/s40657-020-00240-7.
Additional file 1: Figure S1.
Field work.Figure S2.
Some artificial nests used by Lesser Kestrels in 2017.Figure S3.
GPS loggers.Figure S4.
GPS deployment.Additional file 2: Text S1.
The pseudo-code used to calculate the General Overlap Index and the General Segregation Index ofn
home ranges.Text S2.
The mathematical behaviors of the General Overlap Index and the General Segregation Index.Acknowledgements
We thank Annagrazia Frassanito (Alta Murgia National Park) for project administration. We thank three anonymous reviewers for their useful remarks and suggestions that improved this manuscript.
Authors’ contributions
AF conceived the study; GG, MG, SCP participated in the field work; AF carried out the GIS and modelling work; AF, MG drafted the earlier version of the manuscript, and GG, SCP revised it. All authors read and approved the final manuscript.
Funding
This work was supported by LIPU-UK (GIS and modelling work) and by the Alta Murgia National Park (biotelemetry and field work).
Availability of data and materials
The datasets used in the present study are available from the corresponding author on reasonable request.
Ethics approval and consent to participate
Our research adheres to local guidelines and appropriate ethical approval and licences were obtained.
Consent for publication
Not applicable.
Competing interests
The authors declare that they have no competing interests.
Received: 30 July 2020 Accepted: 15 December 2020

杂志排行
Avian Research的其它文章
- Previously unknown behavior in parasitic cuckoo females: male-like vocalization during migratory activity
- Vineyards, but not cities, are associated with lower presence of a generalist bird,the Common Blackbird (Turdus merula),in Western France
- Breeding biology of a relictual Maghreb Magpie (Pica mauritanica) population in Tunisia
- Habitat use and space preferences of Eurasian Bullfinches (Pyrrhula pyrrhula)in northwestern Iberia throughout the year
- High levels of genetic diversity and an absence of genetic structure among breeding populations of the endangered Rufous-backed Bunting in Inner Mongolia, China: implications for conservation
- Nest site selection and reproductive parameters of the threatened Atlantic Royal Flycatcher (Onychorhynchus swainsoni) and their significance for conservation
