High levels of genetic diversity and an absence of genetic structure among breeding populations of the endangered Rufous-backed Bunting in Inner Mongolia, China: implications for conservation
2021-04-19ShiLiDanLiLishiZhangWeipingShangBoQinandYunleiJiang
Shi Li, Dan Li, Lishi Zhang, Weiping Shang, Bo Qin and Yunlei Jiang
Abstract Background: The Rufous-backed Bunting, Emberiza jankowskii, is an endangered species that is primarily distributed in Inner Mongolia, China. The main threats to the continued persistence of this species are habitat loss and degradation. However, the impact of population loss on genetic diversity remains unclear. To support future conservation and management efforts, we assessed the genetic diversity and population structure of E. jankowskii using mitochondrial DNA and microsatellites.Methods: Blood samples were collected from 7-8-day-old nestlings in Inner Mongolia, China between May and August of 2012 and 2013. Mitochondrial DNA sequences and microsatellite markers were used to assess the genetic diversity, genetic structure and inbreeding of E. jankowskii. The results of genetic diversity and inbreeding were compared to other avian species.Results: We found an unexpectedly high level of genetic diversity in terms of mitochondrial DNA and microsatellite compared to other avian species. However, there were high levels of gene flow and minimal genetic structuring, among the fragmented breeding populations of E. jankowskii in Inner Mongolia. These findings suggest that E.jankowskii in Inner Mongolia is a metapopulation. Despite the high genetic diversity of E. jankowskii, local populations in each small patch remain at risk of extinction due to habitat loss. In addition, the E. jankowskii population has a high risk of inbreeding.Conclusions: To minimize further loss of genetic diversity of this endangered species, we suggest that the E.jankowskii in Inner Mongolia should be considered as a protected species for management purposes. Conservation efforts should concentrate on E. jankowskii habitat management. This may be most effectively achieved by protecting the current breeding habitats and prohibiting over-grazing.
Keywords: Conservation, Emberiza jankowskii, Genetic diversity, Genetic structure, Habitat fragmentation
Background
Genetic diversity is a prerequisite for the adaptation and survival of species (Schonewald-Cox et al. 1983; Lande 1988). Indeed, the level of genetic diversity exhibited by a species reflects its evolutionary potential (Frankel and Soulé 1981). Therefore, evaluations of genetic diversity are essential for species management and the development of conservation strategies, especially for endangered species (Hedrick 2004). Generally, endangered species exist in small populations and exhibit low rates of genetic diversity (Hinkson and Richter 2016). Small populations are more prone to genetic drift, which can randomly reduce genetic variability and population fitness by increasing homozygosity (Lande 1999; Willi et al.2007; Freeland et al. 2011). Therefore, species with low genetic diversity may lack the ability to adapt to environmental changes, and their potential for long-term survival may be diminished (Liu et al. 2003). However,relatively ancient endangered species (e.g. those that have become endangered over the last 150 years due to habitat fragmentation) may retain high genetic diversity due to long generation times (Lippé et al. 2006).
The Rufous-backed Bunting (Emberiza jankowskii
),a small grassland passerine with strict habitat requirements, was a common species throughout its historical breeding range. Historically,E. jankowskii
has bred in Heilongjiang, western and eastern Jilin Province in China, extreme northeastern North Korea, and south of the Russian Far East (Wang et al. 2011). Because of habitat fragmentation, human activities, and low reproductive success, populations of this species have declined dramatically over the last 50 years (Jiang et al. 2008).E
.jankowskii
has been listed as endangered on the IUCN Red List since 2010 (BirdLife International 2018). From 2011-2016, we surveyed the breeding distribution ofE
.jankowskii
in China and demonstrated that this species has vanished from most of its historic breeding sites (Wang et al. 2011; Han et al. 2018). Fortunately, we discovered 13 newE
.jankowskii
breeding sites in Inner Mongolia. However, these new breeding sites were seriously degraded because of over-grazing, urbanization,and agriculture (Han et al. 2018). During the course of our survey from 2012 to 2018, the populations ofE.jankowskii
at the new breeding sites began to decline and become increasingly fragmented (Han et al. 2018).Experimental studies and field investigations have shown that fragmented populations may lose allelic richness and genetic diversity (Buza et al. 2000; Tomimatsu and Ohara 2003). Previously, major histocompatibility complex (MHC class II B) genes were used to examine the genetic diversity ofE. jankowskii
, and results showed relatively low levels of MHC polymorphisms (Li et al.2017). MHC genes were mainly relevant to immune function (Mak and Sanderson 1985; Schad et al. 2004).These findings indicate that MHC polymorphisms are affected by selection. The selection pressures on MHC genes can produce discrepancies between patterns of MHC and neutral variation in natural populations(Alcaide et al. 2010; Sutton et al. 2011). MHC polymorphisms will not provide a precise measure of genomewide diversity. We suggest the use of neutral markers to evaluate the genetic diversity ofE. jankowskii
.To investigate the genetic diversity and structure ofE.jankowskii
based on neutral markers, we (1) used mitochondrial DNA sequences and microsatellite markers to compare this level of genetic diversity to previously published levels of genetic diversity in other avian species, (2)estimated whetherE
.jankowskii
was inbreeding because of low population sizes, (3) determined the genetic structure among populations ofE
.jankowskii
, and (4) discussed the next stage ofE
.jankowskii
conservation work.Methods
Sample collection
We used a direct search method to findE
.jankowskii
nests in Gahaitu (GHT), Aolunhua (ALH), Lubei (LB),Chagantaoligao (CG), and Kundu (KD), in Inner Mongolia, China between May and August of 2012 and 2013(Fig. 1). Blood samples were taken by venipuncture (brachial vein) under the wings of 7-8 day old nestlings. Samples were mixed with absolute ethyl alcohol in 1.5 mL tubes and preserved at − 20 °C.According to the population density of Han et al. (2018)and the area of our sample sites (GHT 3.87 km, ALH 4.74 km, LB 3.91 km, CG 1.27 km, and KD 2.55 km),we assessed the population sizes of five sampling sites.The population size, sampling nests in each sample site,and the distance among sampling sites are presented in Table 1.
Mitochondrial DNA amplification and microsatellite genotyping
Total genomic DNA was isolated using an AxyPrep Blood Genomic DNA Miniprep Kit (Aisijin, Hangzhou,China). All nestlings in the same nest have the same parents, we sampled only one randomly selected nestling per nest (a total of 59 individuals). We used polymerase chain reactions (PCRs) to amplify hypervariable region I (HVI) of the mitochondrial control region using the novel primers A629 (5′-GTA TTC AAC CGA CCA CTT-3′) and S19 (5′-CTC CGA GAC CTA CGA CCT G-3′).PCR amplifications were performed in 20 μL volumes containing 10 μL of 2 × Taq PCR Master Mix (Sangon Biotech), 0.25 μL of each primer (10 μM), and 1 μL template DNA. The PCR cycling program was as follows:an initial denaturation step at 94 °C for 5 min; followed by 35 cycles of denaturation at 94 °C for 30 s, annealing at 53.7 °C for 30 s, and extension at 72 °C for 30 s; then a final extension at 72 °C for 10 min. All the sequences were deposited in GenBank under accession numbers MH670589-MH670647.
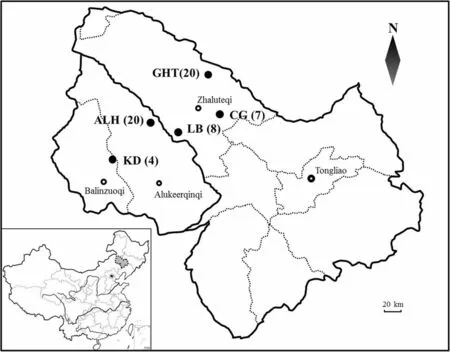
Fig. 1 Geographical distribution of Emberiza jankowskii in Inner Mongolia, China. Black dots represent sampling sites. Black circles indicate cities.The numbers of individuals sampled are given in parentheses

Table 1 Population size, sampling nests, and distance of sample sites
We amplified 10 microsatellite loci from each of the 59 individuals using 10 primer pairs: Ecit3, Dpμ16, Escμ1,Escμ2, Escμ3, Escμ4, LS2, Ecit2, HXW20, and embc30(Hanotte et al. 1994; Mundy and Woodruff 1996; Dawson et al. 1997; Wonke et al. 2007; Yu et al. 2011; Segelbacher and Schuphan 2014). We optimized the reaction volumes and PCR protocols for each primer pair. Microsatellite loci were scored by Sangon Biotech (Shanghai, China).Final fragment sizes were calculated in GeneMarker v1.91 (SoftGenetics LLC, State College, PA, USA) and scored manually.
Data analysis
We calculated various mitochondrial diversity parameters in DnaSP v5.10 (Rozas et al. 2003), including haplotype diversity (H
), nucleotide diversity (π
), and the number of polymorphic and phylogenetically-informative sites (Nei and Tajima 1981; Graur and Li 2000).We used GENEPOP v4.6 (Rousset 2008) to test for deviations from the Hardy-Weinberg equilibrium and to identify alleles exhibiting linkage disequilibrium among all loci across all populations, using 10,000 dememorizations, 10,000 batches, and 10,000 iterations per batch.Critical significance levels were adjusted for multiple comparisons using the sequential Bonferroni correction(α
=p
/n
; Rice 1989). Loci were checked for the likelihood of null alleles with Micro-checker (Van et al. 2004).Genetic statistics were used to measure the genetic variability of the microsatellites, observed heterozygosity (H
) and expected heterozygosity (H
) under Hardy-Weinberg were also computed with GENEPOP 4.6. The number of alleles, the number of private alleles, and gene diversity were computed with FSTAT v2.9.3 (Goudet 2001).We calculated the fixation index (F
) in Arlequin v3.5 and Genetix v4.05 (Nei 1978; Excoffier et al. 1992; Belkhir et al. 1996; Schneider et al. 2000), and gene flow (N
)was estimated using the equationN
= 0.25 (1 −F
)/F
(Excoffier et al. 1992; Schneider et al. 2000). The inbreeding coefficient (F
) was calculated with GENEPOP 4.6.For our phylogenetic analyses, the D-loop sequences ofE.schoeniclus
(AJ243929),E. cirlus
(AJ243928), andMiliaria calandra
(AJ243925) were downloaded from GenBank and used as outgroups. The optimal models of nucleotide substitution were determined using the Akaike Information Criterion (AIC) in jModelTest v2.1.10 (Posada andThomas 2004). The best model of nucleotide substitution,as selected by the AIC, was TVM + G. We used maximum likelihood (ML) in PHYML (Guindon et al. 2005),maximum parsimony (MP) and neighbor-joining (NJ)in PAUP* v4.0 (Swofford 2001), and Bayesian inference(BI) in MrBayes v3.1.2 (Huelsenbeck and Ronquist 2001;Ronquist and Huelsenbeck 2003) to construct phylogenies. For the ML analysis, we set the parameters of the custom model based on the AIC results. Networks were constructed by median-joining in Network 5.0 (Bandelt et al. 1999).We assessed population structure based on a Bayesian analysis of microsatellites. We used STRU CTU RE v2.3.3 (Pritchard et al. 2000) to assign individuals toK
= 1-5 data clusters, with the higher number of clusters corresponding to the number of populations assessed (Flanders et al. 2009; Mao et al. 2010). We performed 10 replicate STRU CTU RE runs for eachK
value.Monte Carlo Markov chains (MCMCs) were admixed for 2,000,000 cycles using independent models of allele frequencies, with the first 20% of the cycles discarded as‘burn-in’. The bestK
value was defined using the ΔK
statistic as described by Evanno et al. (2005).We used the Bayesian method of MIGRATE-N to assess the microsatellite migration rates (Beerli 2006).Five long chains of 1.0 × 10generations were used for all runs of MIGRATE-N. The same three-step process was conducted on the actual data to form the test statistic. To ensure adequate mixing of Markov chains, we used Markov-coupling, where 4 independent chains were allowed to mix according to an adaptive heating scheme(1.0, 1.2, 1.5, 6.0).
To reconstruct the demographic history ofE. jankowskii
,the historical demographic dynamics ofE. jankowskii
were inferred from Bayesian skyline analyses implemented in BEAST 2.6.2 (Bouckaert et al. 2019). We used D-loop sequences for this analysis and selected the mean substitution rate at 1.0 to estimate time in units of substitution/site. Independent MCMC analyses were run for 1.0 × 10steps, sampling every 10steps, and discarding 1000 samples as burn-in. The results visualized skyline plots with TRACER 1.5 (Drummond and Rambaut 2007).Sequence divergence rate of 2%/Myr was applied to the mtDNA D-loop region (Shields and Wilson 1987).Results
Genetic diversity
The genetic diversity ofE
.jankowskii
based on mitochondrial DNA and microsatellites is shown in Table 2.Amplification of the control regions (544 bp) from 59 individuals yielded 16 haplotypes with 14 polymorphic sites and 8 parsimony informative sites. The total haplotype diversity (H
) was 0.874 (standard deviation(SD) = 0.023), and the overall nucleotide diversity (π
) was 0.0032 (SD = 0.0003).We detected no significant departures from the Hardy-Weinberg equilibrium after correcting for the number of pairwise comparisons (n
= 49;α
= 0.001), with the following exceptions: locus Ecit3 in GHT, LB, and ALH; locus Escμ4 in GHT; locus HXW20 in GHT and CG; and locus embc30 in GHT and ALH. After Bonferroni correction,Fisher’s exact test identified no significantly linked pairs of loci (n
= 225,α
= 0.0002). The micro-checker analysis did not suggest any scoring errors due to stuttering, nor did it suggest any large allelic dropout in any loci across all populations. Null alleles may have been present in locus Ecit3 in GHT, LB, and ALH; locus Escμ4 in GHT;locus LS2 in LB; locus HXW20 in GHT, ALH, and CG;and locus embc30 in GHT and ALH. Because we identified departures from the Hardy-Weinberg equilibriumand null alleles in the loci Ecit3, HXW20, and embc30 in two or more populations, we deleted these three loci from subsequent analyses.
Table 2 Genetic diversity parameters of E. jankowskii
The number of alleles per locus ranged from 4 to 16 across all populations (mean ± SD: 9.00 ± 5.03), with the most alleles found in the GHT population (7.00 ± 3.87)and the least found in the KD population (3.29 ± 1.11).Private alleles with a frequency over 10% were observed in the KD (P
= 2) and LB (P
= 1) populations. The gene diversity per population was 0.71 ± 0.19 in the GHT population, 0.72 ± 0.14 in the LB population, 0.67 ± 0.15 in the ALH population, 0.75 ± 0.13 in the CG population, and 0.58 ± 0.21 in the KD population. The highest observed heterozygosity (H
) and expected heterozygosity (H
) were observed in the CG population (0.7959 and 0.7551, respectively), while observed heterozygosity was lowest in the ALH population (0.5929) and expected heterozygosity was lowest in the KD population (0.5970)(Table 2).Average inbreeding coefficient (F
) ofE. jankowskii
in Inner Mongolia was estimated as 6.92%. Within population,F
ranged from − 0.1633 (KD) to 0.1545 (LB)(Table 2).Based on mitochondrial DNA and microsatellite data,the fixation index (F
) was highest between the CG and LB populations (0.18462) and the CG and KD populations (0.06296), and lowest between the GHT and LB populations (0.00546) and CG and LB populations(0.00411). Thus, gene flow was highest between the GHT and LB populations (45.5376) and CG and LB populations (60.5779), and lowest between the CG and LB populations (1.1041) and CG and KD populations (3.7206)(Tables 3, 4).Population structure
The NJ, MP, ML, and BI phylogenies were highly congruent. AllE
.jankowskii
haplotypes clustered together,in a clade marked by shallow sequence divergences with no well-supported basal haplotype (Fig. 2). Additionalanalyses were conducted to assess the genetic structure of five populations by building a median-joining network.The network showed three different second levels (hap 1, 2 and 7), with some significant associations. Based on expectations from the coalescent theory, hap 2 was the haplotype with the highest frequency and most connections, and thus was the most likely ancestral haplotype(Fig. 3).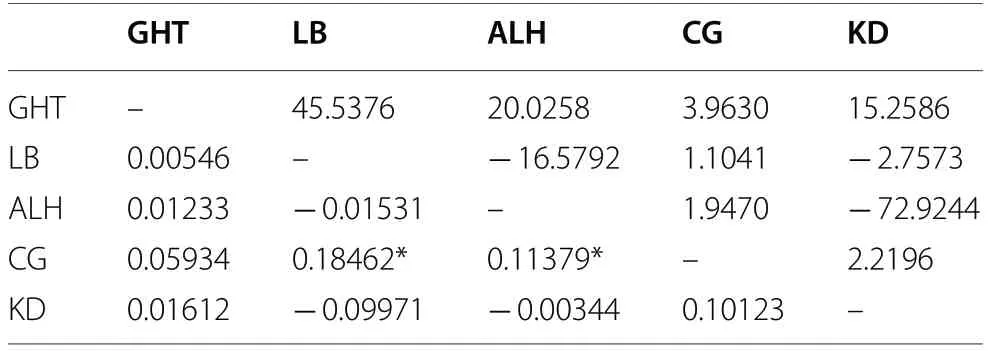
Table 3 Pairwise fixation index (FST) (lower triangle)and gene flow (Nm) (upper triangle) of five E. jankowskii populations based on D-loop sequences
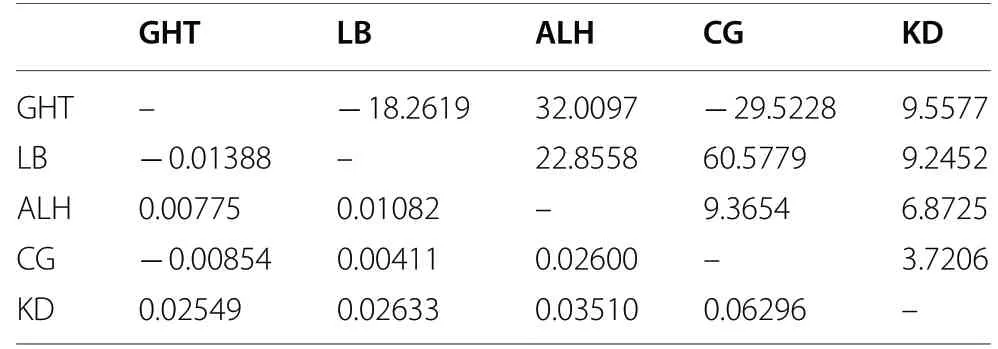
Table 4 Pairwise fixation index (FST) (lower triangle)and gene flow (Nm) (upper triangle) of five E. jankowskii populations based on microsatellite data
Although the best separation was obtained atK
= 2(ΔK
= 1.68), our STRU CTU RE simulation indicated that homogenization was occurring across allE. jankowskii
populations in Inner Mongolia; clear signs of admixture were observed in all subpopulations (Fig. 4, showingK
= 2 and 3 only).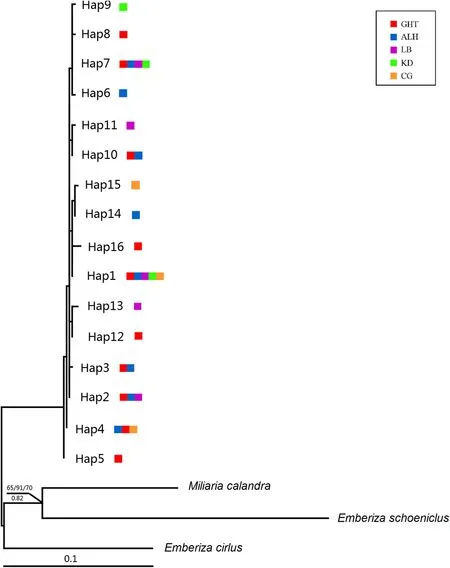
Fig. 2 Phylogenetic tree of E. jankowskii recovered by maximum likelihood analysis. Bootstrap support and posterior probabilities are shown only for nodes highly supported by at least two phylogenetic reconstruction methods (i.e., ≥ 60% maximum likelihood, maximum parsimony or neighbor-joining bootstrap support or ≥ 0.60 Bayesian posterior probability). Outgroups (obtained from GenBank) are indicated by their species names. Colored squares represent different populations. Details of the populations are given in the text
Our analysis of molecular variance (AMOVA), based on the distance matrices among individuals, indicated that the overall variation could be partitioned into two levels (Table 5). The proportion of variation attributable to within-population differences was particularly high(mtDNA: 96.76%; microsatellites: 98.71%). The fixation indices (F
) were 0.03 based on mtDNA, and 0.01 based on microsatellites (P
> 0.05). All estimates of genetic differentiation indicated a relatively low level of genetic differentiation across all populations.The results of Migrate-N show that there were significant gene flows between different populations. There are migrations in and out among the five populations(Table 6).
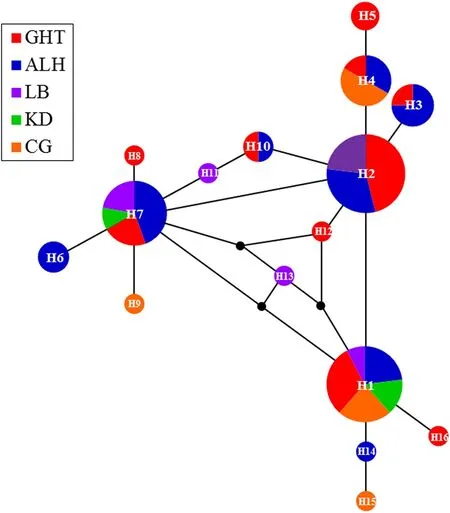
Fig. 3 Median-joining network of 16 mtDNA haplotypes of E.jankowskii. In the network, different colors represent different populations
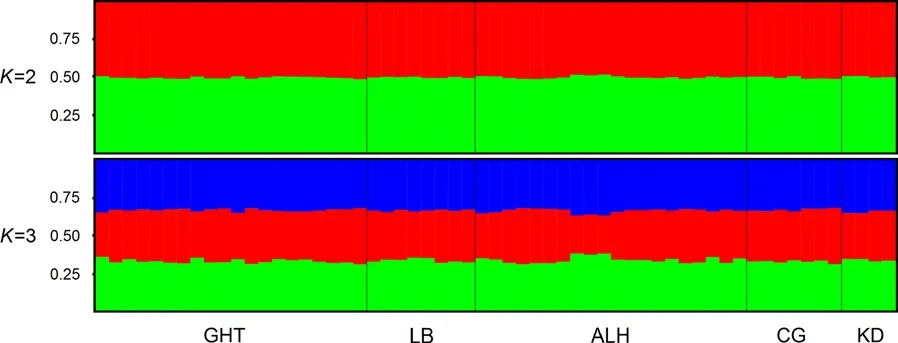
Fig. 4 Structure clustering of E. jankowskii individuals based on microsatellite genotypes. Clusters are shown for K = 2 and K = 3.Population acronyms are shown on the X-axis. Details of the populations are given in the text
Demographic history
Due to the existence of gene flow and the absence of genetic structure, we placedE. jankowskii
in Inner Mongolia into one group for BSP analysis. The Bayesian skyline plots (BSP) revealed that the population size ofE.jankowskii
in Inner Mongolia is stable (Fig. 5).Discussion
High-level genetic diversity and inbreeding
Surveys of genetic diversity in endangered species are essential for the evaluation of the evolutionary and adaptive potential of these species, such surveys are also vital for the development of effective conservation strategies to protect threatened populations, especially those that are fragmented (Zhang et al. 2017; Stevens et al. 2018).In this study, we investigated the genetic diversity ofE.jankowskii
for the first time, employing mitochondrial DNA sequences and microsatellite data.E. jankowskii
had a higher level of haplotype diversity (0.874) and nucleotide diversity (0.0032) in its D-loop gene sequence than other endangered species, such asNipponia nippon
(H
= 0.386,π
= 0.0007) (Zhang et al. 2004) andMegulus palustris sinensis
(H
= 0.772,π
= 0.0014) (Zhang 2007).Interestingly, the haplotype and nucleotide diversity ofE.jankowskii
was also higher than one species of least concern,Parus varius
(H
= 0.5328,π
= 0.0017) (Du 2011).The microsatellite results also indicated thatE. jankowskii
had a higher degree of genetic diversity than all passerines birds (H
= 0.24-0.59), which were listed in the article of Jamieson et al. (2006), and also higher thanN.nippon
(H
= 0.50,H
= 0.47) (He 2007), andM. palustris sinensis
(H
= 0.53,H
= 0.38) (Zhao 2012). The observed heterozygosity ofE. jankowskii
was higher thanGallus gallus
(H
= 0.37-0.41) andPerdix dauuricae
(H
= 0.58),but the expected heterozygosity ofE. jankowskii
was a little lower thanGallus gallus
(H
= 0.72-0.77) andPerdix dauuricae
(H
= 0.72) (Cao et al. 2010; Masroor et al.2012).
Table 5 Analysis of molecular variance (AMOVA) among E. jankowskii mitochondrial D-loop sequences and microsatellite data across five populations

Table 6 Estimates of mutation-scaled effective population size (θ) and mutation-scaled effective immigration rate (M)for the five populations of E. jankowskii using MIGRATE-N
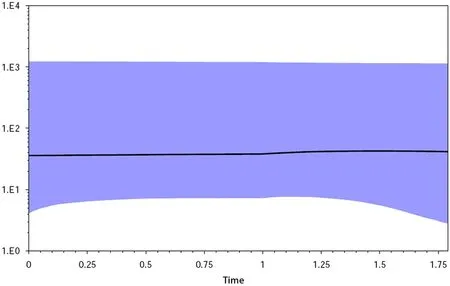
Fig. 5 Historical demography of E. jankowskii inferred from mtDNA D-loop sequences. Bayesian skyline plots for E. jankowskii in Inner Mongolia, showing effective population size as a function of time.The upper and lower limits of light blue trend represent the 95%confidence intervals of HPD analysis
It is well established that decreases in genetic variation may reduce fitness and adaptability (Allentoft and O’Brien 2010). Generally, endangered species tend to have small population sizes and low levels of genetic diversity due to historical reasons, and reduce fitness (Matocq and Villablanca 2001). Unexpectedly,E.jankowskii
exhibited high levels of genetic variability.This indicated that habitat fragmentation and degradation have not led to the rapid loss of genetic diversity in this species. There may be several explanations for this result. First, it is possible thatE. jankowskii
populations were historically very large (Fu and Chen 1966). Second,the observed reduction inE. jankowskii
population sizes occurred during past 50 years (Jiang et al. 2008). This means that due to the small number of generations,E.jankowskii
has not experienced a rapid decline in genetic diversity (Welch et al. 2012). Third, birds with higher dispersal abilities may therefore maintain high levels of genetic diversity due to gene flow. Fourth, hybridization and introgression with closely related species can also contribute to the maintenance of high levels of genetic diversity (Mallet 2005). However, whether hybridization and introgression had occurred betweenE. jankowskii
andE. cioides
requires further investigation.Although there are some methods available to minimize inbreeding (Pusey 1987), inbreeding may be inevitable in small, isolated populations and play a role in determining the probability of local extinction events(Frankham 2005). In this study, the average inbreeding coefficient ofE. jankowskii
in Inner Mongolia was estimated at 0.069 (Table 2), higher than other Passerine birds (F
= 0.024-0.054) and the captive panda population at the Chengdu (n
= 37,F
= 0.045) (Sun et al. 2010;Abalaka et al. 2015). This indicated that a high inbreeding risk existed forE. jankowskii
in Inner Mongolia or may have occurred to some extent. However, high levels of genetic diversity withinE. jankowskii
populations indicated that inbreeding depression did not occur.Absence of genetic structure and high levels of gene flow
Genetic population structure imparts important information about species ecology and evolutionary history,including dispersal ability, adaptation, and speciation(Rousset 2004). Genetic population structure can also help to determine important species conservation units in patchy, fragmented habitats (Paetkau 1999). Here, no clear phylogeographic structure was observed across the fiveE. jankowskii
populations in either the phylogenetic tree or the cluster analyses. TheF
values of the five populations were relatively low (mtDNA: 0.00546-0.18462; microsatellites: 0.00411-0.06296). In addition,theF
values between populations ALH and LB; KD and LB; ALH and KD; GHT and LB; GHT and CG were negative (Tables 2, 3). Negative values suggest a lack of support for genetic differentiation between these population pairs (Foster et al. 2006).Gene flow among populations is an important mechanism that maintains intraspecific genetic diversity (Slatkin 1994). Species with low levels of gene flow show more genetic differentiation among populations than do species with high levels of gene flow (Hamrick et al. 1991). InE. jankowskii
, various levels of gene flow were calculated among populations (Tables 3, 4). This was consistent with the AMOVA results, which identified more genetic variation within populations than between populations(Table 5). There was an asymmetric gene flow between certain populations (Table 6).Conservation implications
The five populations ofE. jankowskii
sampled here exhibited an absence of genetic structure and various levels of gene flow. Thus,E. jankowskii
in Inner Mongolia is a metapopulation. We therefore suggest that, for the purposes of species management,E. jankowskii
in Inner Mongolia should be defined as one protected unit.AlthoughE. jankowskii
showed high genetic diversity,andE. jankowskii
population sizes ranged between 9800 and 12,500 individuals (Han et al. 2018), but the number of individuals in every single patch is small (Table 1)and with high inbreeding risk. The local population in each patch might vanish due to habitat loss (Wang et al.2011). Therefore, conservation policies limiting habitat destruction are necessary to mitigate the threat of species extinction.TheE. jankowskii
in Inner Mongolia is still at risk of human disturbances, habitat loss, and habitat degradation (Han et al. 2018). The extremely limited habitat of this species (similar to the habitat requirements ofPrunus sibirica
andStipa baicalensis
on the Mongolian steppes) might makeE. jankowskii
very sensitive to habitat fragmentation, water pollution, global warming, and the degradation of habitats suitable forP. sibirica
andS.baicalensis.
Thus, habitat conservation and population management are urgently needed for this avian species. Indeed, the high genetic variability ofE. jankowskii
indicates the ability to recover if provided with effective protection (Evans and Sheldon 2008). Therefore, we suggest that management efforts for this species focus on the protection of the current breeding habitats and elimination of over-grazing. Establishing specific natural areas to preserve the breeding habitats ofE. jankowskii
and publicizing the importance of protecting this avian species to local residents might also be effective and should be considered. We hope that our work contributes to the establishment of a management and protection system forE.jankowskii
. Our laboratory will continue to carry out the long-term monitoring of this species.Future prospects
This study has shown thatE. jankowskii
exhibits a high level of genetic diversity. We found thatE. cioides
, a closely related species (Alström et al. 2008), had overlapping distributions withE. jankowskii
in Inner Mongolia.
Several studies have indicated that species in nature are often incompletely isolated for millions of years after speciation. There are many cases of hybridization and introgression occurred among closely related sympatric species (Mallet 2005). Whether hybridization and introgression had occurred betweenE. jankowskii
andE. cioides
and whether this contributes to the high level of genetic diversity ofE. jankowskii
require further investigation.Conclusions
E. jankowskii
in Inner Mongolia is a metapopulation,so we suggest that theE. jankowskii
in Inner Mongolia should be considered one protected unit for management purposes. The conservation efforts should concentrate on protecting the current breeding habitats and forbidding over-grazing.Acknowledgements
We thank Bo Zhang and Huijuan Tao for field support. We thank LetPub(www.letpu b.com) for its linguistic assistance during the preparation of this manuscript.
Authors’ contributions
SL and DL made equivalent contributions to this paper: both conceived and designed the experiments, carried out the molecular genetic analysis, participated in the manuscript’s design, and drafted the manuscript. YJ developed the ideas and obtained funding support. LZ and BQ helped collect samples and classify species. WS helped perform the microsatellite experiments. All authors read and approved the final manuscript.
Funding
This work was financed by the National Natural Science Foundation of China(Grant Nos. 31601856 and 31670398).
Availability of data and materials
The data on which this paper was made are fully available at the appendix of the manuscript.
Ethics approval and consent to participate
This study conformed to the guidelines for the care and use of experimental animals established by the Ministry of Science and Technology of the People’s Republic of China (Approval number: 2006-398). The research protocol was reviewed and approved by the Ethics Committee of Jilin Agriculture University.
Consent for publication
Not applicable.
Competing interests
The authors declare that they have no competing interests.
Received: 14 May 2020 Accepted: 10 December 2020

杂志排行
Avian Research的其它文章
- Previously unknown behavior in parasitic cuckoo females: male-like vocalization during migratory activity
- Vineyards, but not cities, are associated with lower presence of a generalist bird,the Common Blackbird (Turdus merula),in Western France
- Breeding biology of a relictual Maghreb Magpie (Pica mauritanica) population in Tunisia
- Habitat use and space preferences of Eurasian Bullfinches (Pyrrhula pyrrhula)in northwestern Iberia throughout the year
- Nest site selection and reproductive parameters of the threatened Atlantic Royal Flycatcher (Onychorhynchus swainsoni) and their significance for conservation
- The Grey-backed Shrike parents adopt brood survival strategy in both the egg and nestling phases
