Cranial variation in allactagine jerboas (Allactaginae,Dipodidae, Rodentia): a geometric morphometric study
2021-04-15BaderAlhajeri
Bader H.Alhajeri
1 Department of Biological Sciences, Kuwait University, Safat 13060, Kuwait
ABSTRACT Allactaginae is a subfamily of dipodids consisting of four- and five-toed jerboas (Allactaga, Allactodipus,Orientallactaga, Pygeretmus, Scarturus) found in open habitats of Asia and North Africa.Recent molecular phylogenies have upended our understanding of this group’s systematics across taxonomic scales.Here, I used cranial geometric morphometrics to examine variation across 219 specimens of 14 allactagine species (Allactaga major, A.severtzovi, Orientallactaga balikunica, O.bullata, O.sibirica, Pygeretmus platyurus, P.pumilio,P.shitkovi, Scarturus aralychensis, S.euphraticus,S.hotsoni, S.indicus, S.tetradactylus, S.williamsi)in light of their revised taxonomy.Results showed no significant sexual size or shape dimorphism.Species significantly differed in cranial size and shape both overall and as species pairs.Species identity had a strong effect on both cranial size and shape.Only a small part of cranial shape variation was allometric,with no evidence of unique species allometries, and most specimens fit closely to the common allometric regression vector.Allactaga was the largest,followed by Orientallactaga, Scarturus, and finally Pygeretmus.Principal component 1 (PC1) separated O.bullata+O.balikunica+S.hotsoni (with inflated bullae along with reduced zygomatic arches and rostra) from A.major+A.severtzovi+O.sibirica (with converse patterns), while PC2 differentiated Orientallactaga (with enlarged cranial bases and rostra along with reduced zygomatic arches and foramina magna) from Scarturus+Pygeretmus (with the opposite patterns).Clustering based on the unweighted pair group method with arithmetic mean(UPGMA) contained the four genera, but S.hotsoni clustered with O.bullata+O.balikunica and O.sibirica clustered with A.major+A.severtzovi, likely due to convergence and allometry, respectively.
Keywords: Allactaga; Cranial morphometrics;Five-toed jerboas; Orientallactaga; Pygeretmus;Scarturus
INTRODUCTION
Allactaginae Vinogradov, 1925 is a subfamily of four- and fivetoed jerboas and is currently divided into five genera(represented by at least 16 species):AllactagaF.Cuvier,1836,AllactodipusKolesnikov, 1937,OrientallactagaShenbrot, 1984,PygeretmusGloger, 1841, andScarturusGloger, 1841 (Michaux & Shenbrot, 2017).Allactagines are arid adapted.They use their chisel-shaped incisors, sharpclawed forelegs, and well-developed nasal disk to dig burrows,which they inhabit during the day but leave at night to forage for seeds, vegetation, roots, and insects with the aid of their large eyes and ears and habitat-matching pelage color (likely acting as camouflage) (Lebedev et al., 2013; Miljutin, 2008;Michaux & Shenbrot, 2017; Nowak & Paradiso, 1983;Shenbrot et al., 1999, 2008).
Allactagines and other jerboas (i.e., three-toed, pygmy, and long-eared jerboas) are members of the family DipodidaeFischer de Waldheim, 1817, and are specialized for bipedal hopping (Michaux & Shenbrot, 2017).Although this gait originated in humid, forested environments, it is now a hallmark adaptation to arid, open environments as all modern jerboas and most other bipedal rodents occur in such regions(Alhajeri, 2016; Berman, 1985; Lebedev et al., 2013; Mares,1975; Nowak & Paradiso, 1983; Wu et al., 2014).Jerboas achieve bipedalism through hindlimb elongation and associated modification in muscular morphology, central foot bone fusion (commonly) forming a strong “cannon bone”,lateral digit reduction (or loss), tail lengthening (for balance),and pelvis expansion (to support enlarged hindlimbs)(Lebedev et al., 2013; Michaux & Shenbrot, 2017; Miljutin,2008; Moore et al., 2015; Nowak & Paradiso, 1983; Shenbrot et al., 1999, 2008; Wu et al., 2014).
Allactagines are among the most specialized dipodids for bipedality, with associated skeletomuscular modifications such as unfused cervical vertebrae and highly modified hindlimbs and pelvises (Allen, 1940; Holden & Musser, 2005; Lebedev et al., 2013).The degree of hindlimb specialization is one of the main criteria for dipodid taxonomy and morphological phylogenetics, in addition to the morphology of teeth (e.g.,molar coronal structure), skulls (particularly auditory bullae),skeletons (e.g., cervical vertebrae), and male reproductive system (glans penis and accessory glands) (see Nowak &Paradiso, 1983 and references therein).Recent molecular phylogenies support the monophyly of Dipodidae as a family,as well as the monophyly of its constituent subfamilies(Lebedev et al., 2013; Moore et al., 2015; Pisano et al., 2015;Upham et al., 2019; Wu et al., 2012; Zhang et al., 2013).Molecular phylogenetic studies have also greatly improved our understanding of the relationships among allactagine species(Figure 1 and references therein) and contributed to the recent large-scale revision of the group’s taxonomy (see Michaux &Shenbrot, 2017).
Traditionally, certain allactagines are easy to recognize,e.g.,Pygeretmus, which usually lacks premolars and has simple-patterned enamel, shorter ears, and fatter tails; others are differentiated based on less obvious differences such as fur color, body size, skull measurements, and glans penis spines (Allen, 1940; Kryštufek et al., 2013; Miljutin, 2008;Nowak & Paradiso, 1983; Shenbrot, 2009).This interspecific variation, particularly in morphological measurements, is a much-studied topic, particularly in the Iranian allactagines(e.g., Darvish et al., 2008; Dianat et al., 2010; Lebedev et al.,2013; Miljutin, 2008; Shenbrot, 2009; Tarahomi et al., 2010).In the present study, I sampled allactagine species throughout their extensive range from Libya to China (Figure 2) to assess interspecific cranial variation.Geometric morphometrics were used to compute and visualize size-independent shape variation (see Bookstein, 1986; Goodall, 1991), with the usefulness of this technique for allactagine species identification also investigated.
MATERIALS AND METHODS
Taxonomic sampling
The crania of vouchered specimens used in this study are housed in the American Museum of Natural History (AMNH;New York City), Field Museum of Natural History (FMNH;Chicago), Museum of Vertebrate Zoology (MVZ; University of California, Berkeley), and United States National Museum ofNatural History (USNM; Washington, DC) (Appendix I;Supplementary Data S1).The samples excluded juveniles with incompletely erupted third mandibular molars (see Auffray et al., 2011; Shenbrot et al., 2008).Damaged specimens were also omitted to ensure shape estimate reliability (see below).All allactagine species available in these museums (n=14)were sampled:Allactaga majorKerr, 1792 (n=6),A.severtzoviVinogradov, 1925 (n=3),Orientallactaga balikunicaHsia and Fang, 1964 (n=3),O.bullataAllen, 1925 (n=26),O.sibiricaForster, 1778 (n=36),Pygeretmus platyurusLichtenstein,1823 (n=1),P.pumilioKerr, 1792 (n=9),P.shitkoviKuznetsov, 1930 (n=2),Scarturus aralychensisSatunin, 1901(n=5),S.euphraticusThomas, 1881 (n=6),S.hotsoniThomas, 1920 (n=25),S.indicusGray, 1842 (n=32),S.tetradactylusLichtenstein, 1823 (n=40), andS.williamsiThomas, 1897 (n=25), totaling 219 specimens (Appendix I;Supplementary Data S1).Subspecific epithets were not considered in this study.

Figure 1 Allactagine relationships based on several molecular phylogenies published in the last decade (Dianat et al., 2013; Hamidi et al.,2016; Lebedev et al., 2013; Moore et al., 2015; Pisano et al., 2015; Upham et al., 2019; Wu et al., 2012; Zhang et al., 2013)

Figure 2 Map of localities sampled in this study
The taxonomy of the specimens used by the museum databases was primarily based on Holden & Musser (2005).In the current study, I updated this taxonomy (particularly genera) using Michaux & Shenbrot (2017).This reference was also used to re-identify several sampled specimens,particularlyScarturuselaterLichtenstein, 1825, as follows:S.elatersampled from Afghanistan and Pakistan was reidentified asS.indicus, while those sampled from central Iran(all otherS.elaterspecimens) were re-identified asS.aralychensis.Recently, Bannikova et al.(2019) found evidence for several cryptic species within theS.elaterspecies complex, and thus theS.indicusandS.aralychensisspecimens identified in this study based on Michaux &Shenbrot (2017) may include other cryptic species.All sampledO.sibiricaspecimens were from localities that conformed to the “Sibirica” phylogenetic group of Cheng et al.(2020).
Other changes included re-identifying theO.bullataspecimen (AMNH 46 403) from Ulaanbaatar in Mongolia,which lacks the characteristic hyperinflated tympanic bulla of this species, asO.sibirica.TheO.s.annulataspecimen(AMNH 58 832) with a hyperinflated tympanic bulla was reidentified asO.bullata.Finally, theA.majorspecimen from Turkmenistan (USNM 1 445) was re-identified asA.severtzovi, as the former does not inhabit this country according to Michaux & Shenbrot (2017).TwoS.firouzispecimens from FMNH (112 349 and 112 351) were included asS.hotsoni(Dianat et al., 2010, 2013; Shenbrot, 2009).All other synonymous names were standardized following Michaux & Shenbrot (2017).All revisions to species/genus names (including the original identifications provided by the museums) are listed in the Supplementary Data S1.
Specimens were assigned geographic coordinate values based on museum database locality information: AMNH (sciweb-001.amnh.org/db/emuwebamnh), FMNH (collectionszoology.fieldmuseum.org), MVZ (arctos.database.museum/mvz_mamm), and USNM (collections.nmnh.si.edu/search/mammals) (Supplementary Data S1).Several specimens were close to or over a century old and lacked precise locality information and/or geographic coordinates and were thus assigned latitudes and longitudes based on the most precise localities listed in the museum databases using the distancemeasuring tool in Google Maps (Google, 2020), as described in Alhajeri (2019).Geographic coordinates were obtained in decimal degrees to the fourth decimal place (precision of~11 m at the equator).The locality of a single specimen (A.major, AMNH 227) was unknown.
Geometric morphometric analysis
All analyses and visualizations used R libraries (R Core Team,2020).For all analyses, the significance level (P-value) was set atα=0.05 and evaluated with permutations (with a random starting seed).Table legends note the specimens missing from each analysis.
For each specimen, the ventral cranial view (see Discussion) was photographed using a Nikon AF-S DX Micro NIKKOR 40 mm f/2.8G lens attached to a D3200 DSLR Nikon F-mount camera (Nikon, Tokyo, Japan) mounted on a copy stand.Specimens were illuminated using a ring light and external light sources, and photographs were captured at 24 megapixels with a resolution of 6,016×4,000 in JPEG format.The standardized photography protocol is described elsewhere (Alhajeri & Steppan, 2018a; Alhajeri, 2019) and ensured that the photographic plane was parallel to the frontal plane of the cranium.Photographs included 1 mm graph paper to convert pixels into millimeters and estimate centroid size (see below).
Thirty-two landmarks were digitized on the left side of each cranium, except when it was damaged; in these instances, the photograph was reflected, prior to digitizing the right side.The chosen landmarks are common in mammals and found in most rodents (Alhajeri & Steppan, 2018b), but also included allactagine-specific landmarks and evenly covered most of the ventral cranial view (Figure 3; Supplementary Table S1).Landmarks were digitized in ImageJ (Schneider et al., 2012)resulting in raw coordinate files, which were converted into tps format (Rohlf, 2015) using base R functions.These files were combined using the readmulti.tps() function in thegeomorphlibrary (Adams et al., 2020).ImageJ coordinates appear upside down ingeomorphplots, and thus were flipped along the y-axis using thegeomorphfunction rotate.coords(type=“flipY”).
Twenty-seven out of the 219 specimens were missing at least one landmark (12.3%), and a total of 52 landmarks were missing from the entire dataset (0.7%).The positions of these landmarks were imputed using thin-plate spline (TPS; Gunz et al., 2009) with the estimate.missing() function ingeomorph.The references for missing landmarks from incomplete specimens were interpolated from complete specimens and carried out separately for each species.Specimens were then aligned using generalized Procrustes analysis (GPA) (Rohlf &Slice, 1990), a process of rescaling, translation, and rotation.The Procrustes-aligned specimens were projected onto tangent space using thegeomorphfunction gpagen(Proj=T).This resulted in a three-dimensional array of Procrustes shape coordinates and a vector of centroid sizes—the square root of summed variances of each landmark around the centroid(Rohlf & Slice, 1990)—which were combined after converting the former into a two-dimensional matrix using thegeomorphfunction two.d.array().The resulting matrix was used in all analyses, as shown in Supplementary Data S1.

Figure 3 Digitized landmarks on ventral cranial view of a small five-toed jerboa (S. indicus; FMNH 103 883) from Herāt,Afghanistan (Landmarks are described in Supplementary Table S1)
Morphometric data quality (e.g., absence of digitization errors) was ensured by thegeomorphfunction plotOutliers() to detect and scrutinize outliers (with Procrustes distances above the upper quartile of species mean shape), which were then re-digitized or dropped (final 219 specimen dataset contained no outliers).In most instances, the dropped outlier specimens contained several missing landmarks that were imputed using TPS (see above).Centroid sizes were (natural) logtransformed and used as measures of cranial size, while Procrustes shape coordinates were the proxies of cranial shape.
Statistical analyses
The effect of sex on cranial size and shape and its interaction with species identity was tested by evaluating the fit of the models using the randomized residual permutation procedure(RRPP) via the lm.rrpp() function in theRRPPlibrary (Collyer& Adams, 2018, 2020).These preliminary models found no significant sexual dimorphism in size or shape (see Results)—males, females, and those of unknown sex were combined in the final models.In these final models, RRPP was used to test the effects of: (1) species identity on cranial size (while not considering sex), and (2) cranial size, species identity, and their interaction on cranial shape (while not considering sex).All RRPP models were fit using ordinary least squares (OLS), and significance testing was based on 999 iterations of residual randomization, with type-II(hierarchical) sum of squares and cross-product computations used for multifactorial models.Analysis of variance (ANOVA)tables were computed for each model using anova.lm.rrpp()based on random statistical distributions for each model, with theFdistribution as the basis for effect size calculation.
For cranial size, pairwise comparisons were conducted for the only significant factor, species identity (see Results), using theRRPPfunction pairwise().For cranial shape, pairwise comparisons were conducted for species means, includingand excluding cranial size as a covariate (if included it compared the least squares means of species, i.e., performed a correction for common allometry).TheRRPPfunction summary.pairwise() was then used to compute the associated statistics, including distances among species pairs, effect sizes,P-values, and one-tailed 95% confidence limits, based on distances between means (Collyer & Adams, 2020).Differences in cranial size between species were visualized using boxplots.
Thegeomorphfunction gm.prcomp() was used for principal component analysis (PCA) of Procrustes shape variables to determine the main axes of shape variation.The first two PCs were visualized as scatterplots (with points color-coded by genera and species identity designated with different symbols)using the plot.gm.prcomp() function of the same library.Cranial shapes at PC axis extremes were visualized ingeomorphby plotting their differences from the mean shape of the entire sample —estimated using the function mshape()—using TPS deformation grids generated via the function plotRefToTarget(); to aid visualization, the define.links() function was used to define links between landmarks, and deformations were magnified two-fold to exaggerate differences.
Comparable species-mean shapes were obtained ingeomorphby subsetting the dataset by species, obtaining means using mshape(), and realigning resulting means via GPA using gpagen().Species-mean shapes were depicted as TPS deformations compared to the mean shape of all 14 species means (thus giving equal weight to each species,regardless of sample size); grids were magnified two-fold to make shape differences more apparent.GPA also output a Procrustes distance matrix, which was summarized in a dendrogram based on UPGMA (unweighted pair group method with arithmetic mean) clustering implemented in the base R function hclust(method=“average”).
BecauseRRPPanalysis found shape allometry, but no evidence that it differed among species (i.e., insignificant interaction between size and species identity, see Results),shape-size covariation was visualized using a simple(common) allometry scatterplot.This plot was based on the common allometric component (CAC; Mitteroecker et al.,2004) implemented using the function plotAllometry(method=“CAC”) ingeomorph, which uses two-block partial least squares (PLS; Rohlf & Corti, 2000) to estimate the major axis of covariation between size and shape (i.e., CAC).Allometric shape changes were visualized using TPS deformation grids of minimum and maximum CAC scores(relative to the mean shape of the entire sample), using the same process outlined for PCA.Deformations were magnified four-fold to make shape differences more visible.The configurations of the shape coordinates at the CAC and PCA extremes were determined using thegeomorphfunction shape.predictor().
RESULTS
Of the 219 specimens, 112 were females, 100 were males,and seven were of unknown sex—similar frequencies of males and females were sampled for most species (Supplementary Data S1).Specimens came from 11 countries, including Mongolia (n=43), Afghanistan (n=37), Egypt (n=37), Iran(n=33), China (n=19), Turkey (n=17), Kazakhstan (n=10),Pakistan (n=10), Russia (n=6), Libya (n=3), Turkmenistan(n=3), and a single specimen of unknown origin(Supplementary Data S1).A total of 103 localities were sampled (Figure 2; Supplementary Data S1).
Preliminary models found no significant sexual dimorphism in size or shape (effects of sex and its interaction with species identity were non-significant) (allP>0.05; Supplementary Table S2).The final cranial size model found significant and large differences among species (P=0.001;Z=10.658), with species identity explaining 87.5% of the variation in cranial size (R2=0.875; Table 1A).The boxplot showed someclustering among genera relative to their size, with both members of the genusAllactagabeing the largest, followed(mostly) byOrientallactaga, thenScarturus, and finallyPygeretmus(Figure 4).Post-hocpairwise comparisons (which excludedP.platyurus, see Table 2 legend notes) found significant differences in cranial size between almost all species pairs, with most insignificant pairs belonging to the same genus (Table 2A).

Table 1 ANOVA table for linear model of effect of species identity (‘Species’) on logged cranial size (A) and logged cranial size (‘Size’),species identity, and their interaction on cranial shape (Procrustes shape coordinates) (B)
The final cranial shape model also found significant and large differences between the species (P=0.001;Z=16.966),with species identity explaining 45.9% of the variation in cranial shape (R2=0.459; Table 1B).Cranial shape was also significantly predicted by its size (P=0.001;Z=5.419), with size explaining only 1.2% of the variation in cranial shape(R2=0.012)—size did not interact with species identity(P>0.05; Table 1B), indicating a common allometric pattern across species.Post-hocpairwise comparisons found significant differences in cranial shape between most species pairs (Table 2B), even after size correction (Table 2C).
Genera and species clearly differed in the first two PC axes,which accounted for 50.1% of cranial shape variation(Figure 5).PC1 distinguished mostO.bullata+O.balikunica+S.hotsonispecimens with low scores from mostAllactaga(A.major+A.severtzovi)+O.sibiricaspecimens with high scores—most other species had intermediate PC1 scores(Figure 5).MostPygeretmusspecimens had positive, but intermediate PC1 scores (Figure 5).According to the TPSgrids, the former group (PC1 min) was characterized by wider cranial bases, and especially anteriorly inflated bullae, and a reduced facial region, particularly a less flared (and anteriorly placed) zygomatic arch, a smaller and shorter rostrum, and a somewhat larger molar row.Converse patterns were observed in the latter group (PC1 max) (Figure 5).PC2 differentiated mostOrientallactagaspecimens (PC2 max), with caudolaterally expanded cranial bases (and in the case ofO.bullataextremely inflated bullae), less flared zygomatic arches, reduced foramina magna, and enlarged rostra, from mostScarturus+Pygeretmusspecimens (PC2 min), which showed the opposite patterns (Figure 5).Comparisons of species-mean shapes (Figure 6) agreed with the PCA(Figure 5).The UPGMA clusters were mostly consistent with the four genera; except for convergence ofS.hotsonito theO.bullata+O.balikunicacluster, and convergence ofO.sibiricato theAllactaga(A.major+A.severtzovi) cluster (Figure 6).
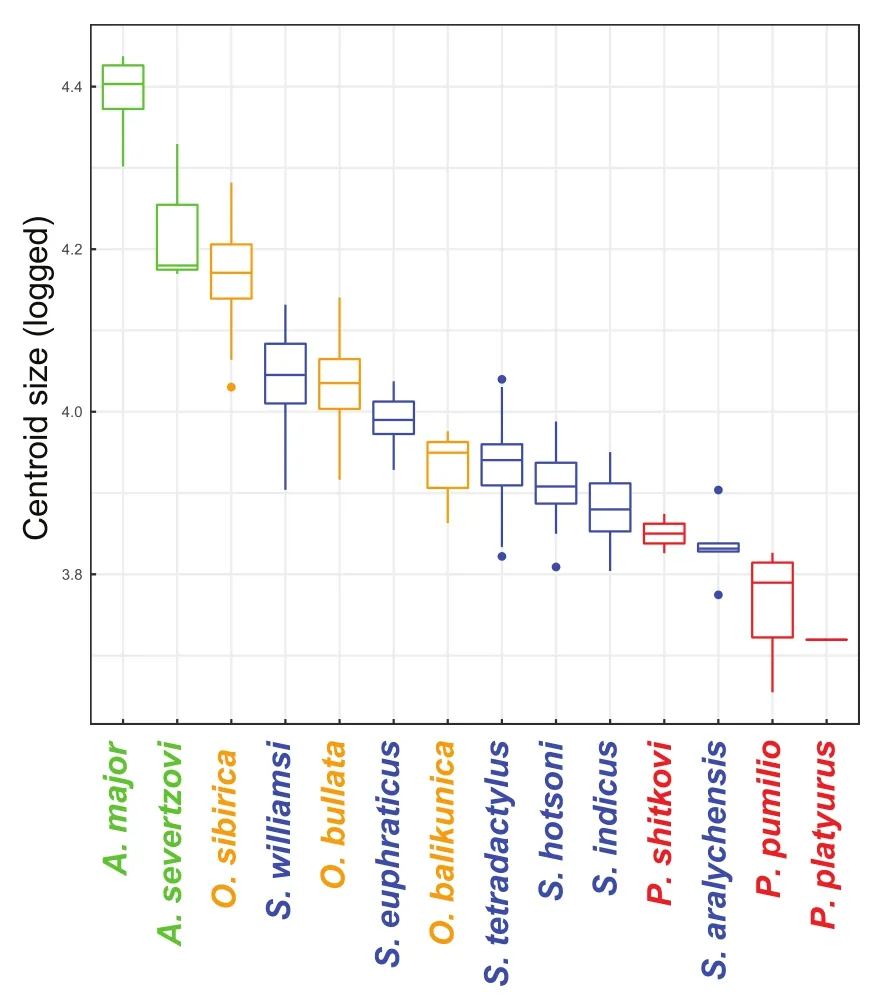
Figure 4 Boxplot of recorded cranial sizes

Table 2 Pairwise distances between species means and associated statistics based on logged centroid size (A), Procrustes shape coordinates (B), and size-corrected Procrustes shape coordinates (least squares means with logged centroid size as a covariate and no interaction) (C)

Continued

Continued

Figure 5 Scatterplot of Procrustes shape coordinates based on PCA of 219 specimens
Except for a few specimens ofPygeretmus+Allactaga, most specimens fit closely to the common allometric regression vector in the CAC plot (Figure 7).Small crania (CAC min) had anteriorly inflated bullae, larger foramina magna, shorter snouts, wider zygomatic arches+molars+incisive foramina,and rostrocaudally compressed crania, with large crania (CAC max) primarily showing the reverse patterns (Figure 7).
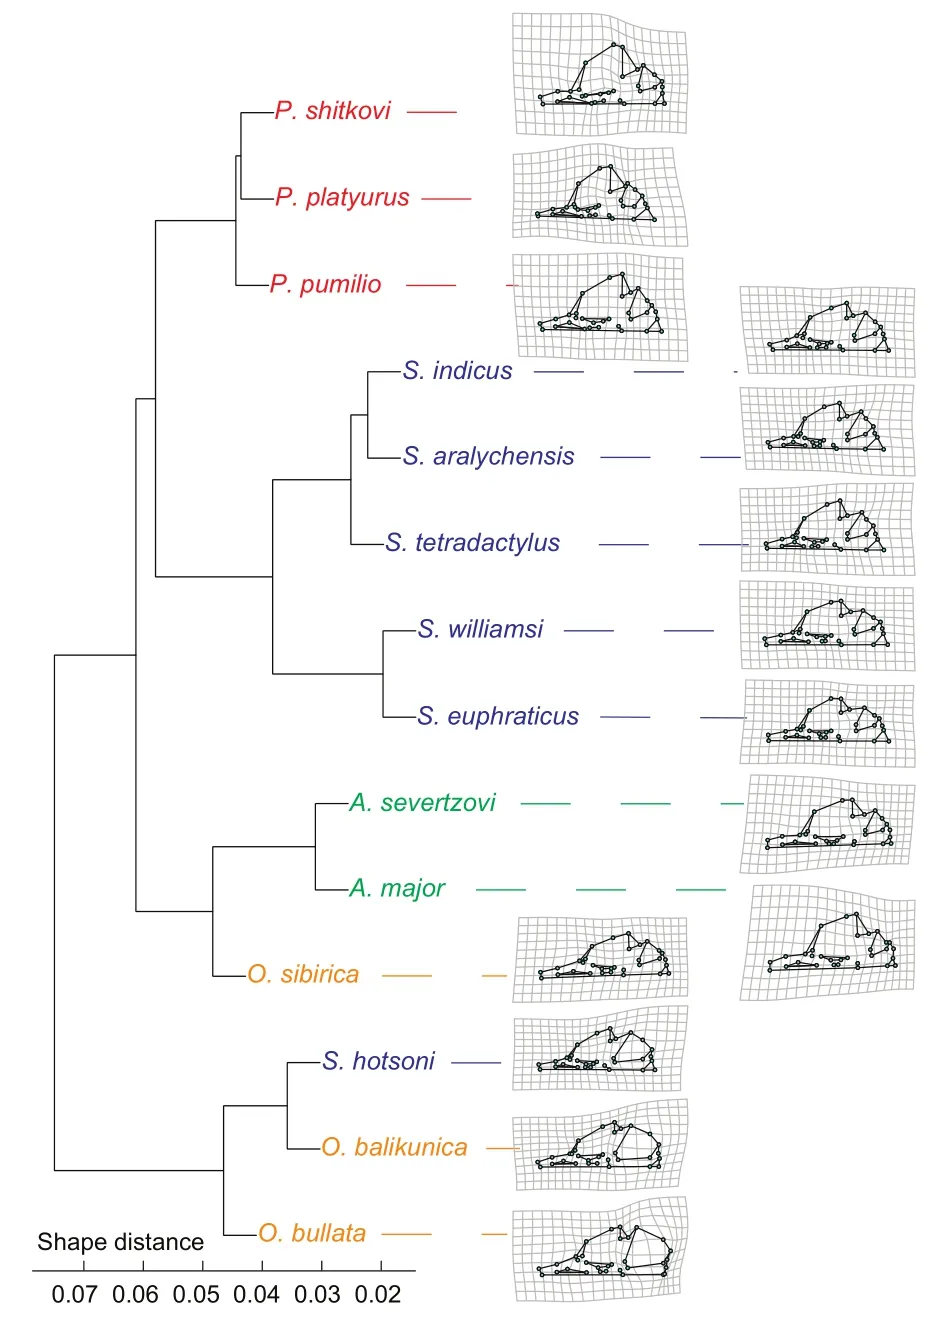
Figure 6 UPGMA dendrogram showing similarity in species-mean shapes (based on Procrustes shape coordinates) along with associated TPS deformation grid for each species (compared to average of all 14 species-mean shapes)
DISCUSSION
I found that allactagine species differed in cranial size(Figure 4) and shape (Figures 5, 6; Tables 1, 2).This is in agreement with recent geometric morphometric analysis of Iranian allactagines by Tarahomi et al.(2010), despite that earlier study examining the dorsal cranial view.The differences in the ventral cranial view in the present study are particularly noteworthy, considering the presence of ecologically pertinent components such as teeth and tympanic bullae, also traditionally used for rodent species delineation.Allactagines are commonly delineated based on hindlimbs,crania, teeth, skeletons, glans penis spines, fur color, body size, and/or similar traits (Allen, 1940; Kryštufek et al., 2013;Nowak & Paradiso, 1983; Shenbrot, 2009).This study showed that allactagine species can also be differentiated using ventral cranial geometric morphometrics, bolstering evidence that this technique contains sufficient resolution for species identification and for elucidating interspecific differences,particularly in rodents (Alhajeri, 2018; Beolchini & Corti, 2004;Boroni et al., 2017; Colangelo et al., 2010; Fadda & Corti,2001; Tabatabaei Yazdi & Adriaens, 2013; Tarahomi et al.,2010; Zelditch et al., 2012).
Despite finding significant differences in cranial size among species overall (Table 1A) and between most species pairs(Table 2A), Figure 4 shows a highly continuous pattern of size variation among species, with some clustering among genera.This indicates that cranial size may have sufficient resolution to distinguish allactagine genera, but not species.Some size variation may be associated with latitude, and thus could be explained by Bergmann’s rule (1847).For example, the largest sampled speciesA.major(Figure 4) also had the northernmost range (Figure 2); similarly, the relatively largesizedOrientallactagaspecies also inhabited northern latitudes.
On the other hand, cranial shape seems to better distinguish both genera and species (Figures 5, 6; Tables 1A,2B, 2C).While some shape variation does seem to be driven by size (Figure 7), the low effect size of this factor relative to species identity (comparingR2andZvalues in Table 1B)seems to indicate that allometry plays a relatively minor role in interspecific shape differences at the taxonomic scale of the Allactaginae subfamily.While both PCA and UPGMA analyses found large-scale clustering among congeners, interspecific differentiation (in PCA) was less obvious for some species(see below) (Figures 5, 6).
Based on UPGMA of the mean shapes of species, allPygeretmusspecies were clustered together (as also reflected in the PCA plot), which is expected considering the distinctive crania of this genus, e.g., relatively extreme zygomatic flaring(Figures 5, 6).The uniqueness ofPygeretmusamong allactagines extends to other skull characters (e.g., lacking premolars) and non-skull characters (e.g., fat tail), which is why it was considered as a distinct allactagine by early taxonomists.The most morphologically close genus toPygeretmuswasScarturus(five of the six congeners clustered together).These two genera seem to cluster together due to shared cranial features, such as reduced cranial bases and rostra along with enlarged zygomatic arches and foramen magna (Figures 5, 6).
Within theScarturuscluster (excludingS.hotsoni), there was substantial overlap among the species in morphospace(Figures 5, 6).This is in accordance with recent evidence of the presence of cryptic species in this genus, particularly within theS.elaterspecies complex (see Bannikova et al.,2019).Interestingly,S.indicusandS.aralychensis, which were originally considered as subspecies ofS.elater(see Michaux & Shenbrot, 2017), were clustered together(Figure 6) within this group and showed considerable overlap in morphospace (Figure 5).The close association betweenS.williamsiandS.euphraticuswithin theScarturuscluster(Figure 6) and their overlap in morphospace (Figure 5) may reflect their close phylogenetic relationship (Figure 1; also see Michaux & Shenbrot, 2017).
The remaining species were divided into two clusters: (1)A.major+A.severtzovi+O.sibiricaand (2)O.bullata+O.balikunica+S.hotsoni(Figure 6).For PCA, these two clusters were most differentiated along PC1, with the former cluster having more deflated bullae and more enlarged zygomatic arches and rostra (Figure 5).In the first group, the clustering ofO.sibiricawithA.major+A.severtzovi(rather than with its congeners) (Figures 5, 6) could be driven partly by allometry,as these three species were the largest among the sampled allactagine species (Figures 4), and increased size according to CAC analysis was mostly associated with reduced bullae and foramina magna as well as enlarged rostra (Figure 7).Within this cluster,A.majorgreatly differed from the rest (and was also among the most distinct of all sampled allactagines),which could partly be explained by its much larger size compared with other species (Figure 4) and because it diverged somewhat from the common allometric regression vector (Figure 7).

Figure 7 Scatterplot of shape-size covariation of 219 specimens
TheO.bullata+O.balikunica+S.hotsonicluster was the most distinct among all sampled allactagines.Furthermore, it clustered away from all other species (Figure 6) and occupied a largely different region in PCA morphospace (Figure 5).This cluster was mainly characterized by extremely inflated bullae(especially for the case ofO.bullata+O.balikunica); however,there was a gradual increase in the relative size of both the bullae and rostra in the following order:S.hotsoni-O.balikunica-O.bullata(Figure 6), which may partly be driven by allometry as it was associated with species size (Figures 4,7).The clustering ofS.hotsoniwithO.bullata+O.balikunica(rather than with its congeners) (Figures 5, 6) may partly be driven by convergent adaptations to similar habitats, which for these three species include rocky-gravel deserts (see Michaux& Shenbrot, 2017).The bulla inflation in this cluster of species is a hallmark of desert adaptation in mammals, particularly rodents (Alhajeri et al., 2015; Alhajeri & Steppan, 2018c; Lay,1972; Webster & Webster, 1975).Interestingly, this cluster of rodents also shared other adaptations, including densely furred soles (characteristic ofOrientallactaga, but also shared by other allactagines) (see Michaux & Shenbrot, 2017), which is presumably a convergent adaptation to life in flat sandygravel deserts.Among all sampled species,O.bullatahad the most distinctive cranium (i.e., greatly separated from other species in PC morphospace), which was primarily driven by its greatly inflated tympanic bullae (Figure 5).
Overall, the cranial variation identified here (Figures 5, 6)accords with earlier studies (e.g., Allen, 1940; Michaux &Shenbrot, 2017; Miljutin, 2008).Rodent crania are highly adaptable and readily evolve in response to selective pressure, such as diet (Martin et al., 2016).This is especially the case for allactagines, with species showing elaborate cranial specializations for traits such as digging (e.g.,developed nasal disk and proodont incisors) and mastication(associated with zygomatic breadth and molar row length)(Miljutin, 2008).The cranial differences across allactagines likely reflect phylogenetic history (i.e., phylogenetic conservatism), adaptation (e.g., to local climate, diet, habitat),and random genetic drift.As close relatives usually also share adaptations (i.e., phylogenetic niche conservatism), which explains the strong congeneric clustering detected in this study (Figures 5, 6), cranial morphology likely manifests as an interplay of several of these factors.
CONCLUSIONS
The taxonomy of the subfamily Allactagine has been revised extensively in recent years with the aid of molecular phylogenetics.This study sampled 14 allactagine species and found significant differences in their cranial size and shape,indicating that geometric morphometrics may have sufficient resolution for allactagine species identification.Mostcongeners clustered together, reflecting phylogenetic conservatism in cranial shape.The two exceptions (S.hotsoniclustering withO.bullata+O.balikunicaandO.sibiricaclustering withA.major+A.severtzovi) were likely influenced by convergent cranial adaptations and allometry, respectively.Cranial variation may also be explained by other factors, such as random genetic drift.
SUPPEMENTARY DATA
Supplementary data to this article can be found online.
COMPETING INTERESTS
The author declares that he has no competing interests.
AUTHOR’S CONTRIBUTIONS
B.H.A.conceived and designed this study.B.H.A.analyzed the data and wrote the manuscript.The author read and approved the final version of the manuscript.
ACKNOWLEDGEMENTS
I thank the museum curators, collection managers, and staff for providing access to their collections and assistance on multiple visits: AMNH (Ms.Marisa Surovy, Ms.Eleanor Hoeger, Ms.Eileen Westwig); FMNH (Dr.Bruce Patterson, Dr.Lawrence Heaney, Dr.Adam Ferguson, Mr.John Phelps, Mr.William Stanley, Ms.Lauren Smith); MVZ (Dr.Christopher Conroy, Dr.James Patton, Dr.Eileen Lacey); and USNM (Mr.Darrin Lunde and Dr.Michael Carleton).I also thank Dr.Miriam Zelditch for discussions on R code and analyses.The manuscript benefitted from comments by Dr.Julien Claude and five anonymous reviewers.Some travel expenses were covered by Kuwait University (2019-2020 scientific leave).
APPENDIX I
List of examined specimens (n=219).See Materials and Methods for museum abbreviations.
Allactaga major(n=6): AMNH 176268, 178795, 227; FMNH 92944; USNM 251639, 254957
Allactaga severtzovi(n=3): AMNH 176269, 206589; USNM 1445
Orientallactaga balikunica(n=3): AMNH 256509, 256510; FMNH 123651
Orientallactaga bullata(n=26): AMNH 256507, 256508, 58522, 58618, 58732, 58735, 58741, 58744, 58773, 58776, 58777,58827, 58830, 58832, 58833, 84166, 84167, 84168, 84172, 84177, 84184, 84188, 84192, 84202, 84214, 84216
Orientallactaga sibirica(n=36): AMNH 176270, 178796, 256511, 256512, 46403; FMNH 25628, 25629, 25630, 25631, 25634,25635, 25637, 25638, 25640, 25641, 25643, 25645, 25646, 25647, 30315, 43410; USNM 155182, 155184, 155189, 155190,155192, 155194, 175493, 176279, 176280, 240763, 259525, 259526, 270615, 544448, 587308
Pygeretmus platyurus(n=1): USNM 547939
Pygeretmus pumilio(n=9): AMNH 176266, 85331, 85332, 85333, 98133; FMNH 97742, 97744, 97750, 97752
Pygeretmus shitkovi(n=2): AMNH 174330, 176264
Scarturus aralychensis(n=5): AMNH 88749; MVZ 192029; USNM 341604, 369889, 369890
Scarturus euphraticus(n=6): FMNH 103899, 103900, 103902, 103903, 103904; USNM 599473
Scarturus hotsoni(n=25): FMNH 103893, 103894, 103895, 103898, 112349, 112351; MVZ 192030, 192031, 192033, 192034;USNM 327056, 327058, 327059, 327060, 327062, 327063, 327064, 350759, 350761, 369527, 369528, 369529, 369530, 369531,369532
Scarturus indicus(n=32): FMNH 103835, 103836, 103839, 103840, 103841, 103842, 103843, 103864, 103865, 103866,103867, 103868, 103869, 103870, 103871, 103876, 103877, 103879, 103880, 103881, 103882, 103883, 103884, 103885,103886, 103887, 103888, 103889; USNM 354410, 411172, 411173, 411174
Scarturus tetradactylus(n=40): FMNH 100937, 100940, 100941, 100942, 100943, 100954, 100955, 100956, 68273, 68277,74811, 74814, 78616, 80005, 82304, 82307, 82308, 84156, 84157, 84158, 93781, 96232; USNM 300289, 300290, 300291,302293, 302294, 302295, 317084, 317085, 317086, 317087, 317088, 317089, 317090, 317091, 317092, 317093, 317094,342055
Scarturus williamsi(n=25): FMNH 112343, 112344, 112346, 112355, 112356, 82167, 82169, 82170, 82174, 82177, 82178,82180, 82181, 82182, 82183, 82184, 82186, 97738, 97739; USNM 327719, 327720, 327721, 327722, 327723, 354842
杂志排行

Zoological Research的其它文章
- A new species of Kurixalus (Anura, Rhacophoridae)from Guizhou, China
- Long-term trends in a forest ungulate community: park establishment increases numbers, but poaching is a constant threat
- Molecular phylogeny of the genus Muntiacus with special emphasis on the phylogenetic position of Muntiacus gongshanensis
- Parasitism is always costly to the host
- Flexible breeding performance under unstable climatic conditions in a tropical passerine in Southwest China
- Yunnanilus chuanheensis, a new loach species(Cypriniformes: Nemacheilidae) from the upper Lixianjiang River in Yunnan, China