The river chief system and agricultural non-point source water pollution control in China
2021-04-12ZHOULiLILingzhiHUANGJikun
ZHOU Li,LI Ling-zhi,HUANG Ji-kun
1 College of Economics and Management,Nanjing Agricultural University,Nanjing 210095,P.R.China
2 China Center for Agricultural Policy,School of Advanced Agricultural Sciences,Peking University,Beijing 100871,P.R.China
3 Jiangxi Agricultural University,Nanchang 330045,P.R.China
Abstract As part of their efforts to control water pollution,local governments in China introduced the river chief system,whereby a named individual undertakes responsibility for protecting a specified waterway.As one of the most prominent sources of water pollution,agricultural non-point-source (NPS) pollution is becoming increasingly serious.Determining whether the river chief system,an institutional reform in China’s decentralized environmental regulation regime,is effective in alleviating NPS pollution is important for the realization of green development.The effect of the river chief system on reducing agricultural NPS pollution is explored in this study using panel data from 308 Chinese counties during the period from 2004 to 2015.The results reveal that the negative impact of manure output from animal breeding operations on surface water quality is reduced with the implementation of the river chief system.However,the river chief system is ineffective in dealing with the water pollution caused by fertilizer use.Furthermore,in the current system,cooperation among river chiefs only occurs within a province.Local governments should increase their efforts in reducing fertilizer source loads and preventing fertilizer loads from entering surface waters.In addition,the central government should improve cooperation among the river chiefs in upstream and downstream provinces.
Keywords:river chief system,agricultural non-point-source pollution,surface water quality,fertilizer use,livestock and poultry breeding
1.Introduction
To protect water resources and improve the water environment,China’s central government proposed the comprehensive implementation of the river chief system at the end of 2016.Under this policy,government leaders serve as river chiefs who are responsible for organizing and leading the management and protection of a specific river course within their jurisdiction.Water quality results are linked with the river chiefs’ chances of promotion.While it is one of the most important institutional reforms in recent years,the river chief system was first implemented in 2007 by the local government of Wuxi City,Jiangsu Province,China.At the end of 2016,the central government issuedComments on the Full Implementation of the River Chief Systemwhich stated that the river chief system should be established nationwide by the end of 2018.That target was realized early,in June 2018,which means every river in China now has a river chief,and the protection of the water environment has entered into a new stage.By the end of July 2018,over 300 000 river chiefs had been designated at the provincial,city,county,and township levels,in addition to the more than 760 000 village-level river chiefs who have also been appointed.
Despite this widespread implementation,only a few studies have focused on the effects of the river chief system,with current research oriented toward qualitative analysis.In terms of empirical analysis,as far as the authors know,only Shen and Jin (2018),Sheet al.(2019),and Liet al.(2020) have sought to identify the policy effects of the river chief system based on water pollution data at the national monitoring points and those authors manually compiled data on the evolution of the river chief system.In addition,all three studies used the double difference method.Shen and Jin (2018) found that the river chief system alleviated the problem of water blackening and achieved preliminary control of water pollution.However,the system failed to significantly reduce the main water pollutants of chemical oxygen demand (COD) and ammonia nitrogen,indicating that local governments did not address the root causes of pollution,a conclusion supported by Liet al.(2020).In contrast,Sheet al.(2019) found that the river chief system substantially improved water quality and identified the possible reasons for the river chief system’s efficacy as industrial structure upgrades and stringent control of industrial waste discharge.
As one of the most prominent sources of water pollution,agricultural non-point-source (NPS) pollution has become increasingly serious (Abler 2015;Zhanget al.2015).According toChina’s Environmental Statistics Yearbook(MEEC 2015),agriculture is the largest source of COD and the second largest source of ammonia nitrogen in China’s waters.Fig.1 shows the discharge amounts of COD and ammonia nitrogen from different sources during the 2011–2015 period.It is clear that agricultural pollution has already overtaken the contamination from industries.Agricultural pressure on water quality mainly comes from the cropping and livestock systems.The 2010China Pollution Source Census(NBSC 2010) reported that in 2007,the total nitrogen loss from crop farming was 15.978 million tons,and the COD and nitrogen emissions from raising livestock and poultry were 12.683 and 1.024 million tons,respectively.In crop production,water pollution from nutrients occurs when fertilizers are overused.Nutrientrich animal waste (e.g.,manure) from animal breeding can be washed into watercoursesviasurface runoff when not properly handled.By 2015,the fertilizer application intensity was showing year-on-year increases,and the scale of livestock and poultry production also expanded.The amount of fertilizer applied in China has increased sharply from 265 kg ha–1of sown area in 2000 to 359 kg ha–1of sown area in 2016 (NBSC 2017),which greatly exceeds fertilizer use in developed countries (FAO 2017;World Bank 2016).1Fertilizer use in high-income countries was 125 kg ha–1 of arable land on average in 2015 (World Bank 2016).Meanwhile,the total amount of livestock in production rose from 12.1 million tons in 1980 to 87.5 million tons in 2015 (China Statistical Yearbook;NBSC 1981–2016).
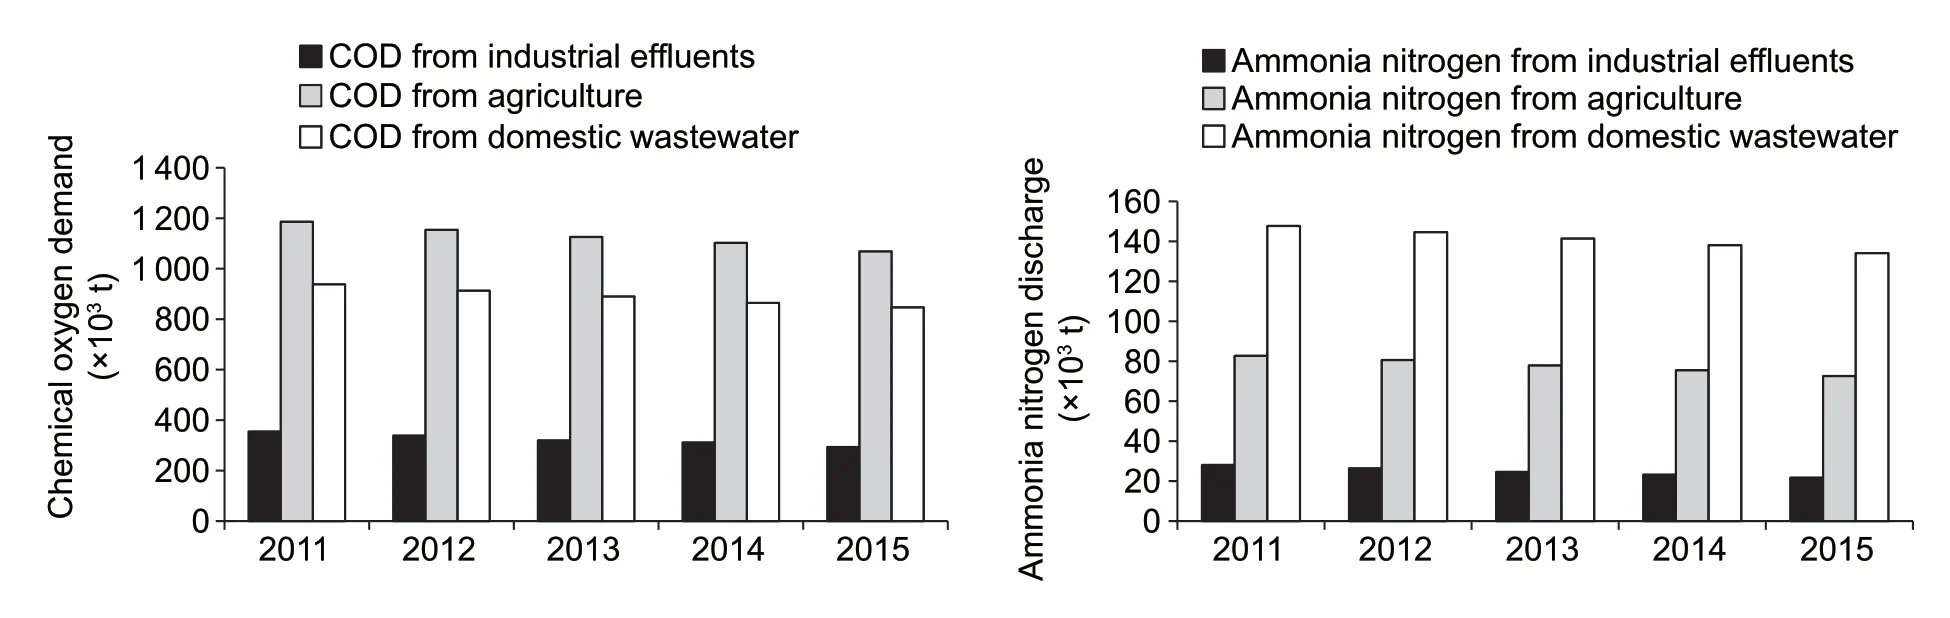
Fig.1 Chemical oxygen demand (COD) and ammonia nitrogen discharge (2011–2015).Source:MEEC (2015).There are no statistics for the emissions of major pollutants from agriculture before 2011.
For the realization of green development,it is important to determine whether the river chief system,which is regarded as an institutional innovation for water resource management,can effectively alleviate the NPS pollution from agriculture.Since the 18th National Congress in 2012,the Party Central Committee has attached great importance to green development.Agricultural green production serves as the major driving force in green development,as well as a prerequisite for realizing sustainable ecology (Liuet al.2020).China’s previous administrative management institutions were unable to solve the issue of severe water pollution (Sheet al.2019).According to theComments on the Full Implementation of the River Chief System(2016),full implementation of the river chief system is an inherent requirement for green development.Determining whether the river chief system ensures that local governments pay more attention to curbing agricultural NPS pollution has implications for environmental policy optimization.However,there has been no in-depth analysis on this topic.Under the current river chief system,local water quality is directly linked to the performance of government leaders.However,compared with point-source pollution,agricultural NPS pollution is more geographically dispersed and more difficult to regulate.The effect of the river chief system on NPS pollution remains to be assessed.
Based on county-level agricultural production and surface water quality monitoring data,this paper investigates the influence of the river chief system on agricultural NPS pollution.Local governments could alleviate agricultural NPS pollution by reducing source loads as well as stopping loads from entering surface waters (FAO 2017).Therefore,we sought to determine whether agricultural source loads did in fact decline and whether agricultural loads entering surface water bodies decreased.Agricultural NPS pollution mainly comes from fertilizer use and manure output.Based on Sigman(2005),a basin model at the county level is developed to evaluate the impacts of the river chief system on pollution load exports.In the basin model,COD and NH3-N pollutant levels are chosen as the indexes of water quality.In addition to agriculture,other major sources of water pollution such as human sediment and industrial production were also included in the empirical analysis.
This study attempts to fill the knowledge gap by estimating the effectiveness of China’s efforts in optimizing its decentralized environmental regulation regime.The river chief system was created to solve the problems of local governments’ insufficient incentives and poor coordination in addressing water pollution control in the decentralized environmental regulation regime.In essence,by making an individual personally responsible for outcomes,the river chief system differs from policy instruments such as command and control regulations and economic incentives.In-depth analyses have been conducted on the performance of different types of environmental regulation regimes and the effects of policy instruments.However,few studies have focused on the institutional reforms enacted under a certain environmental regulation regime.In addition,the impacts of environmental policies on agricultural NPS pollution are rarely discussed.As always,industrial pollution has attracted the most attention,and agricultural NPS pollution,which is dispersed and more difficult to control,is neglected.Agriculture has become the most prominent source of water pollution.Whether the river chief system can effectively mobilize local governments to deal with agricultural NPS pollution is of great importance to China’s green development as well as for evaluating the effectiveness of the river chief system.If proven successful,China’s river chief system can be used as a reference for other developing countries with a decentralized regulation regime and weak institutional background.
2.Data and methods
2.1.China’s river chief system
The river chief system originated in Wuxi City following a massive outbreak of blue algae in Taihu Lake in 2007,which caused a serious water pollution crisis.The Wuxi municipal government responded to the crisis by issuingThe Target and Assessment for Water Quality Control of Rivers (Lakes and Reservoirs) in Wuxi,Chinain August 2007,which led to rapid improvements in Taihu Lake’s water environment (Sheet al.2019).Subsequently,the river chief system has been actively adopted by other provincial and municipal governments because of its remarkable water pollution control effect in Wuxi City and strong operability.
Among the 102 sample cities in this paper,the first cities that implemented the river chief system include Zhoukou in Henan Province;Dandong,Fushun,Shenyang,Anshan,Yingkou,Panjin,and Tieling in Liaoning Province;Zhenjiang in Jiangsu Province;and Cangzhou,Handan,Xingtai,and Hengshui in Hebei Province.By December 2015,a total of 37 sample cities had initiated the river chief system to strengthen the prevention and control of water pollution.Fig.2 shows the cumulative number of sample cities which implemented the river chief system over time.In late 2016,the General Office of the CPC Central Committee and the General Office of the State Council promulgated opinions on full implementation of the river chief system,which marked the point at which the local practice became a national policy.Since then,all regions have accelerated the initiation of their own river chief systems.According to the Ministry of Water Resources of China,the river chief system had been established nationwide by June 2018.
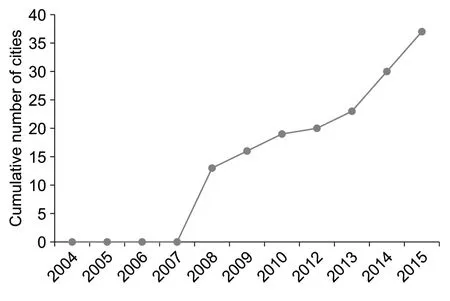
Fig.2 Cumulative number of sample cities implementing the river chief system over time.Source:Official documents and news reports relevant to the river chief system collected through Baidu Web and CNKI (China National Knowledge Infrastructure).
In essence,the river chief system is an institutional reform under China’s decentralized environmental regulation regime.Environmental regulation regimes fall into two major categories:decentralized and centralized.The rational allocation of environmental protection functions across different levels of governments is crucial for solving the problem of environmental pollution (Banzhaf and Chupp 2012).However,existing empirical studies have found that neither decentralized nor centralized regulation regimes could completely solve the problem of river pollution (Listet al.2002;Bernauer and Kuhn 2010;Caiet al.2016;Lipscomb and Mobarak 2016).Centralization of environmental protection functions can internalize the externality of river pollution but cannot attain efficient outcomes because central governments have less information about local affairs (Bernauer and Kuhn 2010;Lipscomb and Mobarak 2016).In contrast,decentralized policies can vary based on local benefits and costs,but it is difficult to avoid the free-riding of costs when pollutants flow across regions (Listet al.2002;Kahnet al.2015).
Prior to the establishment of the river chief system,China’s decentralized environmental regulation system did not work very well.An extensive body of literature has reviewed the current constraints of water environment management in China.Overall,a lack of incentives for government officials due to economic competition and fragmented institutional arrangements are challenges for China’s water resource management (Hanet al.2016).In addition,according to the tax-sharing system between the central government and local governments,the central government assigns responsibility for economic development to the local governments,thereby creating competition among local governments because those officials who significantly increase the local GDP are promoted (Li and Zhou 2005).Such an“economic growth first”strategy resulted in an extremely deteriorated environment,which has become a bottleneck to further economic development.
The environmental governance system at both the central and local levels in China is complex and fragmented.In water governance,at least 13 government agencies operate at the central level,each of which holds some degree of administrative responsibility for water management (Denget al.2016).At the local level,a three-level structure of water governance operates according to the central ministries and commissions.Therefore,local water governance agencies are affiliated with the provincial government but also receive guidance and supervision from central ministries and commissions.China’s hierarchical water governance system has two major deficiencies.First,fragmentation at the horizontal level has negatively affected the water management system’s performance.No core ministry holds the authority to coordinate other ministries in water governance (Hanet al.2016).Second,the water governance agency is not able to fully supervise environmental protection.Local environmental protection bureaus (EPBs) need financial support from the local government (Denget al.2016).Under the promotion tournament of local officials,higher levels of government give greater weight to economic growth than to achievements in environmental governance.
The initiation of the river chief system is intended to solve the problems of insufficient incentives and poor coordination in water pollution control at the local government level.Assigning party and government leaders as river chiefs and incorporating the governance of river water quality as an essential criterion for political promotion has guaranteed the validity and sustainability of river governance to some extent.Some qualitative studies maintain that the river chief system can effectively solve the long-term problem of local governments lacking incentives to control pollution while also avoiding“beggarthy-neighbor”actions and realizing co-governance across the upstream and downstream areas (Xiong 2017).Despite these intended benefits,the efficacy of the river chief system in practice remains controversial.In an assessment of the regulatory status of the river chief system in different regions,we found that some regions only implemented the river chief system nominally,and an accountability mechanism had not been established.Among the 37 sample cities that implemented a river chief system,only 14 cities clearly stated in government documents that surface water quality (COD concentration,ammonia nitrogen concentration,or water quality grade)would be assessed and that river chiefs who failed the assessment would be criticized in a circulated notice or receive administrative punishments.
Although agricultural NPS pollution is one of the most important types of water pollution,it is rarely discussed in relevant government documents pertaining to the river chief system.Most local governments have tried to strengthen the treatment of key water pollution enterprises and improve the construction and operational management of urban sewage treatment plants.Only the cities of Sanmenxia and Jiyuan in Henan Province and Foshan and Qingyuan in Guangdong Province emphasized the importance of agricultural NPS water pollution control.To curb agricultural NPS water pollution,Sanmenxia City’s local government allocated special funds for agricultural pollution control,and projects for alleviating pollution caused by crop farming and livestock breeding were carried out.Specifically,farmers were encouraged to use formula and organic fertilizers.Clean animal-raising zones were implemented,and animal excrement was utilized comprehensively.Foshan aimed to end the problem of the illegal discharge of sewage from livestock farms and straw mushroom farms,and Qingyuan tried to control the pollution caused by livestock and poultry breeding.Although the implementation of the river chief system has improved water quality,the extent to which this improvement is due to the alleviation of agricultural NPS pollution is the question this study aims to answer.
2.2.Variables and data
Water qualityThe Surface Water Automatic Monitoring Network,which is maintained by the China National Environmental Monitoring Center under the Ministry of Ecology and Environment of the People’s Republic of China,measures four different water quality parameters at 133 monitoring stations along China’s rivers.The tested parameters include ammonia nitrogen,chemical oxygen demand,dissolved oxygen,permanganate index,and potential of hydrogen (PH).The data cover the years 2004 to the present,with the number of operating stations gradually increasing from 73 at the beginning of this period to 131 in 2015.2The stations in Xinyang City,Henan Province,and Cangzhou City,Hebei Province,were canceled in 2010 and 2011,respectively.Stations report their data almost weekly during their operation period.The original weekly water quality data are converted into average monthly data in this analysis.
The monitoring stations are widely distributed along seven major river basins,including the Yangtze River,Yellow River,Huai River,Hai River,Pearl River,Songhua River,and Liao River,as well as some inland rivers.Because many monitoring stations have no adjacent upstream stations,we selected 58 stations that can be used as downstream or upstream monitoring stations and 19 stations that can only be used as upstream stations.In total,the sample contains 77 monitoring stations.All the sample stations are along the seven major river basins,with most along the Yangtze and Huai Rivers.The mainstreams between sample stations flow through a total of 308 county-level divisions in 17 provinces,3 autonomous regions,and 3 municipalities.The mainstreams between any two adjacent stations flow through 14 counties on average.
The river chief systemThis study’s core explanatory variable is whether the counties through which the basin flows have implemented the river chief system.The regulatory status of the river chief system at the county level was determined manually.To ensure the accuracy of the manually collated data,the status of the river chief system was collated based on two channels and crossverified.First,a search of official documents and news reports relevant to the river chief system was conducted through Baidu Web,and whether and when a county implemented the river chief system was determined.Second,a search was conducted of relevant government documents and news reports in the CNKI (China National Knowledge Infrastructure) database to determine the status of the river chief system in various regions.Shen and Jin (2018) also used this method to obtain information on whether a city has employed the river chief system.In the process of data collection,it was found that governments that initiated the river chief system are at the city or province level,whereas county-level governments rarely did.We assume that if a municipal or provincial government proposed the river chief system,the counties in its jurisdiction would implement it.
Fertilizer useDue to the obvious seasonal timing of fertilizer application,monthly data on fertilizer usage will be more useful than annual data.Based on five variables(annual fertilizer use at the county level,annual sown area of each crop at the county level,annual fertilizer use per mu of each crop at the province level,percentage of fertilizer that each crop needs in each growth stage at the county level,and growth stage of each crop in each month at the county level),yearly county-level fertilizer use is converted into monthly county-level fertilizer use according to eq.(1):
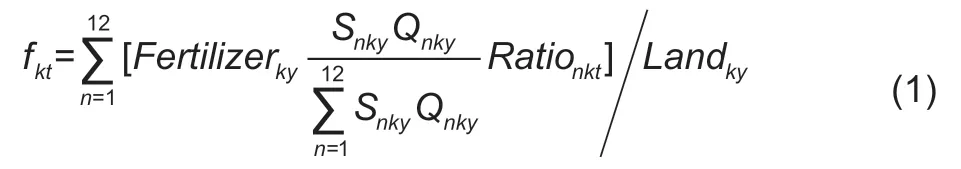
wherekindicates county;yindicates year;tindicates time(month);nindicates the 12 kinds of crops,including rice,wheat,corn,vegetables,fruits,soybeans,cotton,peanuts,rape,potatoes,sugarcane,and beets;fktindicates monthly fertilizer use intensity of countyk;Fertilizerkyis the total fertilizer use of countykin yeary;Snkyis the sown area of cropnin countykin yeary;Qnkyis the fertilizer use per mu of cropnin countykin yeary;Rationktis the percentage of fertilizer used for cropnin countykat timet,ranging from 0 to 1;andLandkyis the cultivated land area of countykin yeary.
Data on yearly fertilizer use,crop sown areas,and farmland acreage at the county level were obtained from the Chinese Academy of Agricultural Sciences.Crop fertilizer requirements in each growth stage are listed in Appendix A and were collected fromThe Theories of Crop Cultivation(Yang and Tu 2011).The China Meteorological Administration has established 788 observation stations to monitor the growth status of crops across the country.3Publicly available data on growth status can be obtained from www.cma.gov.cn/2011qxfw/2011qsjgx/Each county in this study is matched with the nearest observation station.The percentage of fertilizer for each crop used at timetis defined based on the percentage of fertilizer used in each growth stage of each crop and the growth status data for each crop at timet.Data on the fertilizer use per mu (1 ha=15 mu) at the province level come from theNational Farm Product Cost-benefit Survey(2004–2015).The data from the Chinese Academy of Agricultural Sciences are generally thought to be reliable and have been used in previous studies,such as those by Huang and Rozelle (1995) and Denget al.(2010).
Manure outputThe manure output divided by jurisdiction area (Manurekt) represents the water pollution generated by raising animals.Farmland is the main disposal site for the excreta from animal husbandry.Nutrient loads per unit of farmland are used to represent the risk of pollution from livestock and poultry breeding (Liet al.2016).
Based on Liet al.(2016),the numbers of animals being bred and the annual pollution coefficients are used to estimate pollution loads using the following formula:

wherekindicates county;tindicates time (month);yindicates year;nindicates the four types of livestock and poultry,as pigs,cattle,sheep,and poultry;Manurektis the monthly output of livestock and poultry pollutants (t ha–1)of countykat timet;Snkyindicates the year-end number of animals being bred (head);andGnstands for the annual emission of pollutants for each animal (kg/head).Given the limited data availability,livestock and poultry breeding is assumed to be relatively stable within a year,and thus the monthly pollutant output is 1/12 of the annual manure production.
Annual data on the year-end number of livestock and poultry being bred were collected from the Chinese Academy of Agricultural Sciences (2004–2015).The emission coefficients of livestock and poultry were obtained from the literature (e.g.,Liet al.2016).The annual pollution coefficients of cattle,sheep,pigs,and poultry are 7 300,474,1 368,and 32 kg/head,respectively.
Other water pollution sourcesThree additional variables,Industrykt,Populationkt,andFarmlandkt,provide time-varying determinants of pollution releases or their impacts on water quality.Industryktis measured by the industrial added value divided by jurisdiction area.Populationktis the population density of countyk,equivalent to total population divided by jurisdiction area.Farmlandktis the cultivated land acreage at the year-end divided by jurisdiction area.
Annual data on county-level industrial added value,population,and jurisdiction area were obtained from theChina Statistical Yearbook (County-level)(NBSC 2005–2016). The Chinese Academy of Agricultural Sciences also provided population data.Given the limited data availability,industrial production,population,and agricultural acreage were assumed to be stable within a year,and thus monthly values equal 1/12 of yearly values.
Water pollution control policiesIn addition to the river chief system,local governments have introduced other policies to control water pollution.According to pollution sources,those policies are divided into policies against industrial point-source water pollution and policies against agricultural NPS water pollution.In order to control for the impact of these policies on agricultural source loads and surface water quality,variablesPolicyAandPolicyIwere added to the model.The former indicates whether the county government issued policies relevant to agricultural NPS water pollution control,and the latter indicates whether the county government issued policies to control industrial point-source water pollution.
Policy information was obtained from the official websites of local governments and searches for relevant government documents on Baidu Web and CNKI.The keywords forPolicyAwere“agriculture”and“water pollution”,and those forPolicyIwere“industry”and“water pollution.”The government documents retrieved are basically“notices”or“opinions”issued by the county governments.In general,notices issued by county-level governments mainly convey the requirements related to water pollution control measures imposed by authorities at higher levels,and the opinions released by county governments focus on bringing forward specific work plans for water pollution control.
Many studies have focused on accurately measuring the level of enforcement of environmental regulations.Previous efforts have used indicators such as investment in pollution reduction and the number of people in environmental protection agencies to measure the intensity of environmental regulation at the provincial or municipal level (Buet al.2013;Xuet al.2019).Limited by the data,however,it is quite difficult to identify the intensity of environmental regulation at the county level.Fortunately,both individual and time-fixed effects in the model could mitigate any measurement error.
Weather conditionsThe water quality equation includes two weather characteristics,RainfallktandTemperaturekt.Excess fertilizer entering the receiving waters can come from surface runoff due to either rainfall or irrigation (FAO 2017).Precipitation plays a dual role in the process of NPS pollution.On the one hand,precipitation conveys pollutants into the water,which will increase the water’s pollutant load (Shenet al.2014).On the other hand,precipitation increases the amount of overland runoff,diluting the concentration of pollutants.When the carryover effect exceeds the dilution effect,water quality deteriorates;conversely,water quality improves when the dilution effect exceeds carryover.Therefore,the impact of fertilizer use on surface water quality is uncertain.Temperature is included in the estimation equations because it affects the biological activities and chemical conditions in the river,and thus the natural attenuation rates of pollutants (Sigman 2005).Existing research that evaluated the impacts of environmental regulation on surface water quality incorporated climate factors into the models.For example,to evaluate the impacts of the river chief system on surface water quality,Shen and Jin (2018)included the variableTemperaturein the model.Similarly,Sigman (2005) included two river characteristics,river flow and water temperature,in the estimation equations.
To control for weather conditions,each county is matched with the nearest meteorological stations.The China Meteorological Administration has established 824 meteorological stations to measure daily rainfall and temperature throughout the country.Daily rainfall and temperature are converted into monthly cumulative rainfall and monthly mean temperature,respectively.The average distance between each county and the nearest meteorological station is 35 km.
Descriptive analysisThe variable definitions and descriptive statistics are given in Table 1.
2.3.Econometric model
This paper aims to assess the effect of the river chief system on alleviating the water pollution caused by agricultural production.NPS pollution can be reduced by either“reducing source loads”or by“preventing loads from entering surface waters”(FAO 2017).
Reducing source loadsIn crop production,the risk of water pollution due to fertilizers can be reduced by optimizing the type,amount,and timing of their application to crops.Local governments in China have allocated special funds for encouraging farmers to use formula and organic fertilizers to reduce their chemical fertilizer use.In animal breeding,closing or removing livestock and poultry farms in areas where feeding is forbidden is a common practice.
Preventing loads from entering surface watersSimple off-farm techniques,such as the construction of buffer strips or constructed wetlands,have proven to be effective in reducing the loads entering surface water bodies.Vegetated filter strips at the margins of farms and along rivers act as filters for sediment and its attached pollutants,thereby effectively decreasing the concentrations of pollutants entering waterways.Constructed wetlands can be used to treat agricultural drainage and remove sediments,nutrients,and other pollutants.Local governments can adopt measures such as biometric interception to reduce the agricultural pollution entering water bodies through surface runoff.In addition,properly disposing of manure in animal breeding is important for limiting the export of pollutants,and largescale farms are required to install manure treatment facilities.
Under the river chief system,local governments have gained sufficient incentive to engage in more coordinated actions to control water pollution.Consequently,they might encourage farmers to reduce fertilizer usage by making greater efforts to promote organic and formula fertilizers.Meanwhile,in terms of treating pollution from animal breeding,local governments tend to make greater efforts to encourage the utilization of manure asa resource.In addition,they are likely to construct more buffer strips to limit pollutant exports.
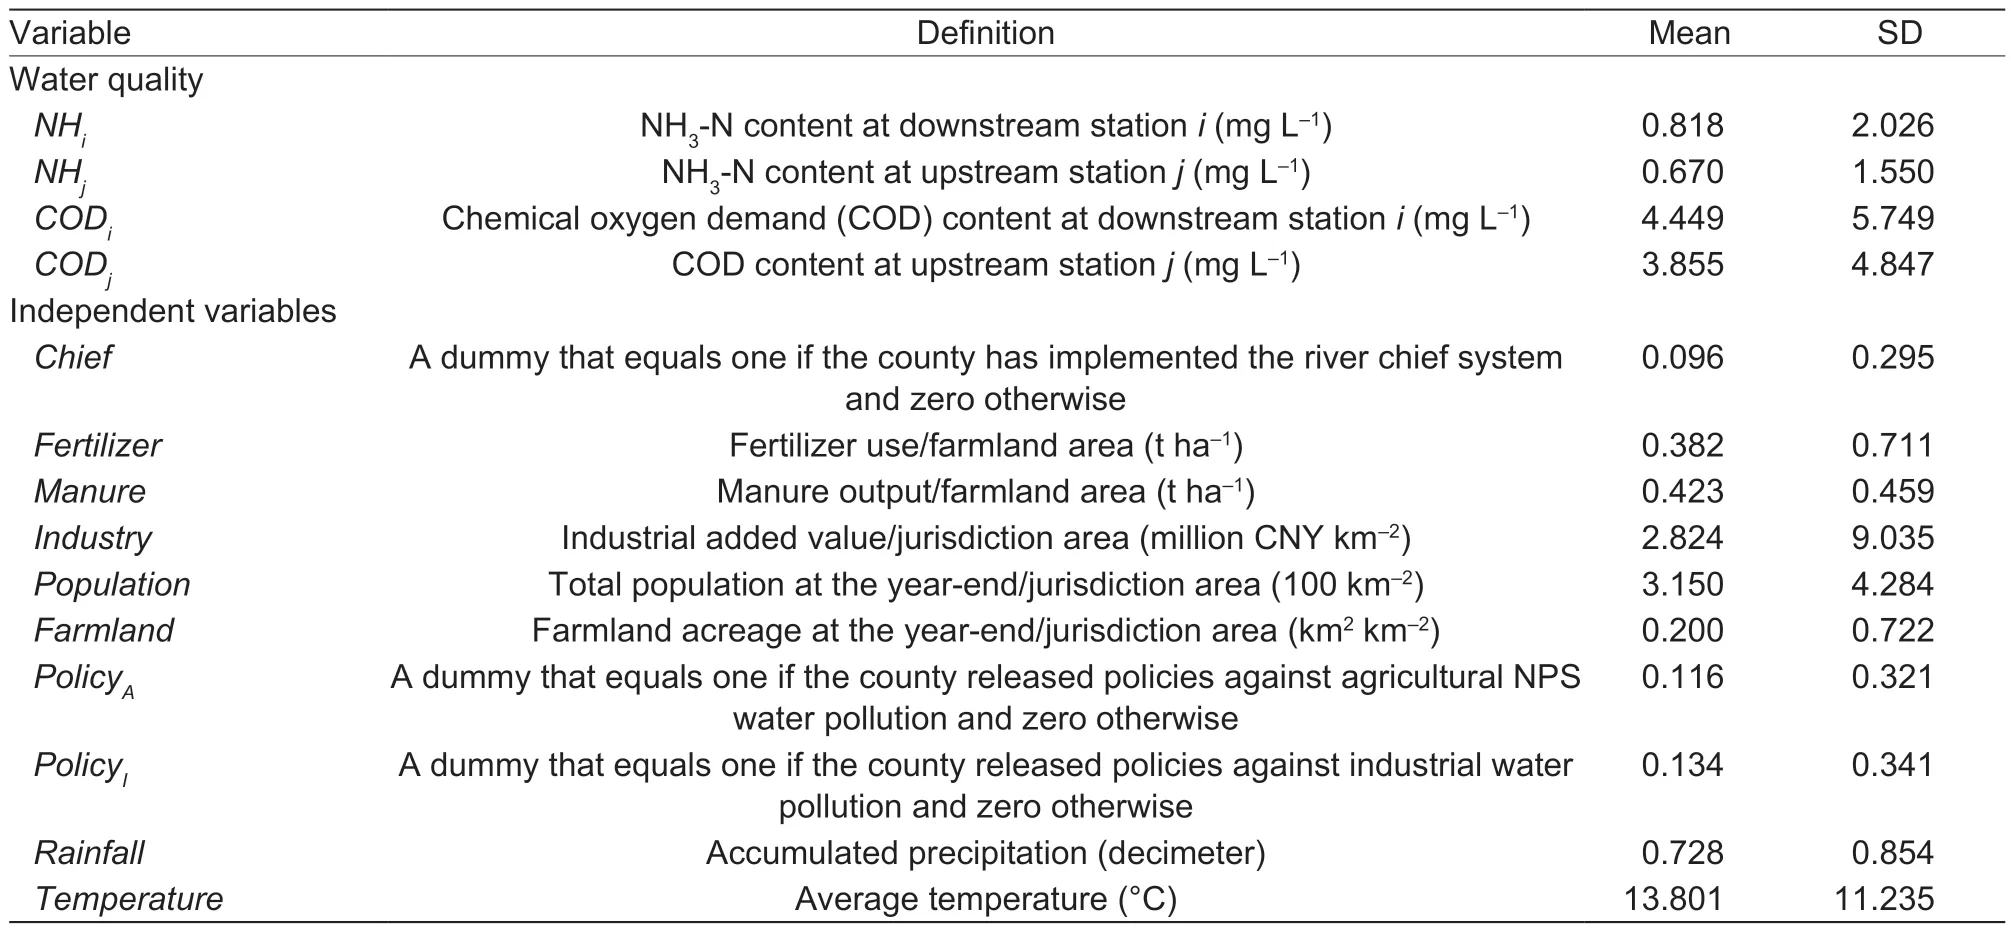
Table 1 Variable definitions and descriptions
Therefore,this study aims to investigate the effects of the river chief system from two aspects:(1) whether source loads are reduced,i.e.,whether fertilizer usage and manure output decrease following the implementation of the river chief system;and (2) whether the exports of pollutants are limited,that is to say,whether more protection zones or buffer strips are established and an increased percentage of manure is safely disposed of after the initiation of the river chief system.However,we do not have access to data on either the areas of protection zones and buffer strips and/or the amount of animal excrement that undergoes neutralization treatments such as composting,anaerobic fermentation,and methane fermentation.Given that the environmental pressure caused by a given source load decreases with efforts in preventing the load from entering surface waters,we can evaluate the effect of the river chief system by examining whether the marginal negative impacts of fertilizer use and animal breeding on water quality are reduced after the initiation of the river chief system.
A difference-in-differences (DID) model specification is used in this empirical analysis based on the following regression:

whereYktrepresents the agricultural pollution source loads (fertilizer use or manure output) in sample countykat timet;Chiefktis a dummy variable that equals one in the years after countykhas initiated the river chief system and is zero otherwise;Xktaccounts for an additional set of time-varying county-level variables capturing socioeconomic characteristics,such as population density and environmental regulations against agricultural pollution;andμkandμtare county-and timefixed effects,respectively,which are used to control for unobservable variables.The inclusion of time-fixed dummy variables can control for trends that influence agricultural pollution over time,such as technological improvements and changes in national regulations.The inclusion of county-fixed dummy variables controls for time-invariant,unobserved county characteristics that influence agricultural pollution,such as soil type.εktis the error term.
To examine whether the marginal impacts of agricultural production on water quality are reduced after the initiation of the river chief system,based on Sigman(2005),we construct a basin model with the interaction terms of the river chief system and source loads.The model is specified as:

wherekrepresents the sample counties that the river reaches between monitoring stationsiandjflow through(including the counties in which the stations are located);Qitis a function of pollution loads from upstream and indicates the water quality at stationiat timet;andQjtis the water quality at stationjat timet,where stationjis upstream adjacent to stationi.Thus,stationiis the closest monitoring station to the countykand water qualityQjtrepresents the pollution inputs upstream of locationj.It is included in the model to avoid biased estimates.Yijktindicates the agricultural pollution source loads (fertilizer use or manure output) in countyk.As far as we know,no previous studies have assessed the impacts of fertilizer overuse on COD in surface waters.Thus,fertilizer use is not included in the model for COD.Chiefijktis the status indicator of the river chief system and equals one after countykinitiated the river chief system.Pijktindicates the pollution loads from industrial production,human sediment,and farmland.Zijktindicates factors that either dilute or concentrate these pollution inputs,such as rainfall and temperature.Precipitation can dilute the concentration of pollutants in surface water as well as convey more pollutants to the water body.Temperature is included because it affects a river’s biological activity and chemical conditions,and thus the natural attenuation rates of pollutants (Sigman 2005).Existing research that evaluates the impacts of environmental regulation on surface water quality (e.g.,Sigman 2005;Shen and Jin 2018) also incorporates climate factors into the modeling.μkandμtare county-and time-fixed effects,respectively,andεijktis the error term.
The parameterβ1captures the impact of agricultural production on water pollution.Many mathematical models have been developed to assess NPS pollution loads and forecast their impact on the water environment (Juet al.2009;Shenet al.2010,2014;Özcanet al.2017;Xuet al.2018).These models generally can be divided into two categories,process-based models and statistical models(Shenet al.2012).The former models assess pollution loads based on analyzing changes of contaminant concentrations in the receiving waters,whereas the latter focus on simulating the pollutant-generating processes to estimate pollution loads.Unlike previous estimates that focus on assessing pollution loads,the basin model in this analysis can depict the relationship between agricultural production and water quality in the real world.
2.4.Validity of the identification hypothesis
Counties located between any two adjacent stations are the sample counties of this study.The river chief system was implemented at different times in different places.Counties that initiated the river chief system from 2004 to 2015 comprise the treatment group,and the remaining counties comprise the control group.
The two key identification hypotheses for unbiased estimates of the DID models are as follows:(1) there is a common pre-existing trend in agricultural river pollutant reduction between counties with and without the river chief system,and/or (2) the cross-county river chief status is randomly selected,i.e.,counties with the river chief system are not affected by the agricultural pollution situation or other unobservable factors in the pretreatment period.
Common pre-existing trendsFollowing Jacobsonet al.(1993),a series of dummy variables that equal one before or after the initiation of the river chief system are included in the standard regression to explore the pre-existing trends:

whereChief−jequals one for countykin thejth year before the initiation of the river chief system,andChief+jequals one for countykin thejth year after the adoption of the river chief system.For the year in which the river chief system is initiated,Chief0is equal to one.The other variables are identical to those in eq.(3).If the outcome trends between the treatment and control groups are the same,thenChief−jshould be insignificant.
Table 2 reports the estimation results of eq.(5).The results indicate that agricultural pollution source trends were similar in the absence of the river chief system because both coefficients of the river chief system dummy variables were not significantly different from zero during the pretreatment period.
Random status of the river chief systemThe second hypothesis of this empirical analysis is that the crosscounty status of the river chief system is unaffected by agricultural pollution.Before 2016,local governments autonomously chose the timing of implementation according to their economic and environmental goals.The major concern with our identification hypothesis is that local governments facing more serious agricultural NPS pollution will be more likely to adopt the river chief system.To address this concern,following Becket al.(2010),this paper examines whether the river chief system status has any association with local agricultural river pollution status.The first two columns in Table 3 reveal that neither of the two indicators of agricultural pollution,i.e.,fertilizer use or manure output,explain the timing of the river chief system implementation by the counties.
The last concern is that the effect of the river chief system might be confounded by other factors that can also affect agricultural pollution.Although the timing of the river chief system is unaffected by the seriousness of agricultural pollution,it still might be possible that the timing of the river chief system co-varies with other socioeconomic factors.Thus,we explore whether the timing of the river chief system implementation has been affected by any other observable factors.Columns (3)–(7)in Table 3 report the impacts of several observable factors on the timing of the river chief system.The data provide little evidence for a high degree of correlation between the timing of the river chief system and other socioeconomic factors.Although the DID hypothesis states that the timing of a treatment group should not be associated with any other factors,including observable and unobservable factors,the insignificant effects of observable factors on the timing of the river chief system implementation indicates that unobservable factors would not affect theriver chief system status either (Sheet al.2019).
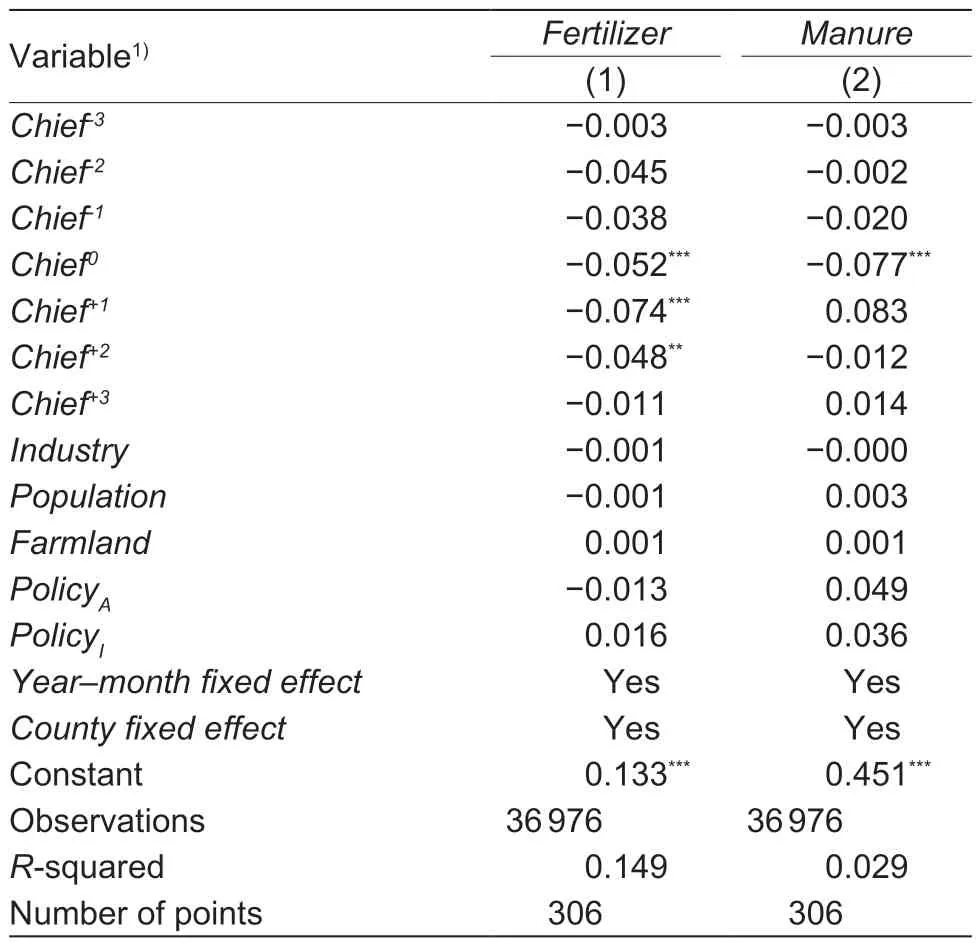
Table 2 Pre-existing trend test of the river chief system regarding agricultural source loads
3.Results
This section first explores whether agricultural source loads are reduced by the river chief system.Then,the impacts of the river chief system on the impacts of agriculture on water quality are examined.
3.1.Reductions in agricultural source loads
We estimate a function that links agricultural source loads to the river chief system.Fertilizer use and manure output are compared before and after the initiation of the river chief system.Table 4 reports the results,and the dependent variables in Columns (1) and (2) are fertilizer use (Fertilizer) and manure output (Manure),respectively.In order to control for heteroscedasticity and autocorrelation,robust standard errors were used in all regressions.The results show that the river chief system does not have significant impacts on either fertilizer use or manure output.
This finding is expected because few local governments have emphasized the importance of reducing fertilizer use according to the government documents relevant to the river chief system.In terms of water pollution caused by animal breeding,local governments seem to have emphasized the importance of cleaner production rather than cutting back on production.
3.2.Reductions in the impacts of agriculture on water quality
As indicated above,the river chief system has been ineffective in reducing the consumption of chemicalfertilizers or cutting manure output.This section answers the next logical question:has it played a role in reducing the marginal impact of agricultural production on the environment?.
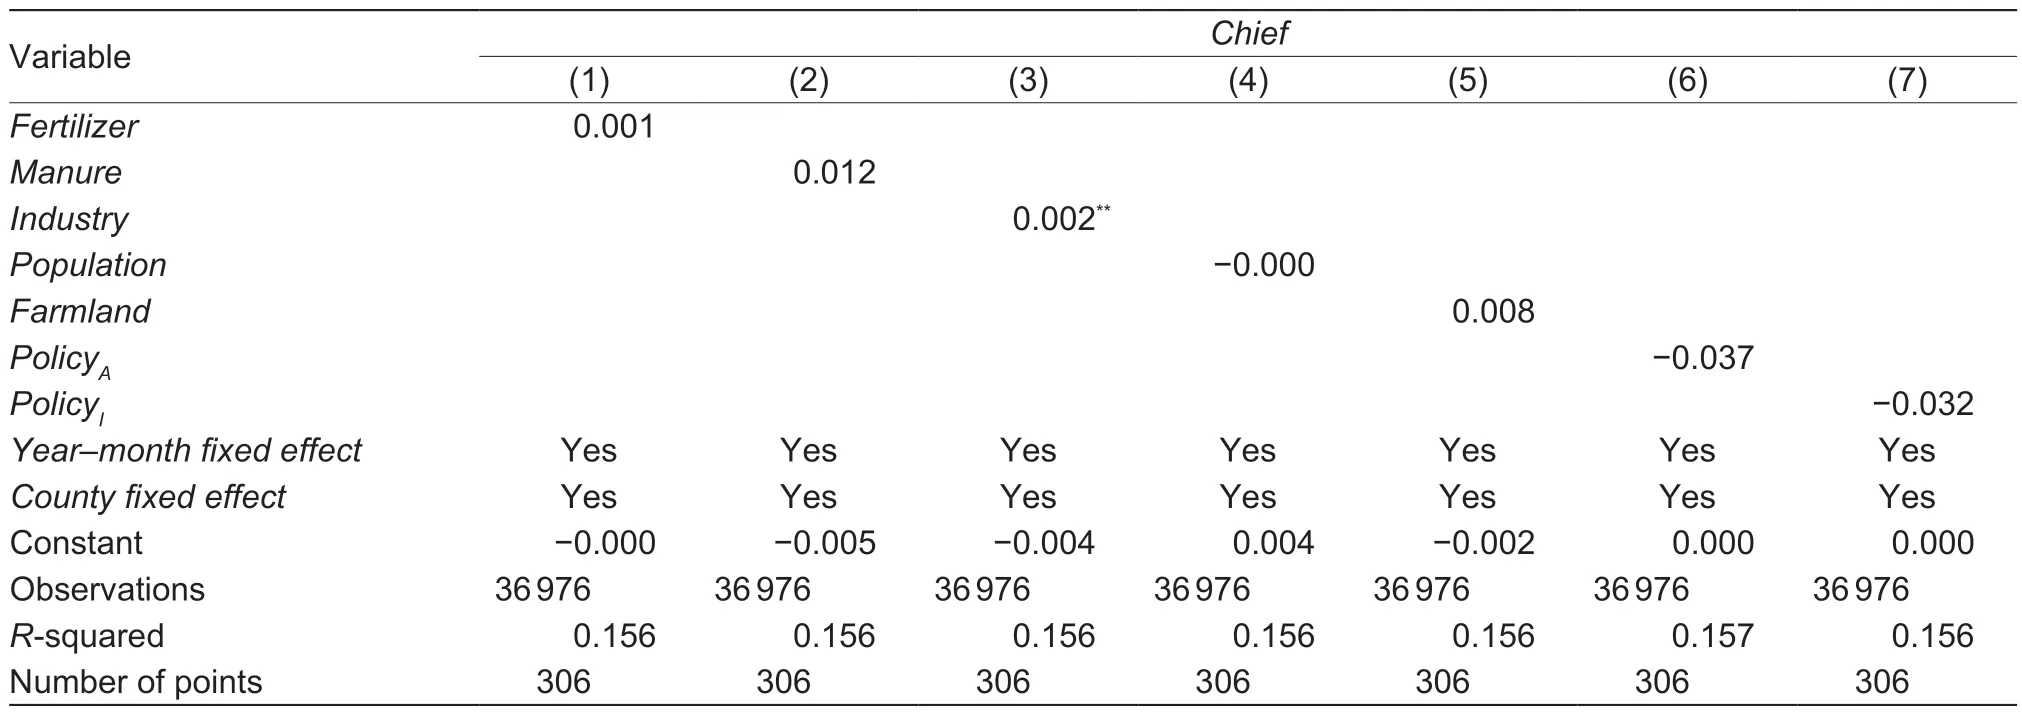
Table 3 Test of the random status of the river chief system
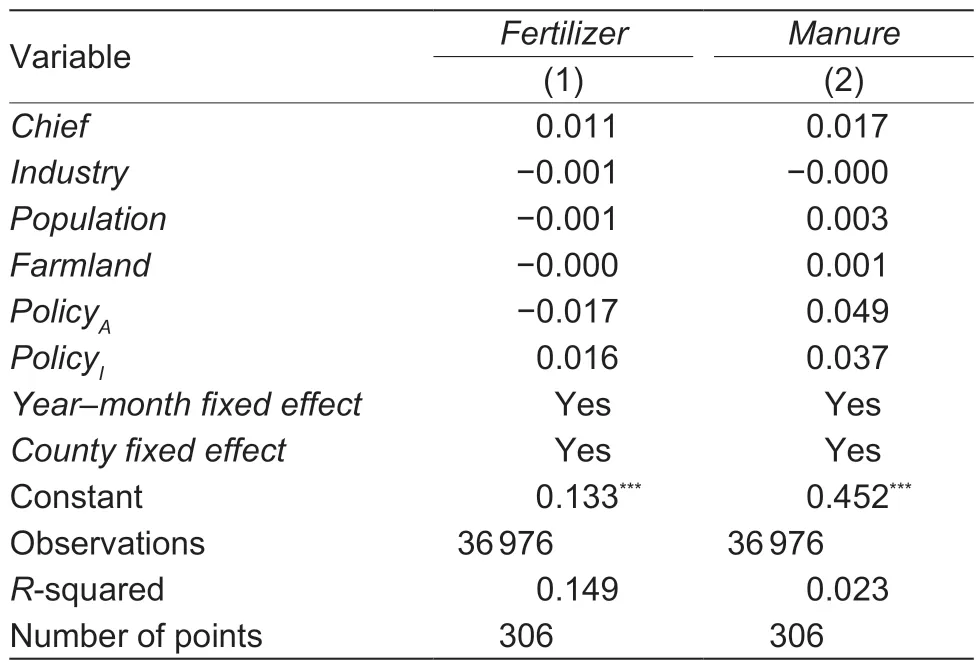
Table 4 Effects of the river chief system on agricultural source loads
Table 5 shows the impacts of the river chief system and agricultural production on surface water quality.The coefficientsFertilizerandManureindicate the impacts of agricultural production on surface water quality.For NH3,the coefficients ofFertilizerare negative and insignificant.For both NH3and COD,the coefficients ofManureare positive and significant.Specifically,a one-unit increase in manure output upstream increases the NH concentration downstream by 0.090 mg L–1and the COD concentration by 0.154 mg L–1.The positive partial effect of manure output signifies that water quality deteriorates in areas with higher levels of animal breeding.
Table 5 also reveals that the river chief system can reduce NH and COD significantly.In the first column,the status of the river chief system implementation is associated with a pollutant decrease of 0.069 mg L–1.For COD,the estimated coefficient of the river chief system is negative and significant at the 1% level.Therefore,the river chief system has a positive effect on water pollution reduction.This finding is consistent with that of Sheet al.(2019).
The coefficients of the interaction term ofManureandChiefin each column of Table 5 are negative and significant at the 1% level,suggesting that with the implementation of the river chief system,the adverse impact of animal breeding on surface water quality is mitigated.However,the coefficients of the interaction betweenFertilizerandChiefare insignificant.This result indicates that more breeding farms are equipped with sewage treatment facilities in the counties adopting the river chief system.However,effective measures have not been taken to dealwith the water pollution generated by fertilizer use.
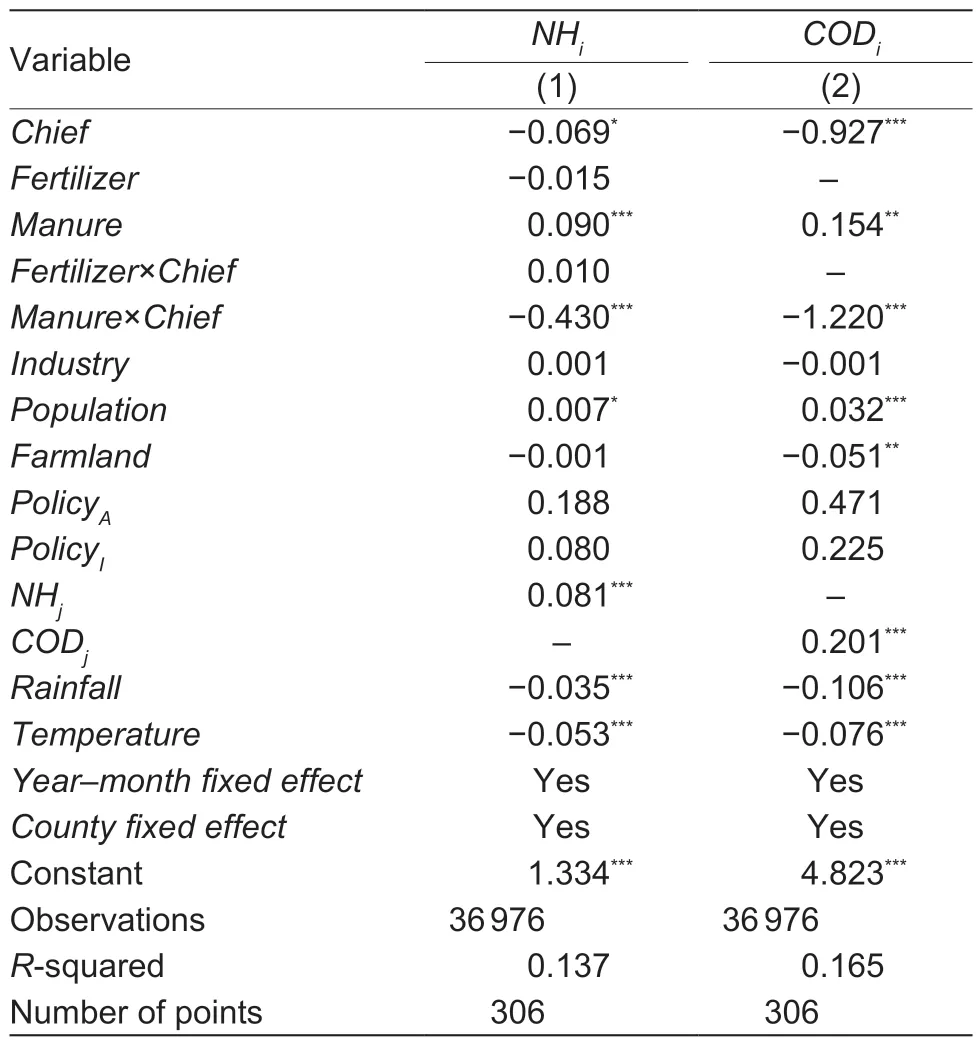
Table 5 Effects of the river chief system and agricultural source loads on surface water quality
Industrial production at upstream locations seems to have no significant effect on the concentrations of NH3-N or COD in downstream locations.This result signifies that governments have achieved effective control of pointsource pollution in recent years.Technical innovations are known to have enabled steady reductions in the intensity of discharges of pollutants from industrial sources in recent years (Hu and Cheng 2013).In addition,the coefficients ofPopulationare positive and significant.Thus,population density has a negative effect on the water environment,as expected.
In addition,the water quality at upstream stations has a statistically significant effect at the 1% level.The dilution effect of precipitation exceeds its carrying effect,as indicated by the significantly negative coefficients of rainfall.The coefficients of temperature are also negative and significant at the 1% level,indicating that higher temperatures accelerate the natural attenuation rates of the pollutants.
4.Discussion
Water pollution is a typical type of transboundary pollution,which is difficult to address effectively.Due to the externality of water pollution,cross-border rivers will bring damage to the environment in downstream areas.Sigman (2005) studied the major pollutant indexes of 501 water quality monitoring points in the United States and found that administrative decentralization would lower the downstream water quality and increase the treatment cost.The competitive behavior of local governments in China makes the water quality of rivers near an administrative boundary worse,and administrative segmentation results in the dilemma of cross-border water environmental management (Liet al.2015).In contrast,the river chief system requires provincial and municipal leaders to jointly serve as river chiefs and coordinate the prevention and control of river pollution.Considering the transboundary nature of agricultural NPS water pollution,it is particularly important to determine whether the river chief system can stimulate inter-regional cooperation to achieve an overall improvement of water quality in a basin.Thus,this section assesses whether the river chief system is effective in alleviating transboundary agricultural pollution.
A sub-sample regression is adopted to determine if counties in the same province in the upstream adopting the river chief system and if counties in other provinces in the upstream adopting the river chief system would impact local water quality.The results are presented in Table 6.
In the first column,the coefficient of the interaction term betweenManureandChiefis negative and significant at the 1% level,whereas the coefficient is insignificant in Column 2.This result holds for COD.In upstream areas within the same province where the river chief system is implemented,the pollution caused by livestock and poultry breeding is reduced,leading to improvements in water quality in the lower regions.However,the implementation of the river chief system in the upstream regions in other provinces did not improve the local water quality by alleviating the pollution caused by livestock and poultry breeding.Therefore,it can be seen that upstream provinces are free riders,and the river chief system did not promote inter-provincial cooperation.
5.Conclusion and implications
Agricultural non-point-source pollution,which is primarily caused by fertilizer runoff from farmland and breeding facility wastewater discharge,is becoming an increasingly important river pollution source and has raised many concerns.The river chief system was enacted as an institutional reform of China’s decentralized environmental regulation regime,and this study has examined whether the river chief system has been effective in alleviating agricultural NPS pollution.Using panel data from 308 counties during the period from 2004 to 2015,this is the first published paper to answer the following questions:1) Does the river chief system have an effect on reducing agricultural source loads? 2) does the river chief system play a role in reducing the negative impacts of agricultural production on the environment? 3) do river chiefs engage in inter-provincial cooperation?
This study developed a basin model to assessthe impacts of the river chief system and agricultural production on monthly surface water quality.The evidence presented in this paper points to an important role for livestock and poultry raising in unfavorably altering the contents of NH3-N and COD in surface water.In contrast,fertilizer use does not have a significant negative impact on water quality.We also find that the implementation of the river chief system has indeed alleviated NPS pollution because the negative impact of animal breeding on the environment decreases after the initiation of the river chief system.However,although governments realize the hazards of fertilizer overuse,the river chief system does not help to reduce water pollution caused by fertilizer use.In addition,cooperation among river chiefs only occurs within a province.
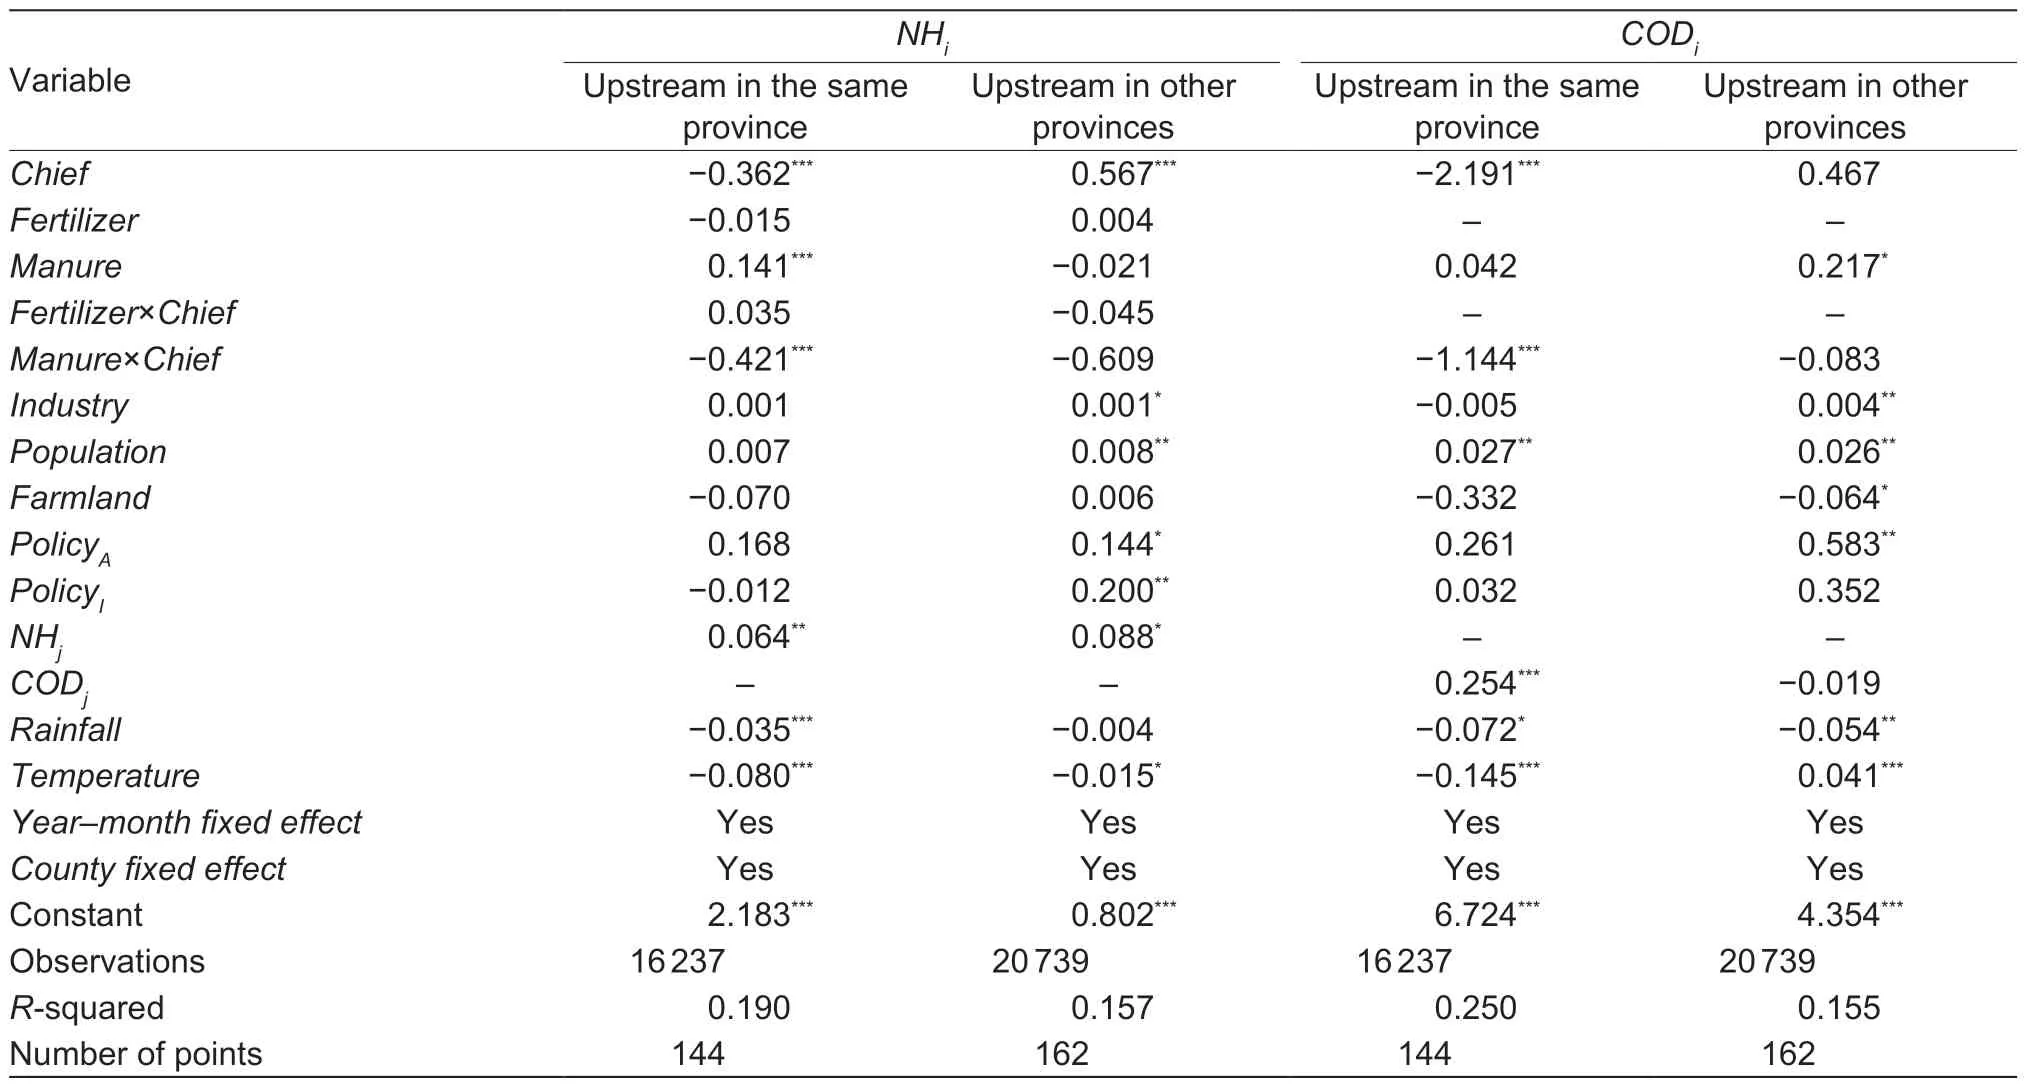
Table 6 Effects of the river chief system and agricultural source loads on water quality from the perspective of border effects
These findings have important implications for the enforcement of the river chief system and NPS pollution control in the future.First,more stringent regulations should be implemented to reduce fertilizer use and limit the nutrient loads entering waters.Second,although the river chief system is effective in controlling pollution from animal breeding,trans-provincial cooperation is weak.Because China’s seven major river basins are transprovincial,a river/basin governor system rather than an administration-area governor system should be promoted to tackle the problem of NPS pollution.
Acknowledgements
We acknowledge the financial support from the National Natural Sciences Foundation of China (71742002 and 71934003),the Priority Academic Program Development of Jiangsu Higher Education Institutions,China (PAPD),and the China Center for Food Security Studies in Nanjing Agricultural University,China.
Declaration of competing interest
The authors declare that they have no conflict of interest.
Appendixassociated with this paper is available on http://www.ChinaAgriSci.com/V2/En/appendix.htm
杂志排行
Journal of Integrative Agriculture的其它文章
- Errata regarding previously published articles
- Ultrastructural studies of seed coat and cotyledon during rapeseed maturation
- Resource utilization of agricultural solid waste
- Can harvest outsourcing services reduce field harvest losses of rice in China?
- An improved scheme for infectious bursal disease virus genotype classification based on both genome-segments A and B
- Exploring the genetic features and signatures of selection in South China indigenous pigs