Measurement of surface roughness of Salix psammophila scrimber using stylus profilometer and extended depth-of-field 3D microscope
2021-03-31LINQiuqinHUANGYuxiangZHANGYahuiRAOFeiYUWenji
LIN Qiuqin,HUANG Yuxiang,ZHANG Yahui,RAO Fei,YU Wenji
(Research Institute of Wood Industry,Chinese Academy of Forestry,Beijing 100091,China)
Abstract: Salix psammophila scrimber resulted from processing rapidly sandy shrubs into fiber reinforced composites,has a large cross section with outstanding strength.As a kind of homogeneous material,the density and the size of scrimber is controllable,which can replace the solid wood to a certain extent.It is extremely important to have an overall evaluation of surface roughness of wood-based materials due to the unique and complicated surface texture.In this study,the characteristics and principle of a new method (extended depth-of-field 3D microscope) for the mea-surement of wood surface roughness was investigated,and the traditional 2D tactile stylus profilometer method was also used for comparison.In addition,the effects of relative humidity on the measurement of surface roughness were investigated.The results indicated that the extended depth-of-field 3D microscope is an available and efficient method to measure the surface roughness of wood-based materials.Moreover,it was found that the high relative humidity exposure adversely inuenced the surface roughness of samples and the change of humidity had a greater impact on the uniformity of surface texture of the SP scrimber.It turned out that it is urgently necessary to consider the impact of relative humidity on the measurement process.
Keywords:Salix psammophila scrimber;surface roughness;relative humidity;stylus profilometer;extended depth-of-field 3D microscope
1 Introduction
Salixpsammophila(SP) is a kind of fast-growing sandy shrub widely distributed in northeast China.It has some excellent features such as hardy,drought-tolerant,high sand burial,etc.,which was often used for windbreak and sand fixation.According to incomplete statistics,there are about 450 000 t flat stubble of SP every year[1].In the past,most of these biomass resources were used as firewood with low value and wasteful utilization,and only a small amount was applied for medium density fiberboard (MDF),particleboard,pulp and paper,biomass fuel,chemical raw materials and wickerwork.
However,composite materials made from SP,termedSalixpsammophilascrimber (SPS),can greatly improve its added-value and utilization-rate.The manufacturing process of SPS has been explored in previous study[2],and the shape and size of SP fiber bundle have a great impact on the physical and mechanical properties of SPS.Surface roughness is an important parameter on generally evaluating the quality of wood surfaces,which directly affects the quality of surface finishing,adhesion and coating,glue type and consumption of paints or glues.In the previous study[3],the preparation of SPS through flattening and separation technology have been explored.And the mechanical properties,water resistance and surface properties have been carried on the preliminary inquisition.Although a conclusion of positive correlation between surface roughness and density was obtained,there has been no systematic research on the surface roughness of SPS so far.
At present,the measurement of surface roughness is mainly divided into two categories,contact type and non-contact type.Contact types of instrument for roughness measurement mainly include stylus profilometer (SPM) and tactile atomic force microscope (AFM).Non-contact types of apparatuses are laser interferometer (LI),laser microscopic system (LMS) and extended depth-of-field (EDF) 3D microscope.In earlier researches,the contact type like SPM was widely used in surface roughness mea-surement of wood products such as hardboard,MDF and other wood-based boards[4].In recent years,the roughness measurement has turned to three-dimensional (3D) assessment.Laser scanning technology is widely used for on-line monitoring of materials surface roughness currently.For instance,in a study by Alshibli et al.[5],surface roughness of three silica sands was measured by the optical interferometry method.Poon et al.[6]adopted SPM,AFM and non-contact optical profiler (NOP) to manifest the surface roughness of a glass-ceramic disk substrate and the AFM was concluded to be the most applicable surface measuring instrument of the glass-ceramic substrate.According to Funck et al.[7],the performance characteristics of a laser scatter for wood roughness measurement were discussed and a stylus tracing system was utilized for a comparison as well.In terms of the application of EDF 3D microscope,it mainly focused on the morphology recovery and roughness measurement of materials’ surfaces such as ceramic,metal,etc.[8-9].EDF 3D microscope has been used to evaluate the surface morphology changes of medium-density fiberboard and Korean pine during sanding operation.The depth of cut,groove area,pile-up area,and other related parameters can be accurately measured[10].However,there are limited studies on measuring the surface roughness of wood products via EDF 3D microscope and comparing the results with those obtained by traditional test methods.
According to previous studies,the environmental humidity has a great impact on the surface roughness of wood materials[11].Based on the results by Ozdemir et al.[12],particle board and MDF panels can be sensitive to fluctuations of relative humidity (RH) in surrounding environment.As the relative humidity levels changing from 65% to 85%,the surface roughness of panels increased greatly,which adversely influenced the adhesion strength characteristics.Therefore,it is of great significance to have a comprehensive evaluation of the changes of scrimber surface roughness in different humidity conditions with a quantitative method.
It is necessary to evaluate the scrimber surface roughness in three dimensions due to the anisotropic nature of biomass composite materials.The objective of this study was to evaluate surface roughness of SPS by using a new test approach (EDF 3D microscope).The influences of different humidity conditions on roughness measurement were also investigated.This work will provide fundamental information and evaluation methods for the surface properties of SPS.
2 Materials and methods
2.1 Materials
SP branches purchased from the sandy land of Xilinguole in Inner Mongolia,northern China,were used as raw materials (0.456 g/cm3density,54.6% moisture content and 10-21 mm diameter).The commercially available phenol formal-dehyde (PF) resin (trade name:P4970) was supplied by Guangdong Dynea Chemical Industry Co.(52.66% of solid content,68 mPa·s of viscosity,and 9.70 of pH).
2.2 Preparation of SPS
The SP branches were flattened and separated through a self-made fluffer machine along the longitudinal fiber direction.After cutting to 300 mm length and drying to 10% moisture content (MC) in an oven at (103±2)℃,the SP strips were immersed in the PF resin to achieve 17% resin content and dried again to 12% MC at (103±2)℃.The SP strips were weighted according to the setting density (0.95 g/cm3) and then paved along the fiber direction in the mold.They were then compressed at 170 ℃ and 5 MPa,and the pressure held for 15 min.The obtained SPSs with a dimension of 300 mm×170 mm×15 mm were conditioned in a chamber at 65%±5% relative humidity (RH) at (20±2)℃ for 2 weeks before testing.
2.3 Mechanical testing
The mechanical properties of SPS,modulus of rupture (MOR),modulus of elasticity (MOE),compressive strength (CS),and shear strength (SS) of samples were examined according to the standards of ASTM D3500,ASTM D1037,ASTM D3501 and ASTM D2344,respectively.The measured results were compared with existing common biomass mate-rials.
2.4 Measurement of surface roughness
The surface roughness of the sample was measured using the scanning probe microscopy (SPM,TIME3230,Beijing Time Peak Technology Company) and EDF 3D microscope (VHX-6000,Keyence) according to ISO 25178—71:2012 “geo-metrical product specifications-surface texture:areal—part 71:software measuerment standards”.With the base length and evaluation length of 0.8 mm and 5×0.8 mm,respectively,six surfaces of the sample (4 mm×4 mm) were used for the roughness measurement and average linear roughness values (RaandRz) were obtained by six linear areas in each surface (Fig.1).Therefore,a total of 36 linear areas and six areal surfaces were measured along the direction of the vertical fiber.There were three duplicates for each condition.The main measuring parameters wereRa,Rz,SaandSz.Ra(arithmetic mean deviation of profile) to examine the uniformity of the surface structure of the material.Rz(maximum height of profile) represents the degree of uniformity of the surface roughness distribution.Sa(arithmetic mean height of the scale limited surface) is the arithmetic mean of absolute of the ordinate values within a definition area.Szindicates the sum of the maximum peak height value and the maximum pit height value within a definition area.

Fig.1 The sample sketch of Salix psammophila scrimber
In order to avoid the possible surface mechanical damage caused by the probe,the EDF 3D microscope was firstly used to measure the roughness and followed by the SPM.The scan size was confirmed by the magnification of the optical system.The magnification of the objective lens used in the measurement was ×1 000 and the scan size was 4 mm×4 mm (Fig.2).Notably,in order to suppress the excess division (over-segmentation),the wolf pruning method was used to remove the areas where the height of peak area or the depth of valley area is below a certain threshold.And the threshold was the value of local peak/pit height divided by the maximum surface height (Sz) value (the default threshold is 5%).
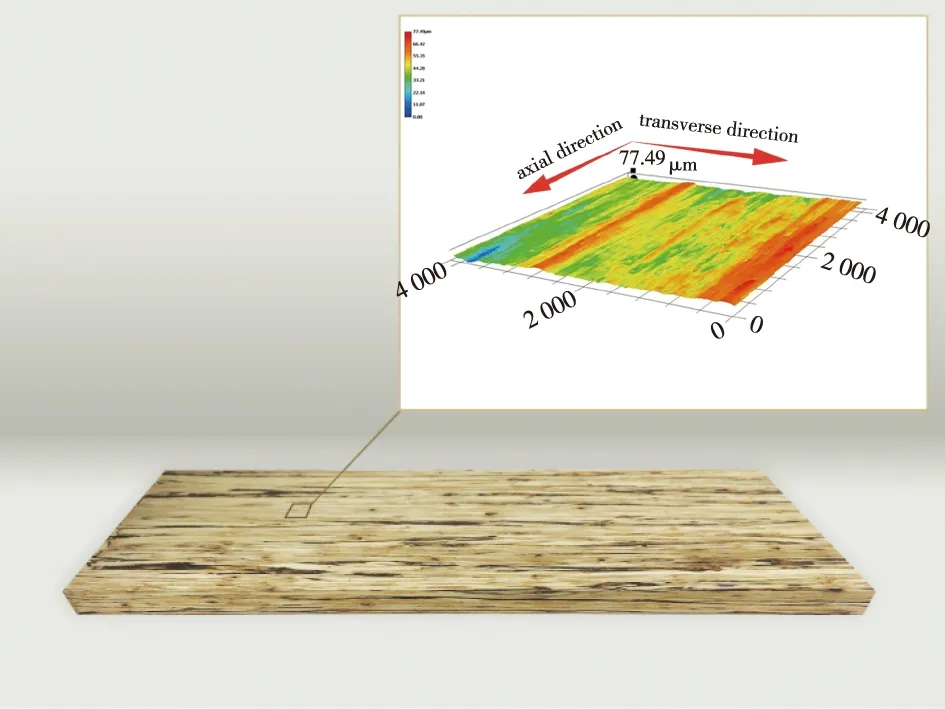
Fig.2 The picture of Salix psammophila scrimber and its magnified topography
After the initially measuring at 30% RH and 15 ℃,the sample was placed in a conditioning container with a saturated potassium bromide solution at 15 ℃ (the corresponding RH was 83%) until the weight remained unchanged basically.Measurements of surface roughness were repeated at the same points on the sample.
3 Results and discussion
3.1 The mechanical properties of SPSs
Scrimber is increasingly produced to be the popu-lar material with extremely high mechanical properties,in which,the specific strength is superior to those of many alloys.Table 1 presents that,as a new member of scrimber family,SPS also has the particularly excellent performance compared to many frequently used biomass composite materials.
Made from the same raw material,SP-based MDF[13]showed a considerably lower performance than SPS.The MOR (30.88 MPa) and MOE (3.1 GPa) of SP-based MDF were only about 1/6 of those of SPS (179 MPa and 20.9 GPa,respectively) with the same density[14].Compared with other scrimber materials[15-16]with the similar density,SPS also had outstanding properties.MOR,MOE and SS of SPS were much higher than that of the other two kinds of scrimbers,which may be ascribed to the higher cellulose content of SP (56.32%).Comparisons of selected mechanical parameters of SPS with those of common-used wooden engineering products were also conducted.With the similar density,the MOR of SPS was even 80% higher than that of Glubam[17],and the other mechanical properties were all in the considerably competitive positions.Moreover,the specific strength of SPS was significantly larger than that of all the other wood-based products and it was almost twice the specific density of mulberry scrimber[15],which was made of shrub as well.
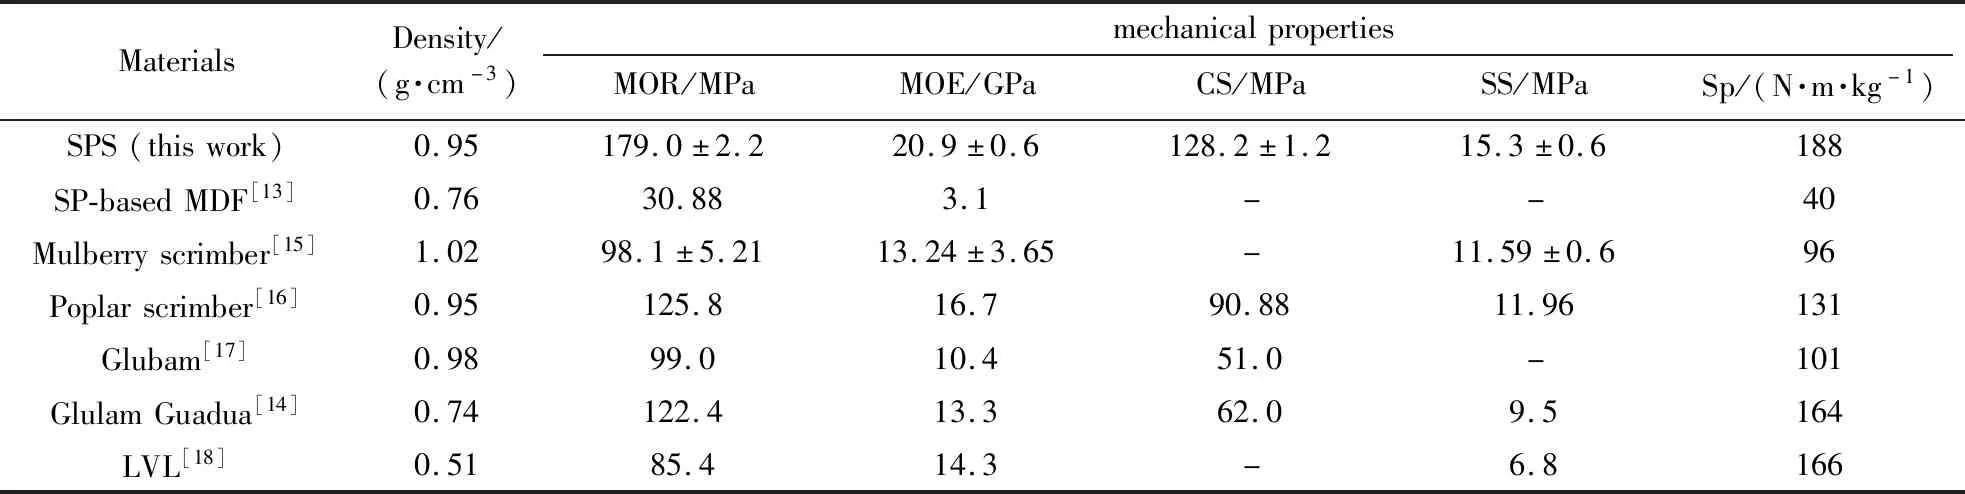
Table 1 The mechanical properties of SPSs and other common biomass composite materials
Apparently,it was noted that SPS has the larger strength values in almost all the mechanical properties.That was due to the a plenty uniform linear cracks after the flattening and separation process.Cracks were favorable to more uniform and deeper penetration of the PF resin,and intact directional fibers contributed to the excellent mechanical properties.The extra capacity and high value-added of SPS were attributed to the reinforced fibers of the raw material.As an interesting topic,SPS could be structurally beneficial to use SP as a promising alternative for existing biomass building materials.Furthermore,as focus is drawn to more sustainable construction practices,the utilization of the fast-growing biomass shrub material with highly renewable,low-embodied energy and high specific strength is beneficial to the natural forestry and building environment.
3.2 Comparison of the surface roughness obtained by two methods
Roughness is an important indicator for evaluating the surface properties of wood-based materials.At the same time,the surface roughness also reflects the quality and rationality of the processing machinery and tools used.For instance,according to a study by Vitosytè et al.,the results indicated that the surface roughness had a significant effect on the wettability and adhesion properties of wood[19].For the sake of the overall evaluation and application of SPS,the surface roughness was measured via two methods.The final values are listed in Table 2.
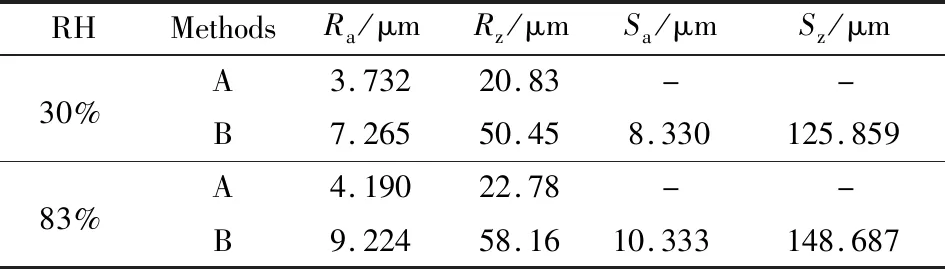
Table 2 The average roughness values obtained by two methods at 30% and 83% relative humidity (RH)
As seen in Table 2,the averageRaandRzvalues tested by SPM were 3.732 and 20.83 μm,respectively,while theRaandRzvalues tested by EDF 3D microscope were 7.265 and 50.45 μm,which were almost twice as much as those tested by SPM in 30% RH conditions.The difference in testing principles led to the dissimilarity of data.
The two-dimensional contour curve of the material surface obtained by the traditional probe type of SPM is presented in Fig.3a and the measuring principle is summarized as follows.The measured surface was contacted by a stylus of the instrument,and the movement of the stylus along the surface was tested at a certain speed.The stylus was made of diamond with the tip radius of 2 μm,of which the ideal shape was spherical cone.Due to the small peak valleys of the measured surface,the stylus moved vertically up and down along the profile while sliding forward,which actually reflected the measured surface profile.The contour signals from the stylus were recorded by a micro-processor equipped with a data display.The advantages of this measuring method were fast,convenient,of good repeatability and can be used for long distance measurement.But its mea-suring results were limited by the radius of circular arc of stylus.For some small concave valleys on surface,it was difficult for stylus to reach the bottom of ravine.What’s more,if the pressure was too large while the wood was too soft,stylus may also destroy the tested surface which greatly influence the accuracy of measurement.The stylus might be polished because it would wear away over time.Depending on the material and the shape of the target object,the abrasion was different.And different wave forms and values were produced by different pinhead shapes.In addition,large catheters were at risk of damaging the pinhead,and the biggest problem of this method was unable to measure fuzzing wood and sticky surface roughness.
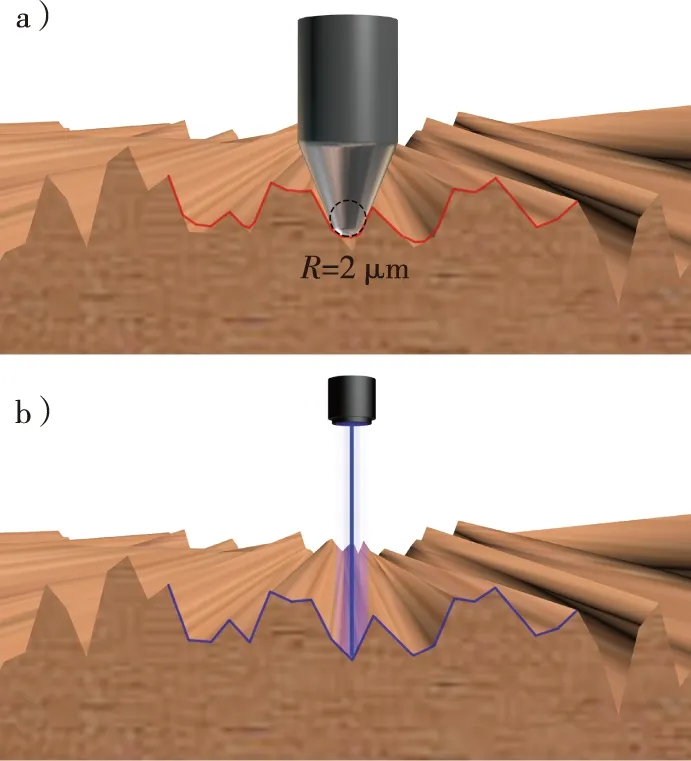
Fig.3 The principle diagram of two measuring methods
According to theSaandSzobtained by EDF 3D microscope,the value ofSawas slightly larger than that ofRawhileSzwas more than twice ofRz.The main reason of the difference between linear roughness and areal roughness was their essential distinction of measurements.Three-dimensional evaluation can obtain the coordinates of three directions in a certain area of the measured surface and the added dimension had the magnifying effect.
Compared with the mechanical access to surface contours by probe type,the EDF 3D microscope relies on an optical technology to gather surface topographic characteristics (Fig.3b).The precision of three-dimensional calculation and measurement depends on the magnification of observation and depth of field (DOF) of lens.The accurate depth from the defocus (DFD) method was used for surface information acquisition.As seen from Fig.4,DFD was a way to obtain the longitudinal parameters (Fig.4a) through the analysis of the blurry quantity of the two-dimension image (Fig.4b).Even if the two-dimension image did not have a complete focus,it can also be computed to obtain its height and synthesis,and the 3D display (Fig.4c) was performed with less sample data.Based on this principle,the surface removal volume of aluminum alloy was measured with the X-ray computed tomography and EDF 3D microscope in the previous study[20],and the measuring result was very close to the actual volume value.Since the three-dimension restoration was based on the blurry quantity of focus,the high magnification image with low DOF can display high precision surface morphology compared with the lower one.For instance,the focus was not indistinct because of the deeper DOF at ×20 magnification,but the DOF would become lower if the multiple rate increased.The SPM and EDF 3D microscope were used to measure the surface morphology and roughness of tooth in a previous report[21].It has been proved that 3D surface parameters can provide more precise picture of the surface and the roughness values obtained by the two methods were correlated to some extent.In addition,the 3D morphology of wide field of vision can be obtained via the function of splicing.Equipped with high sensitivity lens,it is convenient to take the actual appearance of targets as well as to observe and measure during scanning.The accurate test value and actual surface topographic were obtained by splicing and restoring through the platform moving.Linear and areal surface roughness within any part or any direction can be measured on the base of the stored 3D picture.The feature characterization of the sample is shown by 3D pictures,which is like a toolbox of pattern recognition techniques that can be used to characterize specified features on a scale-limited surface.The different colors showed the different heights of hill and dale on the surface.Blue area referred to the bottom of the ravine while the red one was the highest portion of the corresponding hill.It can be intuitive to demonstrate the concavo-convex state and the regulation of variety of definition surface.For the cracking or aging materials,the crack width and depth of valleys parameters can also be gauged and marked directly.The three-dimensional dynamic topography picture was saved,which can achieve multiple roughness editing on the sample surface,avoiding the limitation of single data.But the splicing process can be affected by the environment at high magnification,such as shaking or the longer splice time.To sum up,the method of EDF 3D microscope have certain requirements on the environment and magnification,but it could be a possible alternative for its convenience of operation,diversity of measurement and intuitiveness of observation.The current purpose of this study is to analyze the surface characteristics of the wood-based materials not only in measuring the surface roughness but also in the surface morphology using the optical imaging technology without contacting.
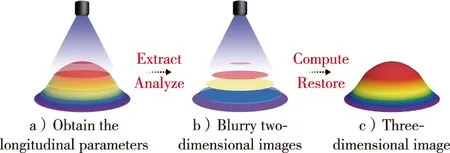
Fig.4 The principle diagram of DFD (depth from defocus) method
3.3 The effect of relative humidity on the surface roughness
Relative humidity has a great effect on properties of wood such as the surface roughness.Comprehensive evaluation of different measuring methods can be made by analyzing the surface roughness of materials under different humidity conditions.Table 2 presents the surface roughness obtained by the EDF 3D microscope and SPM at 30% and 83% RH.The roughness of six areal surfaces of scrimber in above-mentioned two conditions are shown in Fig.5 and Fig.6.
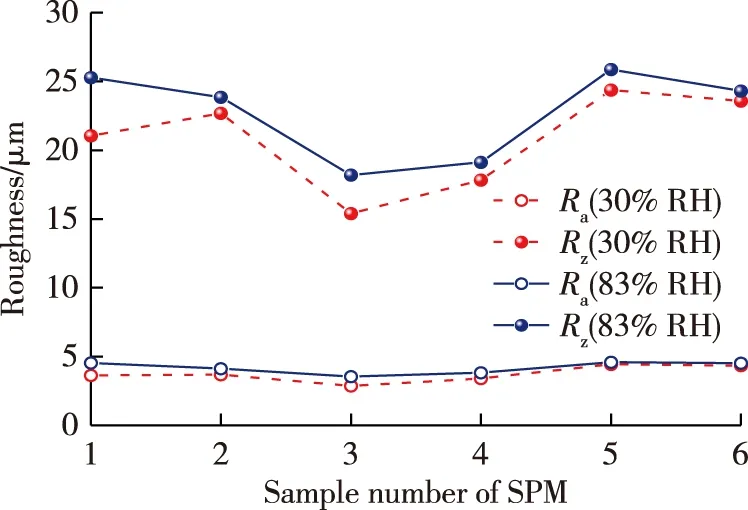
Fig.5 The picture of roughness obtained by SPM

Fig.6 The picture of roughness obtained by EDF 3D microscope
Both methods showed reasonably higher roughness values at 83% RH than those at 30% RH,which was consistent with previous studies[11-12].Test results provided by Ozdemir et al.indicated thatRaandRzof the MDF panels increased by 138% and 90%,respectively,as they were exposed to increased relative humidity levels ranging from 65% to 85%[12].In this study,with the change of RH,the parameter values of the arithmetic mean heights (RaandSa) obtained by the EDF 3D microscope at 83% RH were 26.97% and 24.05% higher than those at 30% RH,respectively.The lower growth rate of SPS compared with MDF panels was ascribed to the directional alignment of SP fibers,which contributed to the highly stability of surface quality.What’s more,the parameter values of the maximum heights (RzandSz) have variation ratio of 9.37% and 15.28%,respectively.It can be concluded that the effect of RH change on texture uniformity of material surface was more significant than that of the maximum height,and which was consistent with the previous research work[11-12].And the same results were found by the method of SPM.Unlike the higher change rate of the EDF 3D microscope,theRaandRzvalues of SPM only increased by 12.27% and 9.37%,respectively.As shown in Fig.5 and Fig.6,the SPM method appeared a better quality of repeat performance and EDF 3D was more likely to be affected by uncertainties.However,the method of the EDF 3D microscope had a relatively high sensitivity to evaluate the quality of a changing surface.
The surface morphology and contour curves of SPS are shown in Fig.7 and Fig.8.In the Fig.7 and Fig.8,the roughness of sample can be presented intuitively by the changing color.From the contour curve in the bottom of 3D morphology images,the uniformity of surface texture had a decreased tendency after humidification.This was because,on account of the capillary-porous nature,wood products often adsorb or desorb moisture to reach an equilibrium state in a certain humidity environment.The moisture absorption and desorption characteristics of wood lead to the following three phenomena.Firstly,due to the diffusion and infiltration of moisture accelerated by the swelling and shrinkage of wood,microcracks occurred in the process of the surface motion and the permanent deformation[22].Secondly,the samples absorbed water from 30% RH to 83% RH because of the increased steam pressure difference.Swelling of fibers caused a textured board surface,resulting in higher surface roughness value.Thirdly,after the flattening and separating,there were small fibers and chips in the process of cutting,which had tendency to rise moisture absorption when the humidity of surface increased.Overall,these results suggested that the EDF 3D microscope was a new alternative to present,measure and evaluate the surface roughness of biomass materials.

Fig.7 The picture of surface topography and roughness in 30% RH condition

Fig.8 The picture of surface topography and roughness in 83% RH condition
4 Conclusions
In this study,high-performance biomass composites with MOR of 179 MPa were manufactured fromSalixpsammophila.Its surface roughness was measured by the extended depth-of-field (EDF) 3D microscope and stylus profilometer (SPM) at different relative humidity levels.In addition,the principles,merits and demerits of the two methods were discussed in this study.The results indicated that the EDF 3D microscope had more intuitive map for multiple edit and measurement,but it was more susceptible to environmental humidity and the repeatability was poorer than SPM.Moreover,it was found that the surface roughness of the scrimber was reasonably affected by the relative humidity and the effect of RH change on texture uniformity of the SPS surface was more prominent than that of the maximum height parameters.