The effects of social security expenditure on reducing income inequality and rural poverty in China
2021-03-23
College of Humanities and Development,China Agricultural University,Beijing 100193,P.R.China
Abstract Social security has,as one of its primary aims,the provision of financial support to those deemed to be poor or facing the threat of poverty. Based on China’s national statistical data covering social insurance,social assistance,and social welfare between the period 1978–2018,this paper evaluates the effect of social security expenditure in reducing income inequality and rural poverty with cointegration analysis. It was found that there is a positive correlation between social security expenditure and the income gap of urban and rural residents in the long run,but the effect is very limited; nearly 99% of the changes of the urban–rural income gap come from its own contributions. Further research also shows that the elasticity of rural poverty incidence to social security expenditure is–0.2255,which indicates social security expenditure helps reduce rural absolute poverty. Based on these findings,the policy implications can be that much social security expenditure and a more equitable social security system should be encouraged. It will become one of the major anti-poverty strategies after 2020 in China when we win the battle against absolute poverty.
Keywords:social security expenditure,income inequality,rural poverty reduction in China
1.Introduction
The objective of the social security system is to maintain social fairness and stability and promote economic development. Over the past fourty years,China has built the world’s largest social security system,and social security expenditure has increased gradually (Zheng 2018). Different from the Organization of Economic Co-operation and Development (OECD) standards,the Chinese social security system consists of social insurance,social assistance,and social welfare and has been well-rounded developed since 2000 (Zheng 2019). The ratio of social security expenditure to gross domestic product (GDP) increased from 5.9%in 2008 to 11.5% in 2015 (Cha and Pan 2017),while in 2017,social security expenditure was the leading item in government expenditures (Zhanget al.2019). However,the effect of social security on the relief of social inequality is still a worthy topic.
Bridging the social gap amongst varied regions and groups refers to two aspects. On the one hand,reducing the number of poor living below the certain poverty line; on the other hand,narrowing the income gap between the rich and the poor. China has made remarkable achievements on rural poverty reduction over the past 40 years. The rural poverty headcounts decreased from 98.99 million in 2012 to 16.69 million in 2018,according to the National Bureau of Statistics of China (NBSC),while the rural poverty headcount ratio declined from 10.2% in 2012 to 1.7% in 2018. But when looking at the income gap change,particularly the income ratio of urban to rural residents,the story is different. The ratio changed from 2.57 in 1978 to 3.03 in 2002,and again 2.69 in 2018,which represented the rising income inequality since the reform and opening-up in China (NBSC 2019a).Hence,how to understand the role of social security in reducing social inequality in China has triggered a heated discussion. Theoretically,social security pursues fairness as an important way in income redistribution by using direct cash transfer as a tool to reduce income inequality. In the meanwhile,some specific social security programs provide the social safety net if one is falling below the minimum living standard associated with shocks from illness,natural disaster,or other risks.
From the empirical aspect,there are some studies on social security expenditure and the relief of social gap,which also cover issues of human well-being,poverty reduction and narrowing of the income gap. Experiences from highincome countries show a more significant association between social expenditures and life expectancy across the OECD countries. In contrast,lower expenditures on social policies in the United States may contribute to lessfavorable trends in life expectancy (Reynolds and Avendano 2018). He and Sato (2011) find that social security in developed countries contributes 74.6% to reducing the Gini coefficient. An empirical study across regions and countries shows that after social security adjustment,the Gini coefficient measured by residents’ disposable income has dropped by more than 35% in some countries of western and northern Europe,with the absolute values all falling below 0.3 (Xue 2013). Caminada and Goudswaard(2001) argue that the worsened income inequality in the Netherlands between 1981 and 1997 was caused mainly by unequal primary distribution and a decrease in social transfer payments,especially by the social security reform that led to the decline in fiscal expenditure. This proves that social security indeed depresses income inequality.Comparatively speaking,the contribution of social security in Latin American countries to the Gini coefficient is far less than that in developed countries. Jesuit and Mahler(2004) find that social security’s contribution to the decline of the Gini coefficient in Latin American countries is about 15%. However,transfer payment in education and health can reduce inequality more than cash transfer payment(Benekeet al.2017).
As for the impact of social security policies on poverty reduction,research based on micro-data at the level of households shows that although social security is helpful to poverty reduction,the effects differ in various households of different countries. The study in India proves that five programs consisting of school meals,child care services,employment guarantee,food subsidies,and security pensions can be seen as partial foundations of the social security system that have an important contribution to human well-being (Dreze and Khera 2017). An empirical study at the household level in Vietnam shows that social security(including pension and social assistance) significantly increases farmers’ expenditure,especially non-food expenditure,and has a significant poverty reduction effect on farmers (Cuong 2013). Devereux (2002) explored the impact of social safety nets on reducing chronic poverty in three southern Africa countries. The results show that Namibia’s pension program,Mozambique’s direct cash payment to the urban poor,and Zambia’s intervention program to provide public employment have achieved positive poverty reduction effects. Hence,similar social protection nets in transfer payment can achieve social protection and promote safety. Besides the specific spending on social programs,the research from Chriest and Niles (2018) explores the influence of social capital on the U.S.rural community responses to extreme weather events. They find that communities with high levels of social capital prior to the extreme weather event had effective actions in improving and stabilizing community food security immediately after the event. This gives us an important reminder that rural communities or villages are key actors when coping with shocks from natural disaster,pandemic or other sudden events (Luoet al.2020). The research results of Chenet al.(2019) based on the sample survey of data from the National Bureau of Statistics of China in 2015 show that the urban poverty rate has dropped from 17.0 to 7.2% after the low-income population received the Chinese urban minimum living allowance. However,the effect of the Chinese rural minimum living allowance system (Dibao) on poverty reduction in rural areas is not as much as urban’s.The incidence of poverty in rural areas was 14.4% at first,and the incidence of poverty dropped to 10.6% after the poor groups in rural village got the Chinese rural minimum living allowance.
When we summarize the previous studies,there are two research characteristics to be found. First,a great deal of studies focus on the single objective of social security policy,either income inequality usually represented with Gini coefficient or poverty reduction indicated with the household’s income. For example,some researchers examine the relationship between social security level and the income-based Gini coefficient to evaluate social security expenditure’s role in adjusting income redistribution.Other researchers assess the impact of social security policies and programs in the form of transfer payments on farmers’ income and consumption to find the impact of these policies and programs on poverty reduction. Second,both macro-and micro-level researches are included in the existing literature. Macro-level research focuses on the comparative study of countries or regions and pays more attention to the relationship between social security expenditure and economic growth to assess whether social security policies are compatible with the national strength. Micro-level research more often uses householdlevel data to assess the specific impact of public transfer payments on recipients’ income and consumption. Yet,few studies combine social security policies with income distribution and poverty alleviation; in particular,studies that comprehensively evaluate the effects of China’s social security policy in the past 40 years of reform and opening-up are rarely seen. There are two constraints that cause this. First,it may be due to the limitation of data. In China,social security management involves different government departments,including the Ministry of Finance,the Ministry of Human Resources and Social Security,the Ministry of Civil Affairs,and the National Health Commission. Each department independently accounts for its income and expenditure,so it is difficult to obtain comprehensive and consistent data. Second,the historical division of China’s urban and rural social security systems also makes it difficult to have a unified evaluation of social security expenditure. Considering the above limitations,we empirically analyze the dynamic relationship between social security expenditure (SSE) and the urban–rural income gap(URIG),and the relationship between SSE and rural poverty reduction in the period of 1978–2018,based on the narrowsense SSE statistical data and by the cointegrated analysis.Then we put forward some suggestions about the role of social security in solving relative poverty after the year 2020 according to the empirical analysis results.
The remainder of this paper is organized as follows:The next section provides the data and a brief discussion of the unit root test and the cointegration analysis. Section 3 provides empirical results.Section 4 presents discussions.Finally,the last section offers conclusion and policy implications.
2.Data and methods
2.1.Data and variable definitions
In this paper,we use two variables to demonstrate the effect of SSE on the relief of social inequality. One is the urban–rural disposable income ratio,which reflects the URIG,and the other is the rural poverty headcount ratio (RPHR),which was released by the National Bureau of Statistics of China according to the certain poverty line (NBSC 2019b).The basic variable is SSE,and the sample interval is from 1978 to 2018.
China’s current social security system is mainly composed of four items,namely social insurance,social welfare,social relief,and social special care. In China’s relevant statistical yearbooks,social insurance and social welfare usually mix with each other,and the pension insurance benefits for retired and working employees are calculated separately.The data used in this paper are from theFinance Yearbook of ChinaandChina Statistical Yearbookover the years.In and before 2006,SSE was the sum of pension,social welfare relief,and price subsidies. Starting from 2007,the statistics cover social security and employment expenditures including administration fees,financial subsidies to social insurance funds,retirement pension for retirees of administrative institutions,employment subsidies,pension for a bereaved family,retirement settlement,social welfare,undertakings for the disabled,natural disaster relief,Red Cross undertakings,minimum living allowance,temporary relief,support for extremely poor people and other living assistance. All expenditures can be classified into four types:social insurance,social assistance,social welfare,and other expenditure items.
The disposable income data of urban and rural residents come fromChina Statistical Yearbookover the years. The data on RPHR in China come fromPoverty Monitoring Report of Rural Chinareleased by the National Bureau of Statistics of China. It should be noted that due to the adjustment of the rural poverty standard by the Chinese government in 2011,the current poverty standard,which is 2 300 CNY per capita calculated per annum based on the price level of 2010,is higher than the line of 1.9 USD per capita a day used by the World Bank for the global poverty monitoring but lower than the line of 3.2 USD per capita a day representing moderate international poverty level.It is clear that this national poverty line defines China’s rural absolute poverty instead of relative poverty,either urban poverty (Wanget al.2015; Xianet al.2016). The time coverage of the data obtained on the RPHR ranges from 1978 to 2018,while we dealt with the missing data predictably in light of the time trend. In addition,the data on RPHR from 2000 to 2010 are obtained according to the old poverty line of 1 196 CNY,which is equivalent to 180 USD per capita calculated per annum. Hence,in the analysis of this paper,the data on the poverty incidence of consecutive years under the two standards are used.Poverty between 1978–2018 is the rural poverty incidence under the current standard,recorded as H1,while the poverty of 2000–2010 is the rural poverty incidence under the old standard,recorded as H2.
The cointegration analysis consists of four steps. First,we conduct a unit root test to diagnose whether the time series data are stationary or not. Second,we use EG-ADF(EG-Augmented Dickey–Fuller) test developed by Engle and Granger (1987) for the cointegration relationship. Third,we establish the Error Correction Model (ECM) to examine for short-run and long-run causalities between two sets of variables,SSE and URIG as well as SSE and RPHR. Fourth,the impulse response function and variance decomposition are followed. To eliminate the heteroscedasticity of the variables as far as possible,the variables take a logarithmic form,i.e.,SSE takes the logarithmic form,which denotes lnSSE,URIG takes the logarithmic form,which denotes lnURIG,and RPHR including H1 and H2 are in logarithmic forms as well.
2.2.Unit root test
In order to judge whether the time series data are stationary,the ADF unit root test is used in this paper. The variables lnSSE,lnURIG,and lnRPHRare tested for stationarity. If the time series data are non-stationary,then the Ordinary Least Square (OLS) regression will lead to false regression.If non-stationary time series data become stationary after the time trend is removed,for example,when the first-order difference of the time series is a stationary process,it is called First-order Mono-intergration time series.
Table 1 presents the unit root tests. At the 5% significance level,two series of lnURIGand lnSSEhave a unit root;and at the 10% significance level,the series of lnH2has a unit root. However,after first-order difference,the three series have no unit root at the corresponding significance level,i.e.,the first-order difference of the original series is stationary. Using these results,we proceed to test URIG and SSE as well as RPHR and SSE for cointegration in order to determine if there is a long-run relationship to control for in the econometric specification. Unfortunately,the seriesH1,a rural poverty rate covering 40 years,cannot pass the unit root test; it is impossible to carry out cointegration analysis onH1and SSE since 1978. While,the seriesH2passed the test. Therefore,we conducted the following analysis using the series H2 representing RPHR of 2000–2010.
2.3.Cointegration test and error correction model
As for the cointegration test,Engle and Granger (1987) put forward the EG-ADF test in 1987. The core idea is that although some economic variables have their own long-term fluctuation patterns,and if of the same order integration,there is a long-term stable proportional relationship between them; that is,there is a long-term stable equilibrium relationship between variables. The EG-ADF test method is suitable for the cointegration test of two variables. In this paper,the EG-ADF test is used to test the cointegration relationship between lnURIGand lnSSEand between lnH2and lnSSE,respectively. The two cointegration equations estimated by the OLS method are:
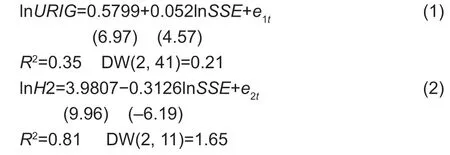
Table 2 gives the results of the unit root test for two residual series. Since the ADF values (absolute values)of the two residual series are both greater than the critical value at the 10% significance level,the statistics significantly reject the null of no cointegration,and it can be predicted that SSE and URIG are likely to converge in the long run.From 2000 to 2010,there is a cointegration relationship between SSE and H2 at the 10% level.
The above cointegration test shows a long-term equilibrium relationship between economic variables,but the short-term changes of variables are part of the adjustment towards this long-term equilibrium relationship.To reflect the impact of such short-term changes,an Error Correction Model (ECM) needs to be introduced to make the estimation more accurate and effective. The following is the estimated result of the error correction model. The differences of variables are used in the ECM models for the sake of deducting fluctuations of the data with time.
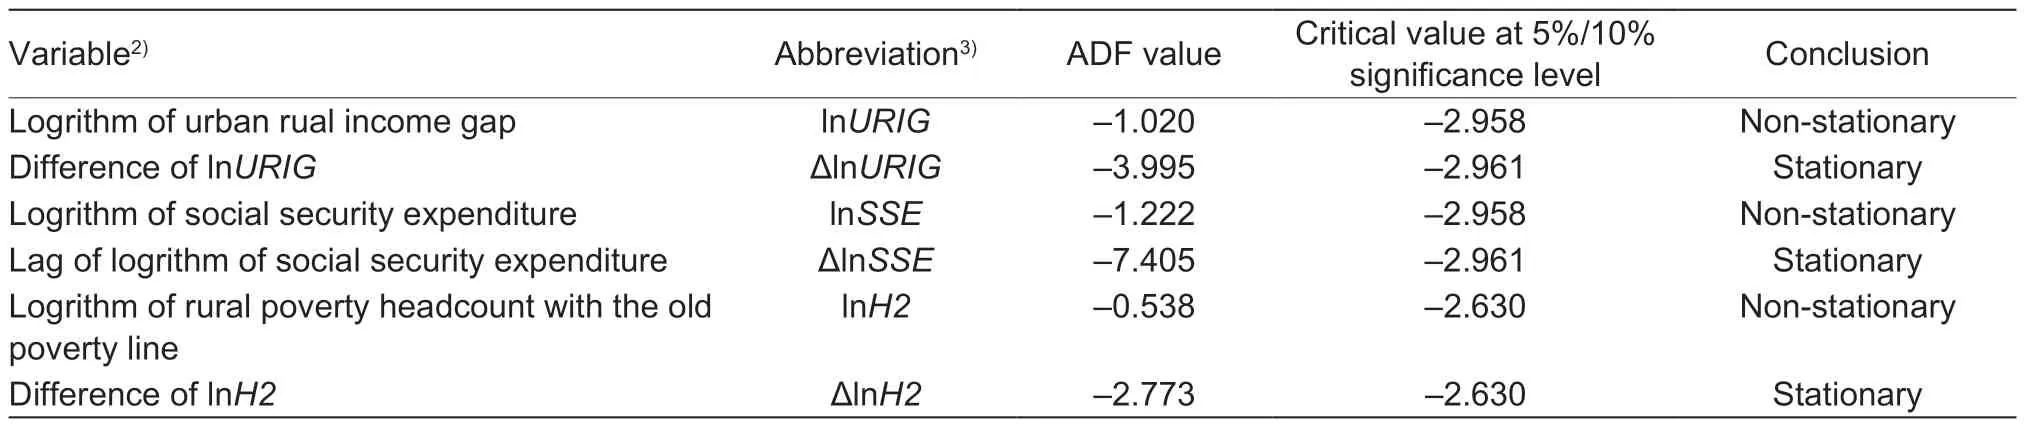
Table 1 Results of unit root tests1)
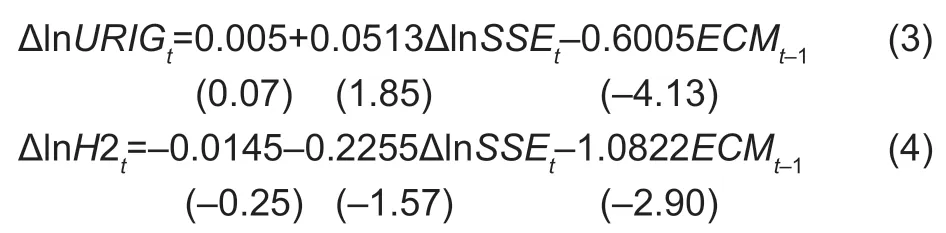
The error correction model (3) reflects the short-term fluctuation pattern of the urban–rural income ratio affected by social security expenditure and other variables. The result shows that there is a positive correlation between URIG and SSE with a coefficient of 0.0513. However,the coefficient of error correction term is–0.6005,which indicates that when the short-term fluctuation deviates from the long-term equilibrium,theECMcorrection term can pull the non-equilibrium state back to the equilibrium state with the adjustment strength of 0.6005. The coefficient is negative,indicating that the error correction term plays a negative role.
The error correction model (4) shows that H2 which represents RPHR of 2000–2010 negatively correlates with fiscal SSE. The coefficient is–0.2255,and the error correction coefficient is–1.0822,which indicates that when short-term fluctuations deviate from the long-termequilibrium,the ECM term can pull the non-equilibrium state back to the equilibrium state with the adjustment strength of 1.0822. The coefficient is negative,indicating that the cointegration relationship has reduced the incidence of poverty.
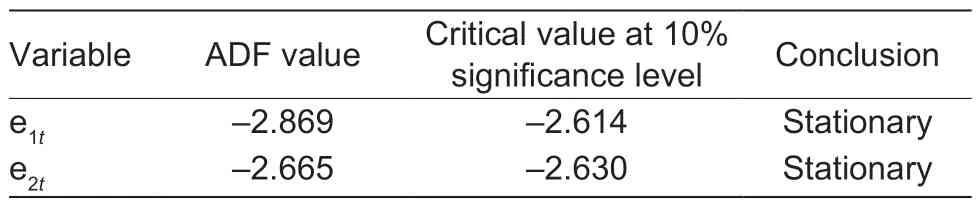
Table 2 Unit root test of residual series1)
2.4.Causality test
Once the two variables are cointegrated,the next step is to implement the causality test. We use the Granger causality test to check the cause-effect relationship between the two groups:URIG and fiscal SSE,and H2 and fiscal SSE. The test results in Table 3 show that SSE is the cause of URIG,and there is a one-way Granger causality between SSE and URIG. Similarly,the test results show that there is also a one-way Granger causality between fiscal SSE and RPHR from 2000 to 2010.
2.5.Impulse response function and variance decomposition
Based on cointegration analysis,we further observed the results of the generalized impulse response curves between variables. Fig.1 shows that after the variable lnURIGis impacted by a positive pulse of one unit of the variable lnSSE,the impulse responses that it reflects are all positive.This further confirms that fiscal SSE has a positive impact on URIG. Similarly,after the impulse response results betweenRPHR and fiscal SSE were observed,it is found from Fig.1 that lnH2began to respond in the second phase after it was impacted by the positive impulse of one unit of lnSSEfrom 2000 to 2010,which was a negative response. The third phase continued the trend,but the response was relatively weak and gradually stabilized. Hence,on the whole,the fiscal SSE has a negative impact on H2 in the study period,but due to the short time series,the impact is not as obvious as that of the first model.

Table 3 Causality test results
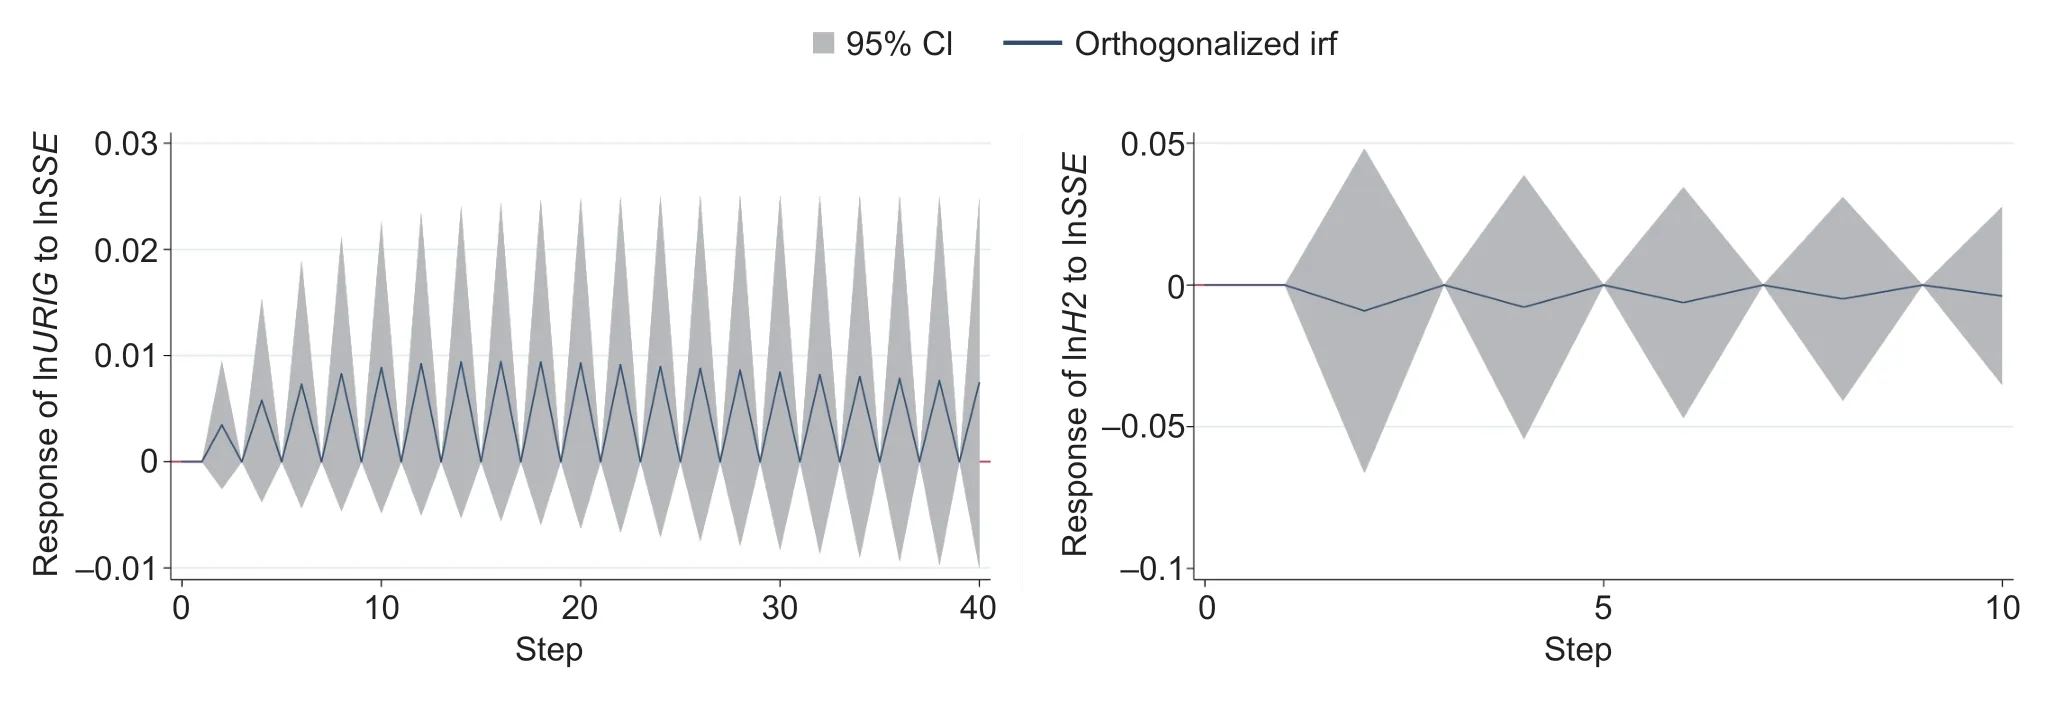
Fig.1 Impulse-response graphs for two groups of variables. SSE,social security expenditure; URIG,urban–rural income gap;H2,represents rural poverty headcount ratio of 2000–2010.
Variance decomposition is to evaluate further the importance of different structural impacts on the change of endogenous variables. In this paper,the results of variance decomposition of URIG and RPHR (Table 4) show that these two variables have greater contributions themselves,with 100% contributions in steps 1 and 2. With each increase of step,the contribution began to decline,and URIG decreased very slightly. By step 10,the contribution was still about 99%. The contribution rate of self-change of H2 representing RPHR of 2000–2010 has decreased since step 3,but the decrease after that is relatively weak,which is about 70% in step 9. It can be seen that nearly 99% of the changes in URIG come from its contributions,while the contribution of SSE to the changes is only 1%. Nearly 70% of the changes in RPHR from 2000 to 2010 are caused by its own changes,and the contribution rate of SSE to its changes is 30%.
3.Results
3.1.Relationship between URIG and SSE
First,the result of the empirical analysis shows that SSE has increased URIG during the study period. The cointegration equation demonstrates that the long-term elasticity of URIG to fiscal SSE is 0.052; that is,for every 1% increase in SSE,URIG will increase by 0.052%.Therefore,SSE increases the gap of wealth between urban and rural residents during the study period. Second,while the urban–rural income inequality is increasing,the ECM correction term in the error correction model can correct the non-equilibrium state caused by short-term fluctuations.The adjustment strength is 0.6005,and the coefficient is negative,which indicates that the cointegration relationship offsets URIG.
3.2.Relationship between RPHR and SSE
Since RPHR under the new poverty line was not passing the unit root test,the cointegration analysis on rural poverty headcount and social security expenditure cannot be done.However,we conducted the cointegration analysis on the correlation of RPHR measured by the old poverty line covering 2000 to 2010,and SSE in the same period due toH2’s passing the stationarity test. The result shows that at the 10% significance level,there is a certain cointegration relationship between SSE and RPHR. The cointegration equation shows that the long-term elasticity of the RPHR to SSE is–0.3126; that is,RPHR will decrease by 0.3126%for every 1% increase in SSE. Therefore,SSE will play a preferable role in promoting the reduction of RPHR in the study period. The error correction model results show that when short-term fluctuations deviate from the equilibrium state,the ECM correction term can pull it back to the equilibrium state with an adjustment strength of–1.0822.The coefficient is negative,indicating that the cointegration relationship has a negative effect on the incidence of poverty.
4.Discussion
According to the analysis results of impulse response function and variance decomposition,after URIG is shocked by a positive impulse of SSE,its response is positive,which further confirms that SSE has indeed widened URIG,but its impact is weak. This result is consistent with research that China’s social security expenditure had an adverse influence in reducing income inequality from 1993 to 2014,but the negative effect shrank after 2007 (Yang and Shen 2016). The evidence from Zhu (2017) also proves that socialsecurity expenditure in China has increased the income gap between urban and rural residents between 1982 and 2016.The change of URIG is mainly due to the variation in the income and income structure,and the impact of SSE on the change is only 1%. Taking the income gap from 2013 to 2018 as an example,URIG was 2.8 to 2.69 with a very slight decrease. The public social security expenditure had a very weak impact on urban and rural residents’ income gap. The statistical results show that less of SSE was spent in rural areas than urban areas,and the proportion was only 11.0%in 2002 (Tao 2002; Liu 2004) due to the urban–rural dual structure. The proportion of pension to retired people from administrative units to the total social security expenditure was 31.6% in 2018,which means the largest social security expenditure was caught by the urban people (MOF 2019).Another reason was that there was a big gap between urban and rural areas in some social security projects’ payment standards. For example,the monthly payment level of the the Chinese Dibao program for urban residents was 579.7 CNY (85.3 USD),while it was 402.8 CNY (59.2 USD) in rural areas by the end of 2018. Fig.2 shows that there is a converging trend for two lines indicating different payment levels in study period but the disparity still exists.

Table 4 Result of variance decomposition
Similarly,the results show that the RPHR in this period began with a negative response in the third phase after being shocked by a positive impulse of one unit of SSE and gradually tended to be stable. It means that SSE in this period has promoted the alleviation of rural poverty.Nearly 70% of the changes in RPHR are caused by its own changes,and the contribution rate of SSE to the changes is 30%. The reason is that during this period,the following social security policies had a positive impact on poverty reduction in rural areas:In 2003,the government launched the pilot work of the New Rural Cooperative Medical System,which would achieve full coverage by 2008. In 2007,the Chinese Dibao program targeting vulnerable rural people was implemented in rural areas and gradually replaced the existing assistance system for the low-income families.The statistical data from NBSC show that the percentage of transfer income to per capita net income in rural areas increased from 3.6% in 2003 to 8.2% in 2012,which was helpful to alleviate rural poverty in this period.
5.Conclusion
This paper constructs the cointegration analysis between SSE and URIG,and SSE and RPHR,to evaluate social security’s effect on the relief of social inequality. The ECM results show that the long-term elasticity of URIG to SSE is 0.0513. The elasticity of the RPHR to SSE is–0.2255,which indicates SSE increases the urban–rural income gap in the study period but promotes rural poverty reduction.
The Chinese government converges the payment level of some social welfare policies for urban and rural residents,such as basic medical insurance and endowment insurance.Yet,the gap of social security between urban and rural residents in terms of pension,health care security,and the minimum living allowance still exists. According to the European Union’s SSE statistics,China’s SSE level was 787.51 billion CNY in 2015,accounting for 11.5% of GDP.The government’s spending accounted for 37.9% of SSE while the SSE of the EU in 2014 was 401.91 billion euros,accounting for around 28% of GDP and the government’s spending accounted for about 51% of SSE. The comparison shows that China’s SSE level is lower than that of the EU as a whole. The policy objective of the social security system has not been realized,as this study proves.
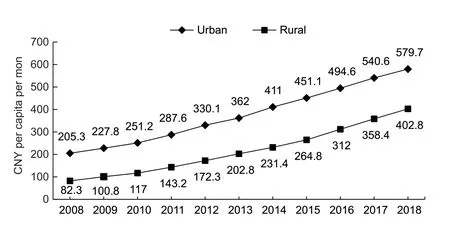
Fig.2 The Chinese minimum living allowance for low-income groups in urban and rural areas. Data resource:Statistical Bulletin on Social Service Development (MCAC 2018).
To conclude,much social security expenditure and a more equitable social security system should be encouraged. It would become one of the major anti-poverty strategies after 2020 when we win the battle against absolute poverty. First,it is critical to increase the proportion of SSE in financial expenditure,optimize SSE structure,and give full play to the function of social security. Second,further bridging the gap of social security like pension,the minimum living allowance,and health care between urban and rural residents is also a policy direction for alleviating relative poverty after 2020.
Acknowledgements
This research work was financially supported by the National Social Science Fund of China (16ZDA021) and the Humanities and Social Sciences Research Fund of the Ministry of Education of China (18YJA630135). We thank two anonymous reviewers for their useful comments.
Declaration of competing interest
The authors declare that they have no conflict of interest.
杂志排行
Journal of Integrative Agriculture的其它文章
- Paths out of poverty
- The power of informal institutions:The impact of clan culture on the depression of the elderly in rural China
- Does empowering women benefit poverty reduction? Evidence from a multi-component program in the lnner Mongolia Autonomous Region of China
- Status and path of intergenerational transmission of poverty in rural China:A human capital investment perspective
- The impact of the New Rural Cooperative Medical Scheme on the“health poverty alleviation” of rural households in China
- Synthesize dual goals:A study on China’s ecological poverty alleviation system