Leakage of an eagle flight feather and its influence on the aerodynamics∗
2021-03-19DiTang唐迪DaweiLiu刘大伟YinYang杨茵YangLi李阳XipengHuang黄喜鹏andKaiLiu刘凯
Di Tang(唐迪), Dawei Liu(刘大伟), Yin Yang(杨茵),Yang Li(李阳), Xipeng Huang(黄喜鹏), and Kai Liu(刘凯)
1College of Mechanical Engineering,Zhejiang University of Technology,Hangzhou 310014,China
2High Speed Aerodynamic Institute,China Aerodynamics Research and Development Center,Mianyang 621000,China
3Chengdu State-Owned Jinjiang Machine Factory,Chendu 610043,China
Keywords: biomaterial,feather,leakage,large prey,microstructure,barbules,cross-section,aerodynamics
1. Introduction
Skin friction drag reduction has been emphasized for decades to the practical values in aerial transportations. After millions of years of rigorous selection processes of evolution, some extraordinary abilities have been adapted to multiple examples with riblet surfaces that are optimized to control friction.[1]Thus,microstructures of bird feather were analyzed aimed at revealing the biologic features and the corresponding flow mechanisms responding to skin friction drag reduction.[2]Additives,gas injection,wall motion and electromagnetic forcing, etc. have been used as active methods of a drag reduction.[3-5]Methods of changing of surface chemistry,elasticity,shape and texture can also reduce the drag passively.Among the passively approaches, surface roughness and surface textures can reduce drag by transition delay,[6]separation delay[7]and turbulence modifications and have been widely investigated. Bird feathers have inherent abilities to reduce drag,as well as other functions including morphing and waterproofing,etc. A feather consists of both anterior and posterior vanes which are bisected by a central supporting shaft.[8]Surface microstructures of a bird feather were also investigated and a bioinspired bird feather was fabricated through hotrolling technology for drag reduction by Feng et al.[9]Elimelech and Ellington[10]studied the hand wing feathers of hummingbirds to be rough as a result of the protruding rachides,and bioinspired models were 3D printed to learn the roughness effects on boundary layers. Thereafter,particle image velocimetry,force measurements and the high-resolution boundary layer measurements were used to find that flow over rough wings was indeed laminar at a low angle of attack and a low Reynolds number,but became turbulent at higher values.[11]
Based on these nature observations, many artificial surfaces with riblets have been inspired and fabricated, which is regarded as a most portable way to be implemented in engineering field.[12,13]Inspired from bird flight feathers, several herringbone riblet textures have been designed. Angle between shaft and barbs,riblet height,groove depth and roughnesses are the most important parameters to the drag reduction. For instance,Chen et al.[8]investigated the herringbone riblet texture for turbulent drag reduction. Nugroho et al.[14]manipulated the whole boundary layer of the texture surfaces.It is impressive that a bird-feather-inspired herringbone riblet texture was investigated by Benschop and Greugem[15]for turbulent drag reduction using direct numerical simulations. The strong secondary flow was found to form over regions of riblet convergence/divergence, both mean and turbulent advection were intensified. Finally, it is found that the drag can be enhanced strongly to a maximum of 73%. The employment of convergent/divergent riblets in the texture was recommended to be detrimental to turbulent drag reduction.
Feathers have been evolved to balance demands of aerodynamics, mechanicals, and ecological behaviors.[16]One of the most intriguing questions in bird flight is the evolved structures of feather barbs for generating vortex, bearing load and maintaining shape.[17-19]A feather vane consists of parallel barbs attached obliquely to the shaft. The barbs are linked together by a set of finer barbs,called barbules. Gordon et al.once raised a mechanism of preventing the feather from cracking down its length during the stresses of flight.[19]In most cases, the feather is stiff enough to resist aerodynamic forces and keep its aerodynamic shape. Meanwhile, the feather is also flexible enough to preserve its fracture.[20]As the cross section of the shape of flight feather shaft, it transitions from round to rectangular at about 20% along the cross-sectional length, which ensures the tailoring of torsional stiffness and flexural stiffness. However, the rachises of birds exhibit various structural differences between species, more differences between owl and pigeon can be found in Ref.[21]. The rachis is composed of cortical ridges surrounded by cortex. The cortex, accounting for most of its tensile stiffness, makes up the lower and upper structural surfaces of the rachis and barbs.[22]Fine microfibrils, surrounded by an amorphous protein matrix,was found as a framework of β-keratin.[23]The stiffness is achieved by the efficient bonding between the polymeric filaments of β-keratin and amorphous polymer matrix.[24,25]The transmission electron microscopy(TEM)analysis on chicken and seagull feather rachises has shown that the β-keratin was composed of a framework of fine microfibrils(approximately 30 angstroms in diameter),in which the long protein filaments were surrounded by an amorphous protein matrix.[26,27]
Barbs, which can be simplified to foam-filled asymmetrical beams for mechanical engineering,branch from a rachis side by side. Barbules, categorized as proximal barbules and distal barbules,branch from barbs to interlock with each other using tiny hooks and grooves. The outward sliding of the barbules in the grooves of the juxtaposed barbs composes an important adhesion mechanism. Tarah et al.[28]proposed a straight 3D barb model with hooked proximal barbules and grooved distal barbules to explain how barbules connect with each other. The observation on cross sections of untested feather barbs has shown that the barb is highly asymmetric when it is close to the rachis. Toward the tip, it become smaller and more symmetrical,as previously observed by Piao et al.[29]and Proctor et al.[30]Foam core cells were found to be most diverse in size between the center of the barb and rachis,whereas they were homogeneous in size at the tip. The similar structure was also observed in the porcupine quills. In large cells, large areas of foam surrounded with cortex allow the barb to reduce the material weight but to maintain strength.The ratio of the cortex area to foam core area was found to range from 0.7 to 2.3.[31]Larger ratio and thicker cortex walls appear towards the end of the tip,which compensates for small cross-sectional area for bearing air loads. The cross sections of a particular barb were examined, however, the variation of cross sections along the feather rachis has not yet been measured.
Recently, applications of porous materials to the body have been researched.[32,33]Investigations on the advantages of porous materials to control boundary layers have proofed that porous coating can reduce vortex energy to decrease pressure fluctuation on body surface.[34]Pressure gradient allows the flow to penetrate pores, leading to local blowing and suction.[35]There is a limited number of experimental studies but a preponderance of numerical studies on the fluid dynamics.Flow at both lower Reynolds number and higher Reynolds number has been studied by some researchers. It was found that pressure coefficient can be either the same or much larger than that of a bare cylinder at lower Reynolds number less than 40. On the other hand,the permeability and thickness of a porous layer were found to the determining factors in the reduction of the lift coefficient. DNS and LES simulation methods were used by Naito and Fukagata[36]to find that the flow stabilization is more apparent at higher Reynold number. The Reynolds-averaged Navier-Stokes method was also used to indicate that the porous effect can modify the flow characteristics of near wake.[37]Above all,dominant frequencies of flow,velocity distributions and aerodynamic forces of body can be changed significantly by porous materials. The influences of porous feather on the aerodynamics should be investigated.
Above all, much work has been focused on microstructures of feathers and influences on the aerodynamics. However, mechanical behaviors of riblets and barbules of large bird of prey have been observed to be different from other small birds according to our previous research.[38]On the other hand, microstructures of feathers can have great influence on aerodynamics based on the investigations of riblet shape, roughness, etc., neglecting the penetrating effect through a feather which is often the case for enormous number of apertures existing between barbs. Thus,the microstructures of barbs and the leakage rate of feather of large bird of prey,as well as their influences on aerodynamics during flight, are the main topic of this paper.
2. Feather specimens and experimental setup
2.1. Cross section shape captures
Much work has been concentrated on the surface microstructure of the feather. However, less attention was paid to its cross-sectional shapes. To reveal the cross-sectional shapes of feather barbs, primary feathers of a golden eagle were bought from the Zhejiang Museum of Natural History with a rachis length of approximately 515 mm, as shown in Fig.1. The golden eagle is a large bird of prey owning quite excellent flying abilities, such as hovering, perching and attacking. The barbs were manually cut at 5%,20%,40%,60%,80%along the rachis,and then each barb was cut at 5%,25%,50%, 75% and 95% positions to obtain the cross-sectional shapes,as listed in Table 1. The cut barbs were sectioned into 3 mm×5 mm to observe the structure of feather. No reagent or drug was used during the process. A local coordinate was placed on the feather to represent the characteristic parameters with rachis (R) axis along the rachis and barb (B) axis along each barb.
To observe each cross-sectional shape, an experimental setup by combining an in situ stretching device and Y480 microscope was performed. The microscope combining with a 16 Megapixel CCD camera was used. Before scanning, the specimens were adhered to a microslide with ergo 9988 which can provide a high adhesion to glass, metal, feather. Parallel lights were arranged at the bottom of the specimen. To avoid the shadow of the specimen,each barb was cut less than 5 mm in length. During measurement, each section was moved to the right position to capture its shapes.

Table 1. Relative stations of each section along both the Rachis(R)and Barbs(B).

Fig.1. Scanning sections of the barbs of the primary feather bought from the Zhejiang Museum of Natural History.
2.2. Leakage experiment
Aquila Chrysaetos is a large bird of prey owing quite excellent flying abilities such as perching, fighting. Several primary feathers of an Aquila Chrysaetos were bought from the Zhejiang Museum of Natural History with a rachis length about 500.5 mm.Barb specimens at 20%,35%,51%,65%and 80%rachis stations of the feather were manually cut,noted as cases (a)-(e), as illustrated in Fig.2. Barbs near the rachis,whose barbules were stocky and connecting forces, were expected to be large enough for measurements, and were sampled into several specimens for tunnel testing. The testing was manufactured with a 20 mm×20 mm cross-section(accuracy,0.1 mm), as shown in Fig.2. Each specimen was cut from the feather with a size larger than 20 mm×20 mm. Then each specimen was clamped in the test tunnel, as shown in Figs.2(a)-2(e). The manufacturing accuracy of the tunnel ensures that the testing accuracy is dependent on machining accuracy rather than specimen accuracy. In order to protect the connecting force between barbs, no reagents or drugs are applied on the specimens.
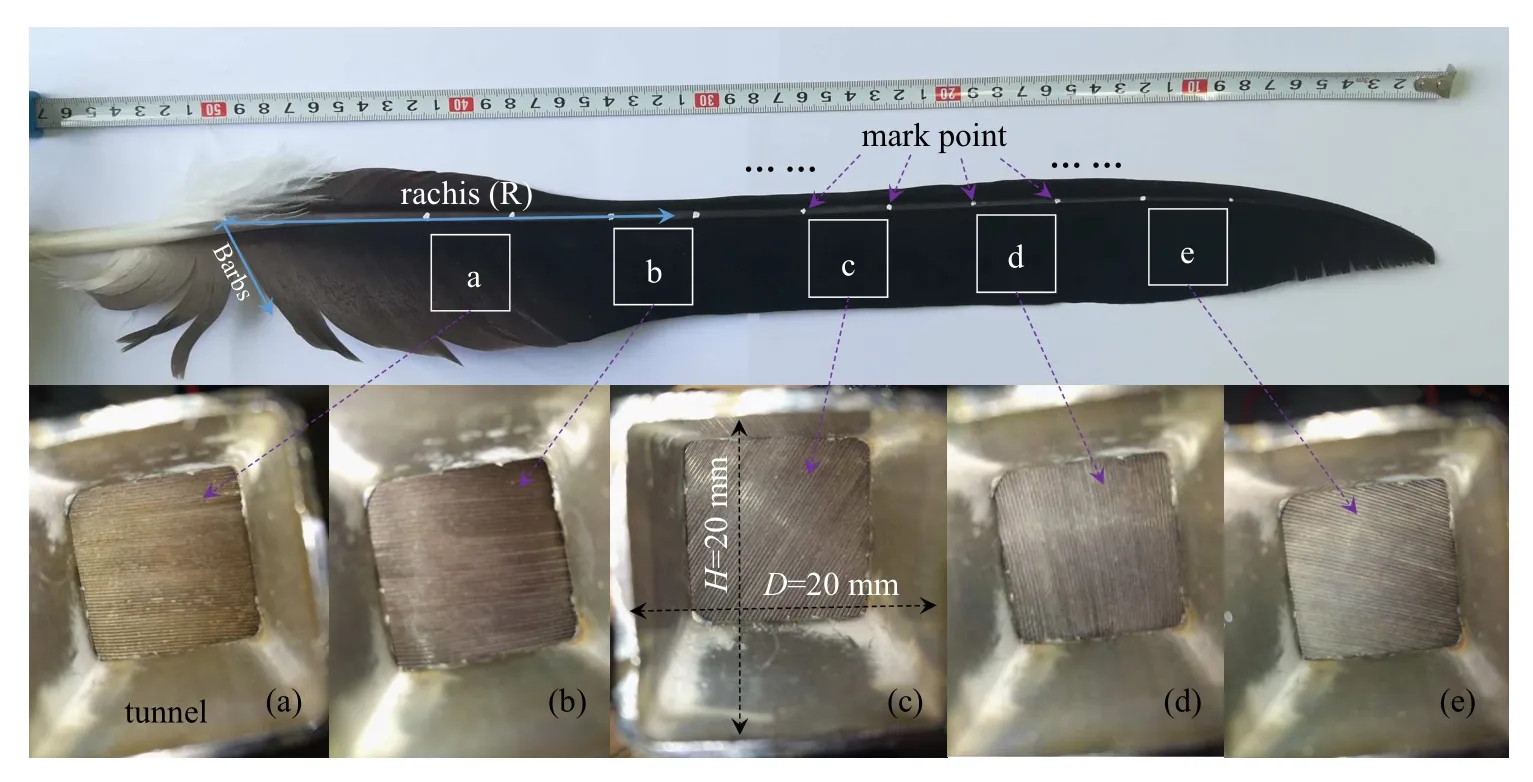
Fig.2. Feather specimens for the leakage experiments.
To evaluate the leakage ratio of a feather, a measurement setup system was developed by combining a test tunnel, a piezometer(measurement accuracy, 0.1 Pa), a flowmeter(measurement accuracy, 0.01 L/min), a buffer tank, an air compressor, etc., as shown in Fig.3. Comparative experiments at different stations of the feather with herringbone riblets were performed in an air tunnel.The buffer tank that was used for the experiments has good flow characteristics: stable pressure,low influence of sound and vibration from the environment.The inner diameter of pipe is D=8 mm,the volumes of the air compressor and the buffer tank are 5 L and 8 L,respectively. A piezometer,with range from 0 Pa to 500 Pa,was connected with a buffer tank to measure the pressure just before a feather specimen. The length L1of test pipe between the tunnel and the buffer tank is 0.1 m,which is small enough so that the pressure drop in the pipe is negligible. The test pipe length L2between the buffer tank and the air compressor is 1.5 m. Because the test tunnel is located downstream of the pipe inlet,above all the air quantity leaked from a feather specimen is quite small,the air is considered to flow at a laminar situation. Here,all measurements were obtained at a room temperature about 15◦C.
Before measuring,a feather specimen was clamped by the two neighboring tunnel parts and then adhered with ergo 9988.Then foam glue was used to cover the outside of the whole tunnel to ensure the air not to leak from the junctions,as illustrated with purple color in Fig.3. During the test,the throttle valve was modulated precisely to fill the buffer tank and hold the pressure at a desired value. Thereafter, air leaked from the specimen, the volume of the buffer tank is large enough to stabilize pressure the buffer tank. After a stable flow was achieved,the flowmeter was recorded. It should be noted that air was estimated to separate neighboring barbs at a large pressure. Thus,the pressure of the buffer tank was increased step by step from 0 Pa to 500 Pa.
A numerical tunnel was established to study the leakage of the specimen, as shown in Fig.3(f). A uniform total pressure was specified at the inlet boundary. A pressure outlet of 0 Pa is specified at the outlet. No-slip wall boundary condition was applied on the tunnel surface. On the other hand,the feather specimen was simplified to a porous zone.
夏秋季节温度较高,雨水多,湿度大,水稻秧苗栽插密度过大,并且通风条件和透光条件相继变差,大水深水灌溉,低处积水,增大湿度条件,氮肥再偏高,多年发病较严重的田块均为发病原因。这样水稻从分蘖盛期开始发病,促使病情发展加快,孕穗期前后都是发病高峰期。
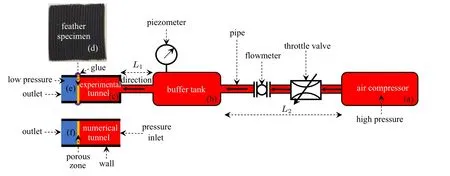
Fig.3. Setup configuration of the experimental and numerical tunnel of the leakage test.
3. CFD methods for predicting the leakage rate and aerodynamics
3.1. CFD method
The flow and the aerodynamic forces acting on the flies or birds can be computed using the CFD method, which has been validated in our previous research.[39]The governing equations are the impressible Navier-Stokes equations which are solved using Fluent (Fluent Inc., USA). The SIMPLEC algorithm is used for pressure and velocity coupling.Pressure based solver was chosen with explicit formulation.Space discretization scheme of pressure equation used secondorder,and discretization scheme of momentum used the Quick scheme. Because the air quantity leaked from a feather specimen is quite small and no obstacles existed for air to pass around, the air is considered to flow in a laminar situation.Thus,the laminar model was used in simulations.
3.2. Deriving the porous coefficients based on experimental pressure and velocity data
The Superficial Velocity Porous Formulation was used for the porous media models with the ANSYS Fluent software.[40]The superficial phase velocities were calculated based on the volumetric flow rate in a porous region. The feather specimen was simplified to a porous media in the tunnel. A porous medium is modeled by the addition of a momentum source term to the standard fluid flow equations. The source term is composed of two parts:a viscous loss term and an inertial loss term:

where S is the source term in momentum equation(only x direction is considered in the current experiment),|v|is the magnitude of the velocity,α is the permeability,and C2is the inertial resistance factor. This momentum sink contributes to the pressure gradient in the porous cell, creating a pressure drop that is proportional to the experimental fluid velocity in the cell.
Experimental data, in the form of pressure drop against velocity through the porous component, was extrapolated to determine the coefficients for the porous media. Pressure drop across a porous medium of thickness(Δn)was specified as

where ΔP is the pressure drop and v is the velocity. Thereafter, coefficients a and b can be optimized using the traditional least square method based on the tested ΔP and v. Note that a simplified version of the momentum equation, relating the pressure drop to the source term,can be expressed as

where Δn is a porous media thickness. Hence, comparing Eqs.(1),(2)and(3)yields the following coefficients:[41]
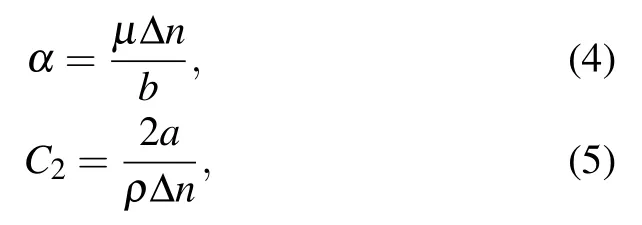
where coefficients α and C2are parameters used in the porous media model in the ANSYS Fluent software.
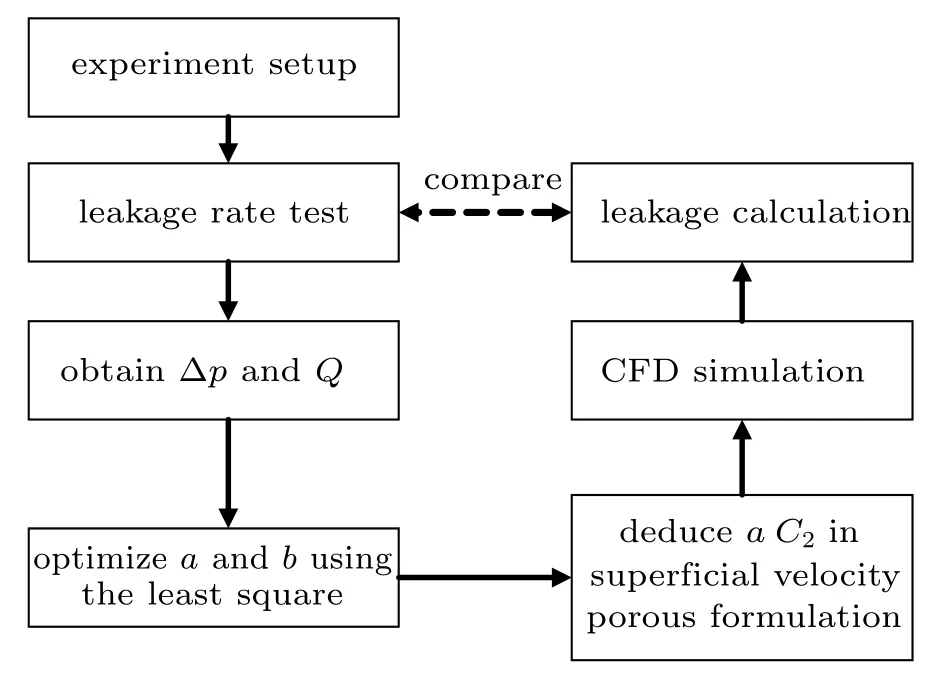
Fig.4. Flow diagram of the leakage experiments.
3.3. Aerodynamic performance prediction with the porous model
The flow and the aerodynamic forces acting on flies or birds can be computed using the CFD method. In contrast to the laminar model used in the leakage prediction,the transition SST model is used for the turbulence modeling considering its higher accuracy in the simulation of the unsteady flow. Then,an O-block technique was used to construct the mesh of the bionic airfoil as shown in Figs.5(a)-5(c),which has been validated in our previous research. In order to study the leakage effect, the flight feather was simplified to a porous zone with the same leakage rate measured by the leakage experiments,as shown in Figs.5(d)and 5(e).

Fig.5. Mesh of the bionic airfoil: (a)the global view;(b)and(c)without porous feather;(d)and(e)with a porous feather.
4. Results and discussion
4.1. Cross section shape of the barbs
The specimens tested in Section 2.2 were cut to show the cross-sectional shapes. The shapes of each cross section listed in Table 1 are presented in Fig.6. N represents the normal direction to the feather plane, while T represents the tangent direction. It is shown from the figure that the flight feather is asymmetrical and it gradually becomes thinner from feather shaft to feather outer fringe. A λ-like morphology with a tiny hook structure can be found at the right feet of the λ. Two branch points can be observed in the section. The point 1 appears at the intersection of a barb riblet and a proximal barbule, while point 2 occurs at the intersection of a barb riblet and a distal barbule. The tile angle α1in the cross section is about 30.0◦. As shown in Fig.2,the distal barbule spirals in a 3D way with both tile angle α (about 55.3◦)and tile angle β(about 57.9◦).
To quantify detailed structural value of herringbone riblets of barbs, the length between the head of λ section and branching point 1 was marked as D1. The distance between neighboring barbs was labeled as D2,while the length between the branching point 1 and 2 was marked as D3, as shown in Fig.6(1-1). A regular distribution can be observed for D1,as shown in Fig.7(a). Along the feather rachis, the maximum length of D1,ranging from 263µm to 265µm,appears at 1-1,1-2 and 1-3 sections, followed with 244 µm for 1-4 section and 144µm for section 1-5. Along the barb direction,the observation of cross section of the barb apparently shows that the riblet depth dramatically varies from the shaft to outer fringe despite of the same barb. The largest length of D1 appears at the root of each barb,while it becomes tiny from the barb root to tip. Taking the cross section of R2 for example, the gradient change of feather thickness consequently results in the riblet depth gradually increasing from outer fringe(38.2µm)to feather shaft(263.4 µm). The smallest D1 were measured at section 2-5(15.8µm)and section 5-5(17.6µm),in which the barb was the shortest. Contrary to the length distribution of D1,the length of D3 was distributed in a random way with a narrow region (56 µm-88 µm). The similar narrow region ranging from 101µm to 136µm can also be observed for D2(except the barb in the first rachis station(R1)). Thus, the riblet spacing between neighboring barb shafts was expected to be almost the same in the whole feather,resulting in the parallel arrangement of barbs with a tilt angle of 40.2◦close to the result in Ref.[24].

Fig.6. Cross-sectional shapes of the barb riblets at different stations and instructions of cut-plane.
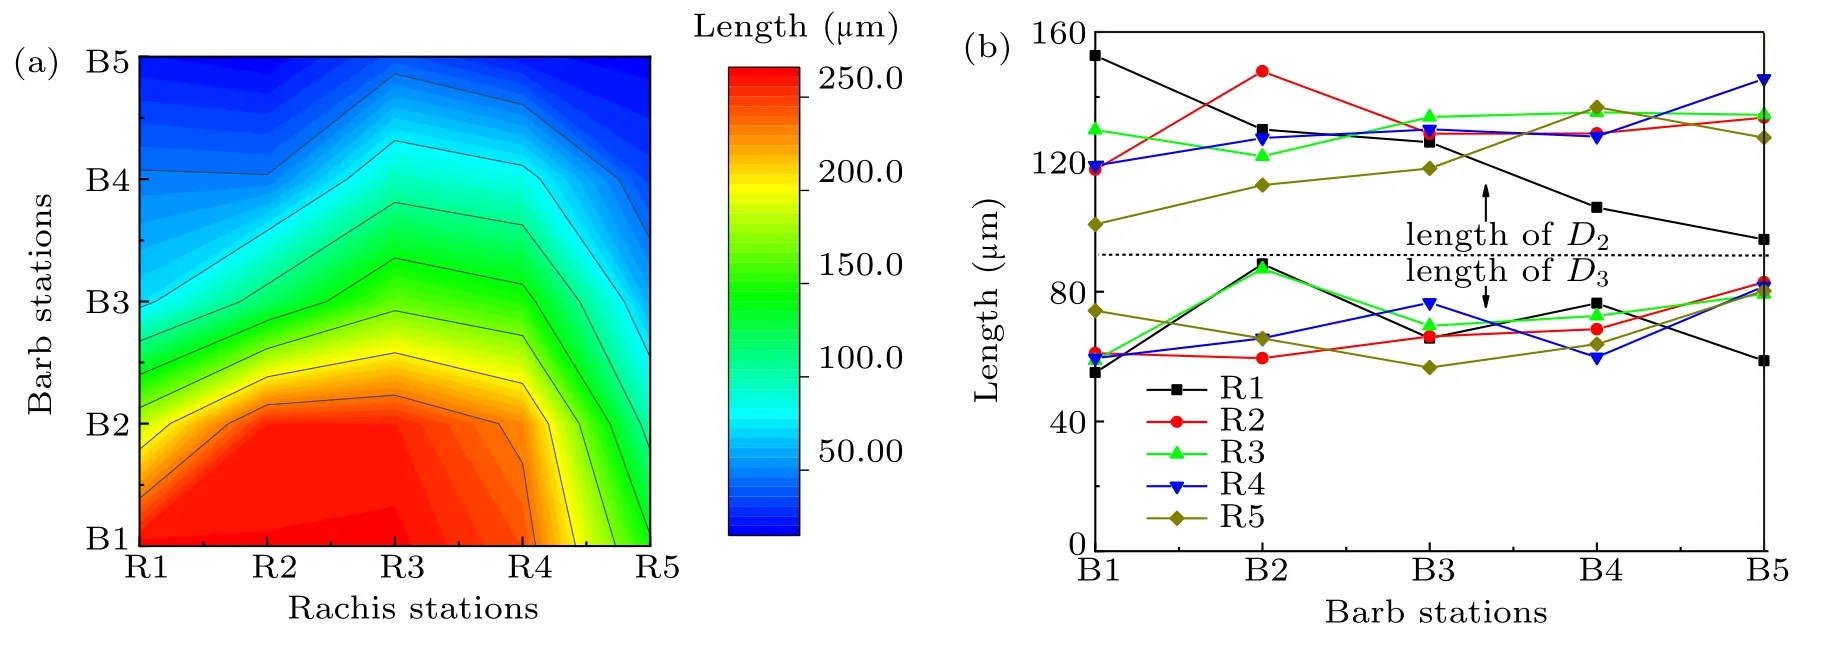
Fig.7. Length distributions of the cross sections: (a)length of D1,(b)lengths of D2 and D3.
4.2. Leakage rate of the specimens
During each test,the pressure was increased from 50 Pa to 500 Pa step by step,meanwhile the volume flow rate was measured at each test point. The testing procedures were circled for 4 times to ensure the effectiveness of the recorded data.The volume flow rate illustrated in Figs.8(a)-8(e)denotes the leakage of cases (a)-(e), and the results of the four tests coincide with each other very well. It is interesting to find that an approximate linear distribution exists in each case. Consider that a volume flow rate with 0 L/min is expected when ΔP is zero,thus a linear function is used to fit the experimental results:

where i denotes the ith case,aiis the corresponding fitting coefficients which are listed in Table 2.
The averaged values of volume flow rate at each location were calculated to extract the corresponding deviations,as shown in Fig.8(f). A deviation varying from −3.2%to 4.7%was observed for the specimen at location 1, while a range from −3.6% to 4.9% for location 2, a range from −5.3% to 4.8%for location 3,a range from −2.8%to 2.5%for location 4 and a range from −2.7%to 5.2%for location 5. Above all,all the deviations were under 5.3%of all the cases.

Fig.8. Results of the leakage experiment: (a)-(e)denote the cases(a)-(e),(f)denotes the deviations.
The averaged values of volume flow rate at each location were compared in Fig.9. It is found that the far the location is away from the rachis root, the larger the volume flow rate is. The maximum volume flow rate of 7.29 L/min was observed at the location1 when ΔP=500.0 Pa,while a maximum value 10.03 L/min for location 2, 10.59 L/min for location 3,12.01 L/min for location 4 and 14.35 L/min for location 5.It is implied that a higher barbule porosity exists at the feather tip.Thereafter,CFD simulations were implemented for each case and numerical volume flow rate was also compared in Fig.9.It is shown that the numerical results coincide well with the experimental results,the proposed porous model is well defined and can be used to predict the leakage ratio.
In the numerical simulation, air is assumed to be a compressible gas using the ideal gas law. When a high pressure 500.0 Pa was applied at the pressure inlet(right side), the air was retained in the tennel followed with a small quantity of flow leaking thorough the feather specimen.The air was accelerated when crossed the feather specimen,however,the maximum velocity was observed to vary from 0.22 m/s to 0.44 m/s in the numerical simulations. Thus,it is reasonable that the air was considered to flow at a laminar situation.

Table 2. Coefficients of linear functions.
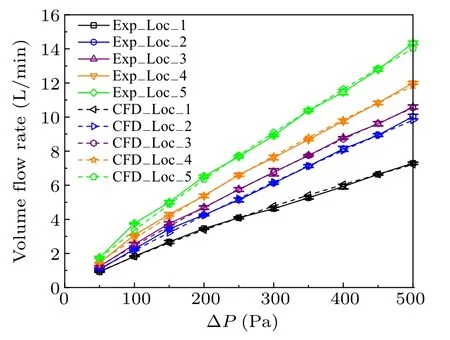
Fig.9. Comparison of computational volume flow ratio with the experimental one.
5. Influence on aerodynamics
Since the volume flow rate against ΔP has been obtained of all the five feather specimens, both viscous resistance coefficient and inertial resistance coefficient can be calculated using Eqs.(4)and(5), which are shown in Fig.10. It should be noted that volume flow rate of each feather specimen was tested in normal direction. Thus, the viscous and inertial resistance coefficients were applied to the porous model in the normal direction of the feather curve,which is illustrated using blue arrows in Fig.10.

Fig.10. Distributions of both viscous resistance coefficient and inertial resistance coefficient along the flight feather.
On the other hand, viscous and inertial resistance coefficients were not adopted in the tangent direction because air will be blocked along the tangent direction of the feather due to the numerous barb arrays, as illustrated in Fig.6. Finally,the flight feather was simplified to a porous zone to study influences on both the steady and unsteady aerodynamics.
5.1. Influences on the steady aerodynamics
Both the lift coefficients and the drag coefficients are the two most important steady aerodynamic performances for flying of a bird. Thus, lift coefficients and drag coefficients of both the porous model and the non-porous model were compared between α=−10◦and α=15◦,as shown in Fig.11(a).
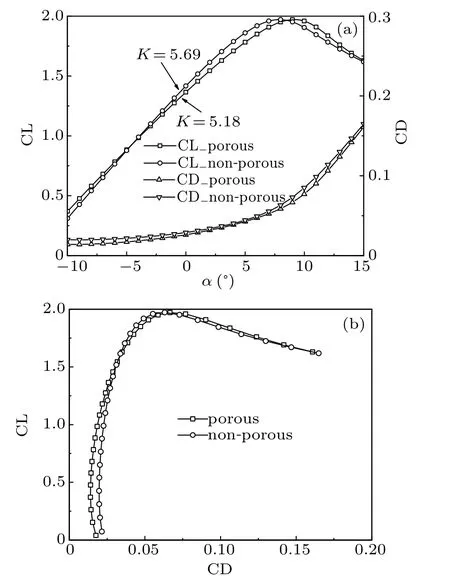
Fig.11. Comparison of aerodynamic performances of both the porous model and the non-porous model: (a)CL and CD,(b)polar curve.
As the CL, a maximum value 1.97 appears at α =8◦of the non-porous model and the lift coefficient begins to decrease monotonically as an angle of attack increases beyond α =8◦. On the contrary, the lift coefficient achieves a maximum value 1.97 at α =9◦of the porous model and decreases monotonically as α beyond 9◦. It is interesting to find that the maximum values of CL of the two cases coincide with each other. However,the slope of the lift curve decreases from 5.69 to 5.18 when the porous model is applied to the flight feather.It seems that the porous model does not change the maximum CL but decreases the slope of the lift curve.
As the CD,drag coefficients increase against the angle of attack in a wide range from −10◦to 15◦of the two cases,as shown in Fig.11(a). When the porous model is applied to the flight feather,the minimum drag coefficient has been reduced from 0.020 at α=−9◦to 0.014 at α=−10◦. The polar curve has been smoothed, as shown in Fig.11(b). Therefore, more response time will be needed for an eagle to twist its wings to control its angle of attack and flight attitude. It is estimated that more excellent manoeuvring characteristics of the porous model is achieved.
5.2. Influences on the rapid pitch-up
A control strategy of angle of attack was used during rapid pitch up to π/2 from 0◦within 0.08 s.[39]The CL and CD against α were compared in Fig.12. It is shown that both the CL and CD have been wakened. The maximum CL has been reduced by 0.37, on the other hand, the maximum CD was reduced by 0.29. However, angles of attack of the maximum drag,as well as lift,remain the same,which are 61.875◦and 40.0◦,respectively.
In both the porous case and the non-porous cases,it was found that there was a stagnation point appeared at the leading edge at t =0.0 s. As the airfoil pitched up rapidly, the stagnation point moved towards the trailing edge along the down surface, as shown in Fig.13(b). It is interesting to find that the stagnation point sheds from the down surface to air,resulting in a singularity point where air flows towards the singularity point in two opposite directions. Meanwhile, air flows away from the other two directions, as shown in Figs. 13(c)and 13(d). It is indicated that an unstable flow occurs and the singularity point cannot remain steady. Finally, as the rapid pitch-up maneuvering came to an end,the singularity point finally returned to an stagnation point at the trailing edge of the down surface,as shown in Fig.13(e).
As the development of vortices in the flow,leading-edge vortex grew up and then rolled downstream with strong intensity,which has been well detailed in our previous research.[39]As the non-porous model,the generated vortices always stick to the upper surface of feather, leading to very small separation angle as shown in Fig.14(a). However, as the porous model was applied to the flight feather, air can flow through the feather resulting in a larger included angle between shed vortex and feather surface. For instance, the included angle was increased from 11◦to about 20◦at t =0.02 s, and from 12◦to about 25◦at t=0.04 s.
Trailing vortex shedding was also changed significantly comparing Fig.15 with Fig.16. Because of the permeable flow through the porous zone, a strong trailing vortex was raised up before the airfoil was pitched up at t =0 s, which can be regarded as a steady flow. The trailing vortex leaded to an adverse pressure gradient at the trailing edge. Thus,a backflow is clearly shown in Fig.15(a).However,as the airfoil was pitched up rapidly,moving wall condition eliminated the backflow immediately. The permeable flow was also clearly shown by stream lines at the end of the porous feather during rapid pitch up, leading to a strong semicircular vortex appeared at the end of tail feather rather than a slender vortex, as shown in Fig.16. Also,the scale of the shedding vortex was also enhanced from 2.9 mm of the non-porous feather to 3.7 mm of the porous feather.
Additionally,air can only flow in the normal direction of the shape curve proofed by streamlines shown in Fig.15. That is because viscous and inertial resistance coefficients were used in the normal direction rather than the tangent direction in the porous model,as discussed above.

Fig.12. Cross-sectional shapes of the barb riblets at different stations.

Fig.13. Distributions of vortices and stream lines of the airfoil with a porous feather during rapid pitch up: (a)t =0.0 s; (b)t =0.02 s; (c)t=0.04 s;(d)t=0.06 s;(e)t=0.08 s.

Fig.14. Distributions of vortices and stream lines of the airfoil without porous feather during rapid pitch up: (a)t =0.0 s;(b)t =0.02 s;(c)t=0.04 s;(d)t=0.06 s;(e)t=0.08 s.

Fig.15. Distributions of vortices and stream lines at the end of the porous feather during rapid pitch up: (a) t =0.0 s; (b) t =0.02 s; (c)t=0.04 s;(d)t=0.06 s;(e)t=0.08 s.

Fig.16. Distributions of vortices and stream lines at the end of the non-porous feather during rapid pitch up: (a)t =0.0 s;(b)t =0.02 s;(c)t=0.04 s;(d)t=0.06 s;(e)t=0.08 s.
6. Conclusion
In summary, we have captured the cross-sectional barb shapes of an eagle feather and measured its characteristic length, and a measurement setup system has been developed and the leakage ratio of the feather has been investigated. The insights obtained from the study will be an inspiration for leakage evaluation.The following significant enhancements of our understanding were accomplished: (1)A λ-like cross section with a tiny hook was observed at the right feet. A regular distribution was observed for D1. The largest length of D1 appeared at the root of each barb, and it became tiny from the barb root to tip. The distance between neighboring barb shafts was measured to be almost the same, resulting in the parallel arrangement of barbs. (2)The leakage of the feather has been tested,an approximate linear distribution was observed and a linear function was used to fit the experimental results with identification of each coefficients. (3) A CFD method with a porous model has been developed for the leakage evaluation. Good agreements with the experimental data have been achieved. The proposed method has a high potential for the leakage analysis of a bird feather. (4) Influences of the leakage on both steady and unsteady aerodynamics have been investigated to find that the permeable flow has decreased lifts and drags,but induced strong trailing vortex with an enhanced scale at the end of the porous feather.
Acknowledgment
The authors would like to thank the referees for their good and valuable suggestions which improved this paper greatly,and thank the team of Dawei Liu for all their contributions to the CFD computations.
猜你喜欢
杂志排行
Chinese Physics B的其它文章
- Transport property of inhomogeneous strained graphene∗
- Beam steering characteristics in high-power quantum-cascade lasers emitting at ~4.6µm∗
- Multi-scale molecular dynamics simulations and applications on mechanosensitive proteins of integrins∗
- Enhanced spin-orbit torque efficiency in Pt100−xNix alloy based magnetic bilayer∗
- Soliton interactions and asymptotic state analysis in a discrete nonlocal nonlinear self-dual network equation of reverse-space type∗
- Discontinuous event-trigger scheme for global stabilization of state-dependent switching neural networks with communication delay∗
