Chemical and spectroscopic characteristics of humic acid from a clay loam soil in Ontario after 52 years of consistent fertilization and crop rotation
2021-03-17NanZHAOXixiangYANGGuochengHUANGYizhongJingZHANGYuanyuanFANCraigDRURYandXuemingYANG
Nan ZHAO,Xixiang YANG,Guocheng HUANG,Yizhong LÜ,Jing ZHANG,Yuanyuan FAN,Craig F.DRURY and Xueming YANG
1School of Environmental Science and Engineering,Sun Yat-sen University,Guangzhou 510275(China)
2School of Chemistry,Guangzhou Key Laboratory of Analytical Chemistry for Biomedicine,South China Normal University,Guangzhou 510006(China)
3College of Resources and Environmental Sciences,China Agricultural University,Beijing 100193(China)
4Key Laboratory of Environmental Nano-Technology and Health Effect,Research Center for Eco-Environmental Sciences,Chinese Academy of Sciences,Beijing 100085(China)
5Harrow Research and Development Centre,Agriculture and Agri-Food Canada,Harrow,Ontario N0R 1G0(Canada)
(Received July 8,2019;revised September 12,2019)
ABSTRACT Long-term fertilization and crop rotation can influence both organic C sequestration as well as the C composition of soils and the more resistant organic C compounds contained in humic acid(HA).This study examined the effects of fertilization and cropping type(monoculture corn(MC)and Kentucky bluegrass sod(KBS)and corn-oat-alfalfa-alfalfa rotation(RC))on the HA composition of soil from a 52-year field study in southern Ontario,Canada.Humic acid samples were extracted from soil,and elemental analysis,infrared spectroscopy,solid state 13C nuclear magnetic resonance spectra,and electron paramagnetic resonance methods were used to determine the influence of the cropping type on the characteristics of HA.Both fertilization and cropping type affected the chemical characteristics of HA.Fertilization led to a 5.9% increase in C,a 7.6% decrease in O,and lower O/C and(N+O)/C ratios in HA as compared to the corresponding non-fertilized treatments.Rotation resulted in a lower proportion of C(48.1%)and a greater(N+O)/C ratio(0.7)relative to monoculture cropping.Infrared spectroscopy analysis showed that HA contained more C-O groups in fertilized soil than in non-fertilized soil under MC and KBS.Fertilization increased the O-alkyl-C,phenolic-C,and free radical contents of HA relative to non-fertilization treatments.Rotation decreased the aliphatic and carboxyl groups and increased the O-alkyl,carbohydrate,aryl,and phenolic groups and free radicals,relative to MC and KBS.Both long-term crop rotation and fertilization dramatically modified the soil HA composition.Significant relationships were observed between the molecular composition of HA and soil organic C.Hence,humic acid characterization could be used as an indicator of the long-term sustainability of crop management practices.
Key Words:corn,humification process,infrared spectroscopy,Kentucky bluegrass sod,molecular composition,soil organic C
INTRODUCTION
Humic acid(HA)is the primary component of soil humic substances(HS)and plays a vital role in soil fertility and plant nutrition(Chen and Aviad,1990;Schulten and Schnitzer,1995).Small quantities of HA can enhance plant growth by improving the availability of micronutrients or by lateral root initiation(Vaughan and Malcolm,1985;Brady and Weil,2008).The quantity and quality of soil HA may vary with agricultural practices.Fertilizer is an essential agricultural input around the world,and the use of fertilizers has been found to increase soil organic matter(SOM)over time(Haynes and Naidu,1998).Using a13C stable isotope technique,Zhanget al.(2012)found that long-term fertilizer addition to monoculture corn(MC)significantly increased the amount of newly formed soil organic C(SOC)but had little impact on the amount of native SOC in a previous study at this field site.Fertilizer addition could also affect the molecular structural characteristics of HA,and this effect varies with fertilizer types.Chemical fertilizers could increase the contents of hydrogen in HA at the expense of O content(Zav’yalova,2011).The combined application of chemical fertilizer and compost increases the O-alkyl-C and aromatic-C contents relative to the application of chemical fertilizer only(Yanagi and Shindo,2016).Soil amended with farmyard manure and chemical fertilizer increased the proportion of C in HA in a long-term field trial(Simonettiet al.,2011).The use of farmyard manure can also increase the proportions of lignin,amino acids,peptides,and proteins in soil HS(Ferrariet al.,2011).Humification processes are very similar to geopolymerization,by which the products of humification(HA)become more stable with advancing humification degree.
Crop rotation is a popular agronomic practice used to maintain crop health,improve soil quality,increase C input and SOM reactivity(Wander and Traina,1996;Karlenet al.,1997;Reeves,1997),and decrease environmental impacts,such as N2O emission(Druryet al.,2008).Crop residues added to soil strongly influence SOM quality and quantity(Samahadthaiet al.,2010).Changing crop types in rotation not only changes the amount of residues added to soil but also the types of materials that decompose in soil.In a ricewheat rotation agroecosystem,Zhanget al.(2011)found that applying maize residues increased the O-alkyl-C and aromatic-C contents of HA.In western Canada,the SOM quality was found to be greatly affected by rotation in a barley system which was under-seeded with/without alfalfa(Campbellet al.,1992).
Both rotation and N fertilizer rate significantly affect soil total C and N contents(Varvel,1994).Well-fertilized(NPK)monoculture wheat also led to a 13% greater C content in soil than monoculture wheat receiving only P fertilizer(Biederbecket al.,1984).Long-term effects of crop rotation and fertilization are mostly observed with respect to the quantity of SOC(Omayet al.,1997;Kaiseret al.,2007).However,there are few studies examining the effects of fertilizer,rotation,and their interaction on the quality of SOC fractions,such as HA.A 52-year field experiment in Woodslee,Ontario,Canada provides a unique opportunity to assess the impacts of long-term fertilization and crop rotation on the chemical nature of HA in these soils that resulted in marked differences in crop yields(Drury and Tan,1995).Numerous studies have been conducted on this field trial to investigate the effects of long-term fertilization and crop rotation on soil structure and water desorption characteristics(McKeagueet al.,1987),denitrification and soil C(Druryet al.,1998),C residue retention and chemical composition of SOM(MC only)(Gregorichet al.,2001),water and nitrate losses(Tanet al.,2002),C retention(Zhanget al.,2012),and water and nitrate partitioning(Woodleyet al.,2018).However,this is the first time that the effects of long-term fertilization and crop rotation on the composition of HA have been investigated.The molecular structure of HA remains unknown(Baveye and Wander,2019).
Humic acid is one of the most structurally complex components of SOM.The chemical composition of SOM plays an important role in C storage(Jiménez-Gonzálezet al.,2019).Therefore,it is reasonable to hypothesize that the stabilization of SOC depends on the chemical composition of HA.Moreover,the molecular composition of HA differs depending on fertilization and crop rotation.Therefore,the objectives of this study were:i)to examine the influence of long-term consistent crop rotation and fertilization on the characteristics of HA in soil and ii)to test the relationships among SOC and structural characteristics of HA.This work represents a more complete structural analysis of SOC,N,and the chemical characteristics of HA under different agricultural management practices that profoundly influence crop growth and yield.
MATERIALS AND METHODS
Experimental field and soil sample collection
Soil samples(Brookston clay loam soil classified as Orthic Humic Gleysol in the Canadian System of Soil Classification;poorly drained,fine loamy,mixed,mesic Typic Argiaquoll in USDA Soil Taxonomy)used in this study were collected from a long-term cropping study on the Honorable Eugene F.Whelan Experimental Farm,Woodslee,Ontario,Canada(42°13 N,82°44 W),52 years after the experiment was initiated in 1959.This experimental site was converted to farmland from native grasses and mixed deciduous forest(C3 plants)in the middle-to late-1800s.The land was used for corn(Zea maysL.),alfalfa(Medicago sativaL.),and red clover(Trifolium pretenseL.)production from 1940 to 1954 and for monoculture corn production from 1956 to 1958.In 1959,12 plots(each 76.2 m long by 12.2 m wide)were established,and fertilization and crop rotation were investigated(Fig.1).Two fertilizer treatments(with fertilization and non-fertilization)were split into six plots each,with one plot seeded with MC,one plot seeded with monoculture Kentucky bluegrass(Poa pratensisL.)sod(KBS),and the remaining four plots seeded with corn-oat(Avena sativa)-alfalfa-alfalfa rotation(RC),with all four phases of the rotation grown every year(four replicates).The fertilized plots received 16.8 kg N ha−1(NH4NO3),29.3 kg P ha−1(P2O5),and 27.9 kg K ha−1(K2O)per year at planting for all crops in rotation and an additional 112 kg N ha−1(NH4NO3)per year for corn,as a side-dress application.The non-fertilized plots did not receive any mineral or organic fertilizer,except for atmospheric deposition during the entire experimental period.Each plot was drained by a single tile(10 cm in diameter,70 cm in depth on average)running along the plot longitudinal axis.All agronomic practices remained the same during the entire period,except for changes in plant varieties and populations.For more detailed soil and agronomic information on this site,please see Stoneet al.(1987),Drury and Tan(1995),and Woodleyet al.(2018).
This study focused on six treatments,including fertilized monoculture corn(MC-F),monoculture Kentucky bluegrass sod(KBS-F),and rotation corn(RC-F,the corn phase)and non-fertilized monoculture corn(MC-NF),rotation corn(RC-NF,the corn phase),and monoculture Kentucky bluegrass sod(KBS-NF).Soil pH values for these six treatments were 7.0,6.0,6.2,7.6,6.7,and 6.6,respectively.The soil had an average texture of 280 g sand kg−1,350 g silt kg−1,and 370 g clay kg−1.The mean 30-year annual air temperaturewas 8.9±0.4°C,and the annual precipitation was 832±257 mm.
From each plot,three replicate samples(0-20 cm)were collected along a transect midway between the tile(the center of the plot)and the plot edge to ensure that the samples were representative and not unduly influenced by the tile or the plot edge.The samples were passed through a 2-mm sieve to make them homogeneous and then air-dried.Soil subsamples were finely ground(<0.15 mm)and analyzed for total C and N contents using a LECO-CN2000 analyzer(LECO Corporation,St.Joseph,USA).Because these soils were free of carbonates,the total C content was equivalent to the SOC content.
Extraction of HA and chemical analysis
Humic acid was extracted from the bulk soils using the methodology published by the International Humic Substance Society(Swift,1996).Briefly,500 g(<2 mm)soil sample were pre-treated with 250 mL of 1 mol L−1HCl,extracted with 200 mL of 0.1 mol L−1NaOH solution under N2,shaken for 24 h,and centrifugated at 5000×g.Both HCl(0.1 mol L−1,100 mL)and HF(0.3 mol L−1,50 mL)were used to mix with HA to remove silicate.The samples were then decanted and dialyzed to purify the HA.To confirm the removal of HCl and HF during the dialysis procedure,subsamples of the HA mixture were tested by adding 0.1 mol L−1AgNO3.When Cl−was still present,a precipitate formed.The dialysis was terminated when no precipitate formed,which indicated that all of the HCl was removed.The HA was freeze-dried,ground to pass through a 0.25-mm sieve,and stored in airtight bottles.The quantity of HA from the soil samples ranged from 1.5 to 3.9 g kg−1soil.Elemental composition,including C,H,and N,in HA was measured using a Vario EL III elemental analyzer(Elementar,Langenselbold,Germany).The O content was estimated as the mass difference,using the following equation:O%=100%−C%−H%−N%.Ash content of the six treatments ranged from 0.01% to 1.83%,as determined by ignition at a burning temperature of 750°C in a muffle furnace for 3 h.
Fourier transform infrared microspectroscopy of HA was performed in the range of 500-4 000 cm−1,with 128 co-added scans at 8 cm−1resolution,using a Nicolet 750 micro-infrared instrument with a KBr beam-splitter and an MCT/A detector(Thermo Fisher Scientific,Waltham,UK).Intensities of infrared spectra(IR)at 1 658,3 366,2 934,1 711,1 245,and 1 081 cm−1were mentioned as IR1658,IR3366,IR2934,IR1711,IR1245,and IR1081,respectively.Precautions were taken to avoid moisture uptake.
The13C nuclear magnetic resonance(NMR)spectra of HA were obtained using a Bruker Avance III 400 instrument(Bruker,Fällanden,Switzerland),equipped with a 4-mm probe,at a spinning speed of 5 kHz and frequency of 100.37 MHz for13C.The line broadening was 100 Hz.Acquisition conditions were 3-000µs contact time,2 s recycle time,and a scan number greater than 10 000.Spectra were acquired using13C cross-polarization/total sideband suppression NMR spectroscopy(Maoet al.,2012).
Electron paramagnetic resonance(EPR)measurements were performed using an A300 spectrometer(Bruker,Rheinstetten,Germany),with 9.519 GHz microwave frequency and 100 kHz modulation on 20 mg of HA enclosed in a quartz capillary.
Statistical analyses
A one-way analysis of variance was used to analyze potential differences in HA among different fertilization and rotation treatments.Statistical analyses were performed using SAS statistical software(SAS Institute,Cary,USA),and significance was reported at the 0.05 probability level.A least significant difference(LSD)test was performed on the means when significant main effects were identified.Relationships among SOC and the chemical compositions of HA were evaluated using Pearson’s correlation coefficient.
RESULTS AND DISCUSSION
Soil organic C content and elemental composition of HA
There were significant differences in SOC contents among the treatments(Table I).After half a century of cropping practices,soil with KBS contained 46.0 g kg−1of SOC,which was 89% greater than the soil with RC(24.3 g C kg−1)and 133% greater than the soil with MC(19.7 g C kg−1).Significantly greater amounts(approximately 20%)of SOC occurred under fertilization(32.7 g kg−1)than non-fertilization(27.3 g kg−1)for all three crop types.These results indicated that both long-term rotation and fertilization increased the SOC content.Higher SOC content under fertilization than non-fertilization may be due to higher crop biomass return(stover and roots),which was a direct reflection of 2.7 times more corn grain yield(15.5%moist)in fertilized soil(8 330 kg ha−1year−1for RC and 5 630 kg ha−1year−1for MC)than in non-fertilized soil(4 160 kg ha−1year−1for RC and 1 040 kg ha−1year−1for MC)based on the first 45 years of data.Soil total N content responded to cropping practices in a similar manner as SOC,with more N in soil with KBS(5.8 g N kg−1)compared to soil with RC(3.0 g N kg−1)or MC(2.8 g N kg−1).
Contents of C,N,and O and the atomic ratios of HA were significantly affected by cropping type,fertilizer application,and their interactions(Table II,Fig.2).Content of C in HA was generally higher in fertilized than non-fertilized soils,with a C proportion of 53.9% in MC-Fvs.48.7% in MC-NF and 51.3% in KBS-Fvs.49.9% in KBS-NF.No difference in C proportion in HA in soil with RC was observed between fertilization and non-fertilization(47.4%-48.7%)(Fig.2).These results are consistent with the findings of Zhanget al.(2011)that crop biomass inputs in combination with fertilizer application can increase SOC content in bulk soil.
For fertilized soils,those with RC had a higher N proportion(4.8%)in HA relative to MC(4.3%)or KBS(4.5%).There were significant differences in N proportion in HA between RC and MC.The N contents in HA in non-fertilized soils were greater with KBS(4.8%)than RC(4.5%)and MC(4.0%)(Fig.2).In contrast to KBS which contained a greater N content in non-fertilized soil than fertilized soil,the fertilized soils with MC and RC had greater N content than the corresponding non-fertilized soils.Higher N contentin HA in fertilized soil with corn compared to non-fertilized soil with corn could be a direct reflection of fertilizer N input(Aleksandrova,1980).However,we cannot explain why this N input did not show up in the KBS treatment,and this is worthy of further study.
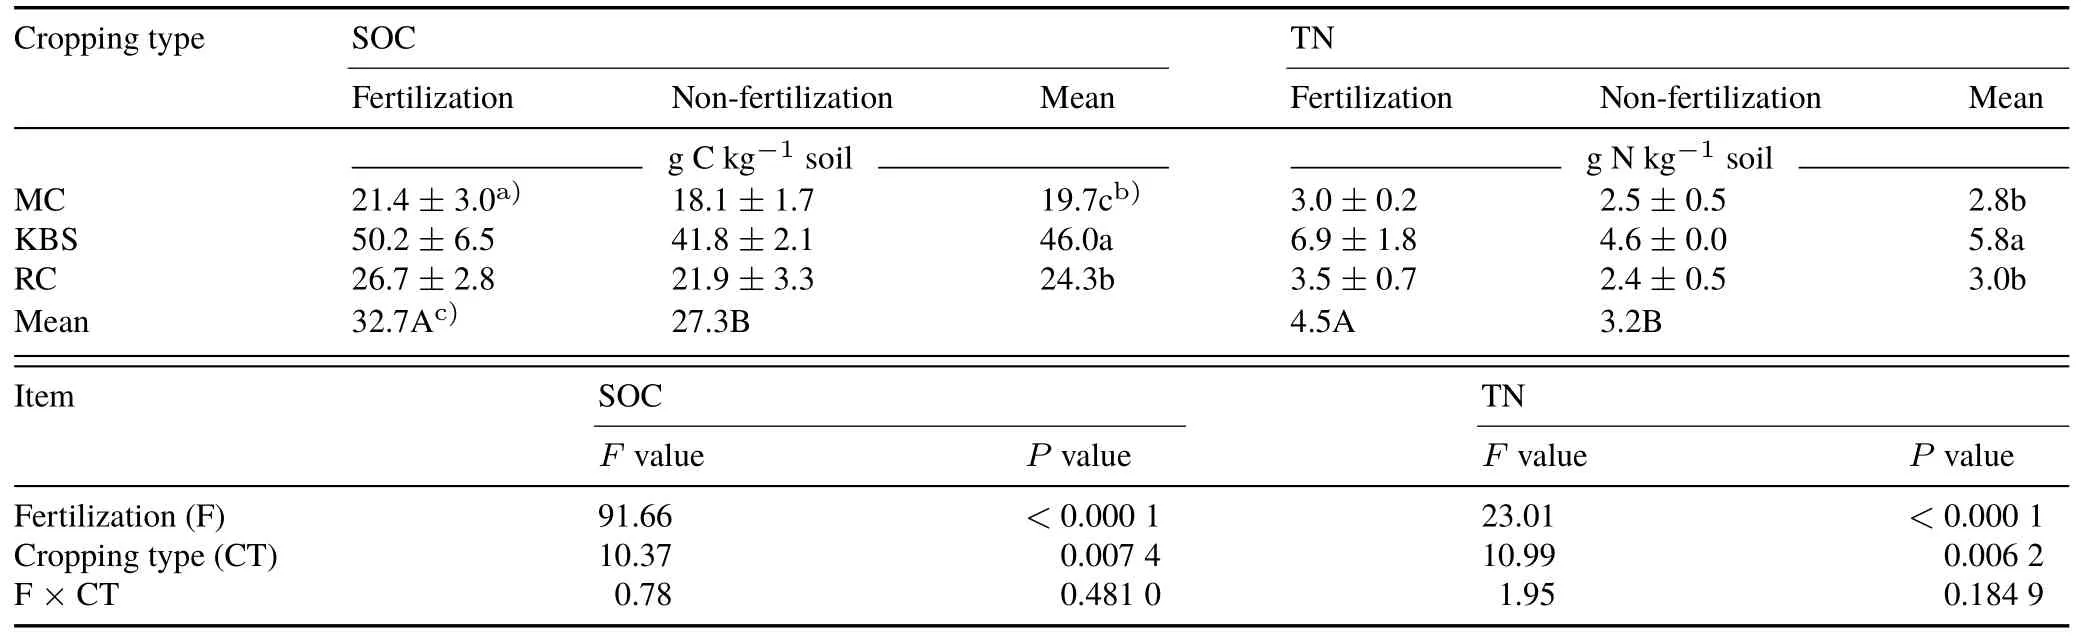
TABLE ISoil organic C(SOC)and total N(TN)contents at 0-20 cm depth in soils with different cropping types,monoculture corn(MC),monoculture Kentucky bluegrass sod(KBS),and corn-oat-alfalfa-alfalfa rotation(RC),under fertilization or non-fertilization and analysis of variance results
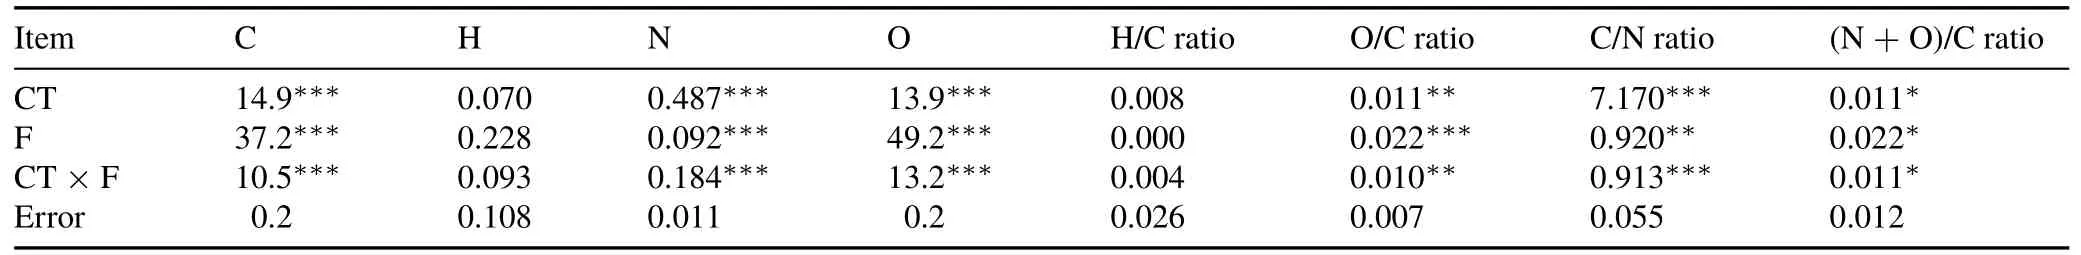
TABLE IIStatistical analysis(F value)of fertilization(F)and cropping type(CT)effects on the elemental composition and atomic ratios of soil humic acid
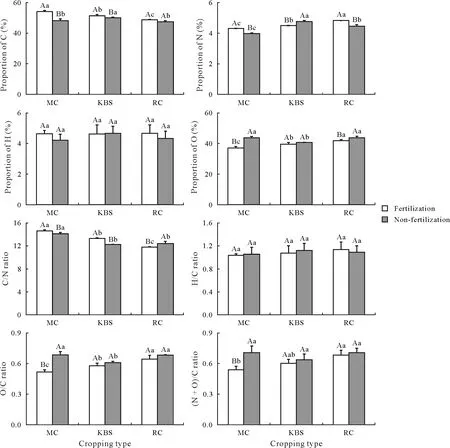
Fig.2 Elemental composition and atomic ratios of humic acid extracted from soils with different cropping types,monoculture corn(MC),monoculture Kentucky bluegrass sod(KBS),and corn-oat-alfalfa-alfalfa rotation(RC),under fertilization(F)or non-fertilization(NF)(ash-free).Vertical bar indicates the standard deviation(n=3).For a given fertilization treatment,means followed by the same lowercase letter(s)are not significantly different among three cropping types;for a given cropping type,means followed by the same uppercase letter are not significantly different between two fertilization treatments.
The C/N ratio in HA ranged from 11:1 to 15:1,with the highest for the fertilized monoculture corn(14.6)and lowest for the fertilized rotation corn(11.8)(Fig.2).According to Tan(2003),HA with C/N ratios in these ranges are at the well-developed equilibrium stage of decomposition and accumulation of SOM,which is not surprising,since these treatments have been in place for 52 years.The lower C/N ratio associated with RC-F may be attributed to N enrichment from both chemical fertilization and N2fixation by alfalfa(Liuet al.,2010).The ratio of H/C may illustrate the aliphaticity and sources of organic matter in soil(Zhao and Lü,2012);however,the H content and the H/C ratio were not significantly different among the treatments(Fig.2).The highest C/N ratio and the lowest H/C ratio(1.0)for MC-F suggested that the HA under MC-F had the highest degree of condensation.Lower O was found in HA in fertilized MC(37.1%)and RC(41.8%)relative to corresponding nonfertilized cropping types(43.8% and 43.8%,respectively),which was consistent with the findings of previous studies(Senesi and Brunetti,1996;Zav’yalova,2011).Since the O/C ratio may represent the degree of oxidation(Zav’yalova and Konchits,2011),the smallest O/C ratio(0.5)in HA in fertilized soil with MC may indicate that the HA associated with this treatment contained more newly formed organic materials relative to the HA under other treatments(Douet al.,1992).Songet al.(2009)noted that the greater the ratio of(N+O)/C,the higher the HA polarity.Given this knowledge,the HA had a higher polarity in non-fertilized soil than fertilized soil.
Micro-infrared analysis
There were many similarities in IR among all HA samples(Fig.3),with the major bands assigned as follows(Bellamy,1975;Stevenson,1982;MacCarthy and Rice,1985):a broad and rather intense band at 3 366 cm−1represented stretching vibrations of OH in phenols,acids,and alcohols(Zhanget al.,2011).It is worth noting that water vapor in ambient air may have enhanced this peak.A band at 2 934 cm−1was attributed to the stretching vibration of the aliphatic asymmetric C-H group(Maoet al.,2008).In addition,all HA samples had spectral characteristics in the wavenumber range of 2 000 to 500 cm−1,including:i)a COOH band with high intensities around 1 711 cm−1(carboxyl groups)(Stevenson,1972),ii)bands at 1 658 cm−1,ascribed to carbonyl C=O of quinone,iii)bands at around 1 453 cm−1,attributed to C-H deformation of CH3and C-H bending of,and iv)peaks near 1 245 cm−1,probably due to C-O stretch vibration in alcohols,phenols,and carboxyl groups.Moreover,the peak at 1 081 cm−1was associated with the presence of carbohydrates(Zhanget al.,2011).In general,differences in the IR spectra of HA were observed among fertilization and cropping type treatments(Table III),which showed changes in the ratios between the main absorbance peaks(Amiret al.,2010).A higher ratio of IR1658/IR1711was obtained under RC-F as compared to MC-F(P<0.05).Moreover,the ratio of IR1081/IR1245was lower under MC-F and KBS-F as compared to the corresponding non-fertilized treatments.The relative intensity of the IR absorbance peaks may indicate that rotation affects carboxylic groups(IR1658/IR1711),while fertilization has more impact on carbohydrates(IR1081/IR1245).

Fig.3 Micro-infrared spectra of humic acid extracted from soils with different cropping types,monoculture corn(MC),monoculture Kentucky bluegrass sod(KBS),and corn-oat-alfalfa-alfalfa rotation(RC),under fertilization(F)or non-fertilization(NF).
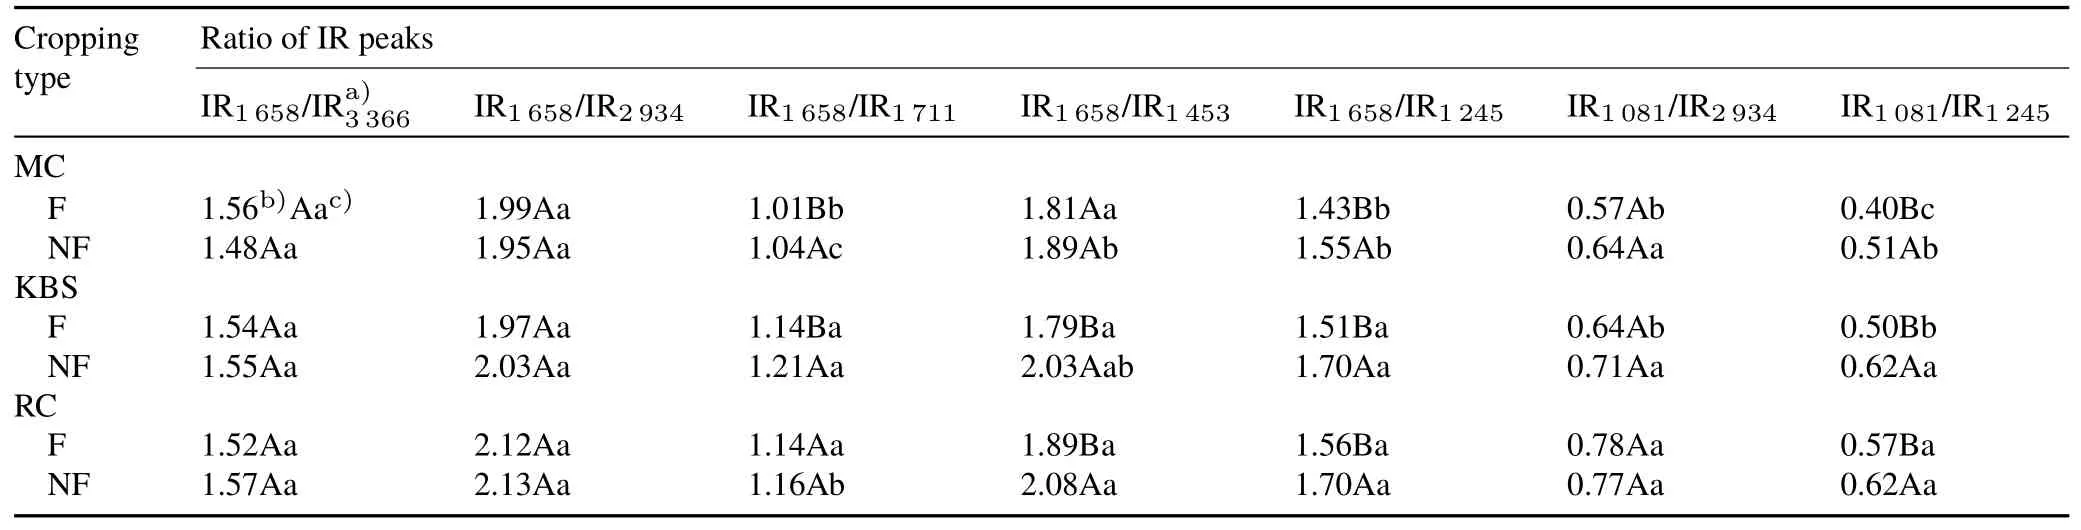
TABLE IIIRatios of main absorbance peaks of infrared spectra of humic acid extracted from soils with different cropping types,monoculture corn(MC),monoculture Kentucky bluegrass sod(KBS),and corn-oat-alfalfa-alfalfa rotation(RC),under fertilization(F)or non-fertilization(NF)
13C NMR and EPR analyses
Table IV and Fig.4 show solid-state13C NMR spectra of six HA samples examined with major signal intensities at 31,57,73,103,130,and 175 ppm,following the pattern of the six main chemical shift regions of the NMR spectra described by Marcheet al.(2003).All spectra exhibited narrow and intense signals at 31-32 ppm,which were most likely due to unsubstituted saturated aliphatic-C from long-chain fatty acids,surface waxes,lipids,resins,protein-like structures,or polymethylene in lipids,belonging to amorphous and crystalline CH2groups(Chen and Chiu,2003;Tinocoet al.,2004).Among the six treatments,RC-F had the lowest amount of aliphatic structures(Table IV).The structures of HA tended to be more complicated under fertilization and rotation(Songet al.,2018).The peaks at 56-58 ppm can be attributed to recalcitrant O-alkyl-C in lignin(Chen and Chiu,2003),and the low signals for all samples may indicate low lignin content in HA(Oadeset al.,1987).The ring and anomeric-C of carbohydrates occur at 73 ppm and 103 ppm,respectively(González-Vilaet al.,1983).The peak at 103 ppm is also a characteristic of non-protonated C from tannins(Prestonet al.,1997;Maoet al.,2008),and in this regard,there were more non-protonated aromatics occurring in fertilized than in non-fertilized soils in the current study.A high signal of carbohydrates in the NMR spectra was also shown by relatively high signal peaks in IR spectra(Fig.3).The peak at 175 ppm may come from quaternary carboxyl-C.The HA with high carboxyl-C could have a positive effect on soil aggregation(Nègreet al.,2002).Spectroscopic data indicated that aliphatic-C,carbohydrate-C,aryl-C,and carboxyl-C were the major components of HA,and that HA had greater aliphaticity than aromaticity under the six treatments.This result was consistent with the findings of Zhao and Lü(2012)from an alluvial soil with 23 years of fertilization management.
Nuclear magnetic resonance analysis indicated that fertilization resulted in a higher aromaticity of HA than nonfertilization(Table IV).Since aryl-C is recalcitrant(Adani and Spagnol,2008),the greater amount of aryl-C in HA in soil under RC-F indicated that HA was more stable under RC-F relative to other treatments.This suggested that RC-F may be more effective than other treatments at improving soil structural stability.The increased stability of HA in soil under RC-F was also demonstrated by more higher phenolic-C content and lower carboxyl-C content relative to HA in soils under other treatments.At the same time,higher aryl-C content was found in HA in fertilized soil with rotation than other soils.Aryl-C belongs to the hydrophobic component,which has an essential role in controlling the process of organic C sequestration(Songet al.,2013).
Correlation analysis showed that SOC had a significant(P<0.01)negative correlation with the ratio of IR1658/IR3366of HA(Fig.5).This indicated that significant relationships existed between the molecular composition of HA and SOC.An increase in the OH group or a decrease in C=O may promote an increase in SOC.Therefore,phenols,acids,and alcohols were more characteristic of HA in soil with high SOC content.The band assigned to quinone was a characteristic of HA in soil with low SOC content.Other factors,such as the ratios of IR1081/IR2934and IR1081/IR1245were significantly(P<0.01)negatively correlated with the C content in HA.The O and ratios of O/C,(N+O)/C,and IR1658/IR1711also showed significantly(P<0.05)negative relationships with the C content in HA.Therefore,C content was affected by carbohydrates,aliphatic groups,alcohol,phenol,carboxyl groups,and quinone.
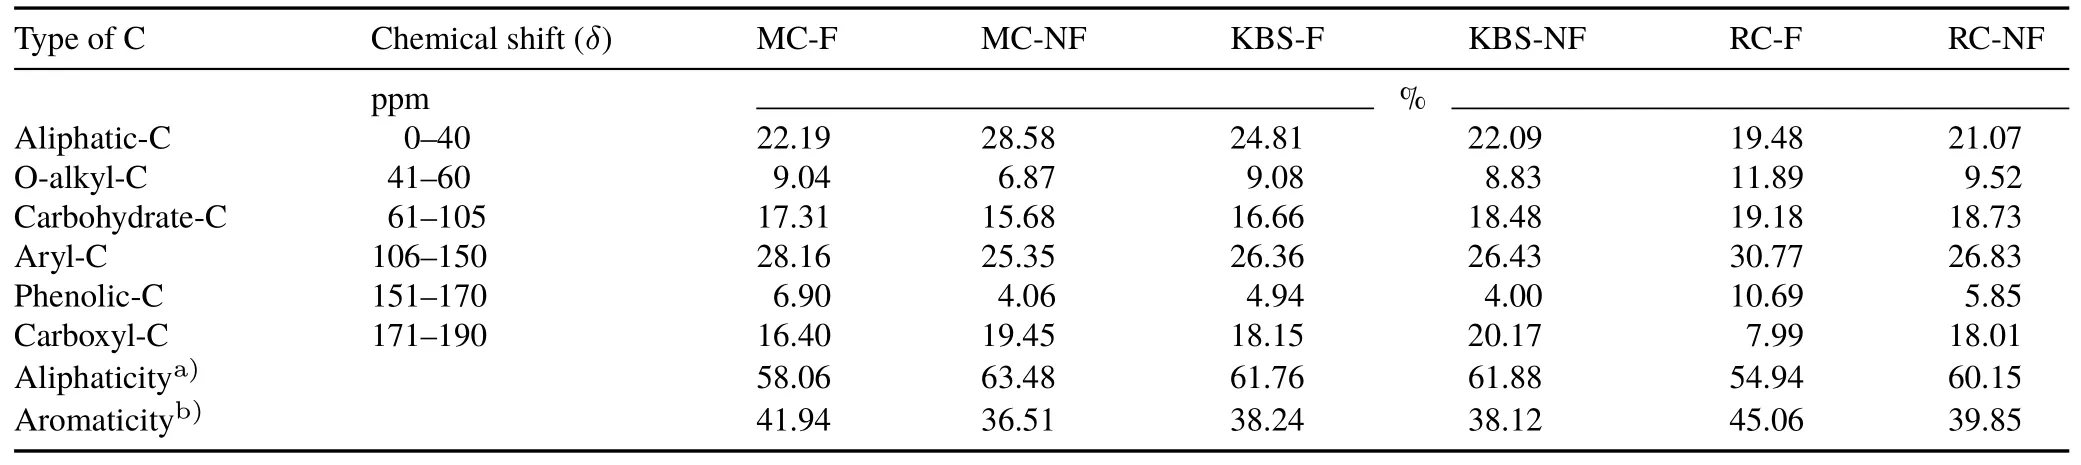
TABLE IVDistribution of different C species in humic acid extracted from soils with different cropping types,monoculture corn(MC),monoculture Kentucky bluegrass sod(KBS),and corn-oat-alfalfa-alfalfa rotation(RC),under fertilization(F)or non-fertilization(NF)determined by 13C nuclear magnetic resonance spectroscopy
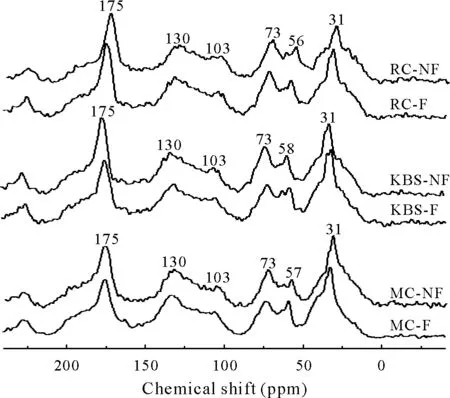
Fig.4 Solid-state 13C nuclear magnetic resonance(NMR)spectra of humic acid extracted from soils with different cropping types,monoculture corn(MC),monoculture Kentucky bluegrass sod(KBS),and corn-oatalfalfa-alfalfa rotation(RC),under fertilization(F)or non-fertilization(NF).
The EPR spectra of HA contained a single,symmetrical resonance line for different treatments(Fig.6).Theg-factor in the 2.006 4-2.006 8 range was attributed to O-centered radicals,such as semiquinone radical anions(Zhaoet al.,2018).Hence,this is a useful parameter for identifying the type of free radicals which are present.Relative to nonfertilization,fertilization resulted in an obvious increase in the peak intensity(Fig.6).The oxidization of phenols to quinones caused a higher content of free radicals(Songet al.,2017).This is consistent with higher aromaticity,phenolic-C,and O-alkyl-C under fertilization(Table IV),as will be expected for less highly oxidized soil(González Pérezet al.,2004;Songet al.,2017).
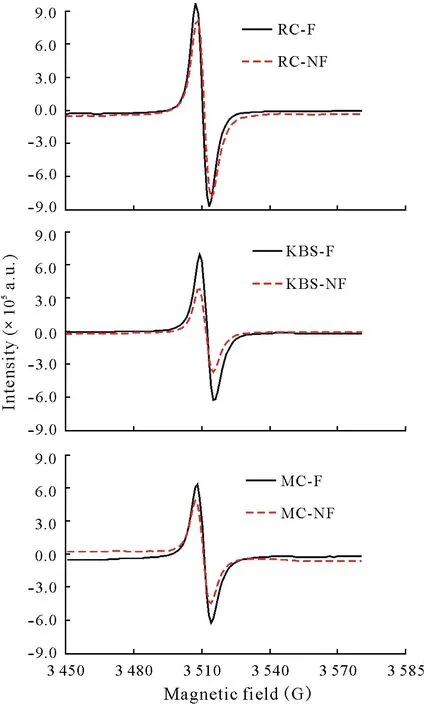
Fig.6 Electron paramagnetic resonance spectra of humic acid extracted from soils with different cropping types,monoculture corn(MC),monoculture Kentucky bluegrass sod(KBS),and corn-oat-alfalfa-alfalfa rotation(RC),under fertilization(F)or non-fertilization(NF).a.u.=arbitrary unit.
Fig.5 Correlations among soil organic C(SOC)and chemical compositions of humic acid.Brown signifies a positive correlation,and blue signifies a negative correlation.This figure was drawn with MATLAB software(MathWorks,Natick,USA).IR1 658,IR3 366,IR2 934,IR1 711,IR1 453,IR1 245,and IR1 081=intensities of infrared spectra at 1 658,3 366,2 934,1 711,1 453,1 245,and 1 081 cm−1,respectively;R=correlation coefficient.
CONCLUSIONS
Long-term fertilization and rotation changed the composition,structure,and spectroscopic characteristics of soil HA.Fifty-two years of continuous fertilization increased SOC and total N contents relative to non-fertilization.In addition to the impacts on C,N,and O contents in HA,crop rotation strongly affected the C/N ratio in HA,and fertilization significantly influenced the O/C ratio.Relative to fertilization,non-fertilization resulted in higher O content and lower C content.Fertilization also led to higher aromaticity of HA,with more O-alkyl-C and phenolic-C.Abundant aliphatic-C groups were observed in HA in soil with MC,while higher O-alkyl-C,carbohydrate-C,aryl-C,phenolic-C,and free radicals and less carboxyl-C were observed in HA in soil with rotation corn.Hence,soil with RC was found to have more stable C in HA compared to soil with MC.Crop rotation plus fertilization led to structurally complicated organic materials,which could favor the sequestration of organic C.Moreover,the increase of OH group or the decrease of C=O in HA may promote the increase of SOC.Consequently,crop rotation should be considered as an effective way to preserve humic substances in agricultural soil,especially when fertilizer is also applied.Therefore,HA composition could be used as an indicator of the relative soil C sequestration ability,soil quality,and crop management practice.
ACKNOWLEDGEMENTS
This study was supported by the National Natural Science Foundation of China(No.41571317),the Natural Science Foundation of Guangdong Province,China(No.2018 A030313940),and the Twelfth Five-Year National Science and Technology Support Project for Cycling of Agricultural Science and Technology Project,China(No.2012BAD14B00).We would like to express our appreciation to Agriculture and Agri-Food Canada for maintaining the long-term plots.We would also like to thank Mrs.Mary-Anne Reeb from Agriculture and Agri-Food Canada for providing technical assistance in humic acid extraction.
杂志排行
Pedosphere的其它文章
- Notes to Authors
- Agricultural and environmental challenges in agroecosystems
- In Commemoration of Professor Tianren YU’s 100th Anniversary
- Microbial diversity assembled from series-diluted suspensions of diseasesuppressive soil determines pathogen invasion resistance
- Global patterns of phosphorus transformation in relation to latitude,temperature and precipitation
- Interactive effects of elevated CO2 and nitrogen fertilization levels on photosynthesized carbon allocation in a temperate spring wheat and soil system