Lotus Leaf‑Derived Gradient Hierarchical Porous C/MoS2 Morphology Genetic Composites with Wideband and Tunable Electromagnetic Absorption Performance
2021-03-08FeiPanZhichengLiuBaiwenDengYanyanDongXiaojieZhuChuangHuangWeiLu
Fei Pan, Zhicheng Liu, Baiwen Deng, Yanyan Dong, Xiaojie Zhu, Chuang Huang, Wei Lu
ABSTRACT Inspired by the nature, lotus leaf‑derived gradient hierarchi‑cal porous C/MoS2 morphology genetic composites (GHPCM) were suc‑cessfully fabricated through an in situ strategy. The biological microstruc‑ture of lotus leaf was well preserved after treatment. Different pores with gradient pore sizes ranging from 300 to 5 μm were hierarchically distrib‑uted in the composites. In addition, the surface states of lotus leaf resulted in the Janus‑like morphologies of MoS2. The GHPCM exhibit excellent electromagnetic wave absorption performance, with the minimum reflec‑tion loss of − 50.1 dB at a thickness of 2.4 mm and the maximum effective bandwidth of 6.0 GHz at a thickness of 2.2 mm. The outstanding perfor‑mance could be attributed to the synergy of conductive loss, polarization loss, and impedance matching. In particularly, we provided a brand‑new dielectric sum‑quotient model to analyze the electromagnetic performance of the non‑magnetic material system. It suggests that the specific sum and quotient of permittivity are the key to keep reflection loss below − 10 dB within a certain frequency range. Furthermore, based on the concept of material genetic engineering, the dielectric constant could be taken into account to seek for suitable materials with designable electromagnetic absorption performance.
KEYWORDS Morphology genetic materials; Lotus leaf; Electromagnetic wave absorption; Gradient hierarchical porous structure;
1 Introduction
In recent years, with the gradual rise of 5G technology, more and more electronic devices rapidly appear in the world. These new‑style products bring convenience to our life, and they also cause electromagnetic radiation problem, threat‑ing to our health [1]. In view of this background, it is urgent to develop electromagnetic absorbing or shielding materi‑als in the GHz frequency band to overcome this problem. Electromagnetic wave (EMW) absorber, which composed of dielectric loss component and magnetic loss compo‑nent, can convert electromagnetic wave into other forms of energy through synergistic action of different loss mecha‑nisms and impedance matching [2]. At present, researches on the properties of EMW absorbers mainly focus on four aspects, including low filling ratio, low matching thickness, wide effective frequency band, and strong reflection loss [3]. From traditional materials such as graphene [4], carbon nanotubes [5], and ferrites [6] to new generation materials such as MOFs [7], aerogel [8], and MXene [9], all have been successfully fabricated and exhibit gratifying EMW absorp‑tion performance.
In nature, the morphological structure of organisms has undergone eons of evolution, showing the characteristics of fine structure and functional integration. Based on the enlightenment from this perspective, the concept of mor‑phology genetic materials (MGMs) has been proposed in recent years, focusing on the functionalization of materials while preserving the morphological structure of the organ‑ism itself [10]. In past few years, it has been found that the carbon skeleton of plants, animals, or microorganisms obtained by carbonization treatment at high temperature has the potential to be a good EMW absorber [11]. Moreover, introducing some special structural treatment methods in the preparation process can effectively enhance the absorption performance. Hole‑creating is a frequently used idea to opti‑mize the EMW absorbing properties of MGMs. The exist‑ence of mesoporous hole can not only increase the reflection of EMW inside the material, but also effectively adjust the dielectric according to Maxwell-Garnet model [12]. In the field of EMW absorption materials, potassium hydroxide activation and low temperature sublimation are often used to enrich the pore structure of MGMs. Zhou et al. used fish skin as carbon source to fabricate 3D carbon foams that exhibit a minimum reflection loss (RL) of − 33.5 dB at 3 mm with an effective bandwidth of 8.6 GHz (RL< − 10 dB). After KOH treatment, the pore structure of fish skin was greatly improved, resulting in the enhanced EMW properties [13]. Liang et al. fabricated natural eggplants‑derived silicon car‑bide aerogels by freeze‑drying. The moisture in the eggplant run off at low temperatures to process a three‑dimensional porous structure, which increases the specific surface area of the material. The obtained aerogels showed a minimumRLof − 43 dB at 2 mm thickness and an effective band‑width of more than 4 GHz [14]. Although the results of hole‑creating engineering are satisfactory, the complicated treatment processes may destroy the intrinsic morphology of the raw material, which is contrary to the original intention of the MGM design. Therefore, it is still challenging to find new biological materials with unique morphology genetic structure in nature and explore the influence of structure on performance.
In the design of EMW absorber, few works were concen‑trated on the gradient hierarchical porous structure and Janus structure. For the former, because the synthesis process cannot be precisely regulated under the micron and nanom‑eter size, the general material system can hardly obtain the structure of pore classification arrangement with different diameters. According to waveguide theory, when the wave‑length is two times higher than the length of the waveguide’s cross section, the microwave would be attenuated inside the waveguide [15]. Different apertures correspond to different wavelengths of EMW, which means that the graded distribu‑tion of the pore structure is beneficial to the broadening of bandwidth. Lotus leaf, as one of the most common plants in summer, is composed of interlayer with different pore sizes, which is quite consistent with the construction of hierar‑chical porous structure. More interestingly, the presence of papillae makes the front side of the lotus leaf appear hydro‑phobic, distinct from the hydrophilic structure on the back side. This Janus‑like structure endows the anisotropy of the lotus leaf due to the asymmetry in the morphology and the difference in surface chemistry [16]. At present, research for preparing Janus particles at the nanoscale has been applied to the absorber. Shi et al. fabricated Fe3O4/PDA asymmet‑ric Janus nanoparticle via polymerization of dopamine in a Pickering emulsion. The obtaining nanocomposite showed strongRL(− 50 dB) and wide bandwidth which covered 70% of whole frequency range [17]. Therefore, the different properties on both sides of lotus leaf provide the possibility to construct Janus structure at the microscale. Unfortunately, there is currently no research on EMW absorbing materials with lotus leaf as carbon source.
In addition to the selection of the MGM, the composite is also an important strategy to improve the EMW absorp‑tion performance. Due to the high degree of graphitization, the MGM leads to excess conductivity in the system, mak‑ing the material approach to the ideal conductor and prevents the EMW from entering the material [18]. On the one hand, the composite strategy can effectively adjust the conductive loss of the MGM because of “throttling” effect; on the other hand, heterogeneous interface and defects are formed in the final binary system, which increases the polarization loss [19]. Molybdenum disulfide (MoS2), a transition‑metal dichalcoge‑nides with similar structure to graphite, has been widely used in functional materials. The Mo atomic layer is bound between the two S atomic layers by Vander Waals interactions [20]. Under the alternated electromagnetic field, dissipated current in MoS2is formed by the induced electrons shifting along the molecular network, resulting in a good response to EMW [21]. This excellent electromagnetic response and stable physi‑cal and chemical properties make MoS2a popular composite choice. So far, MoS2has been combined with ZnO [22], FeS [23], RGO [24], and Fe3O4[25] to obtain excellent absorbing performance. However, there is still a lack of report on the composite of MoS2and MGM.
Herein, we successfully prepared lotus leaf‑derived GHPCM morphology genetic composites by an in situ method and followed by a carbonization process. A moderate heating rate makes lotus leaf to retain its original morphology after carbonization, including frontal papillae morphology. The hierarchical porous structure with gradient pore sizes and MoS2with Janus morphologies are obtained in the MGM composites. More importantly, good electromagnetic perfor‑mance was obtained in the MGM composites: a minimumRLof about − 50.1 dB at 13.24 GHz with thickness of 2.4 mm and the maximum effective bandwidth of 6.0 GHz from 11.6 to 17.6 GHz at thickness of 2.2 mm, covering the whole Ku band. Moreover, a dielectric sum‑quotient model is put for‑ward for the first time to analyze the absorption performance from a computational perspective. This work makes full use of the advantages of MGM and obtain a hierarchical porous morphology via a facile synthesis method, which is hard to achieve from traditional materials. The present results sug‑gest that developing highly efficient EMW absorbing materials from nature will be a renewable, eco‑friendly, and feasible way in future.
2 Experimental Section
2.1 Materials
Lotus leaf were purchased from Yangqingtang (Jiangsu, China). Thiourea (NH2CSNH2) and ammonium molybdate tetrahydrate [(NH4)6Mo7O24·4H2O] were both obtained from Sinopharm Chemical Reagent Co., Ltd., Beijing, China. All chemical reagents are of analytical grade and used were used as received without further purification. Deionized water obtained from a Milli‑Q system was used all the time.
2.2 Preparation of GHPCM
The preparation of GHPCM is illustrated in Fig. 1, and the detail steps are as follows: First, the dried lotus leaves was cut into 2 × 2 cm2square slices and washed with alcohol and deionized water for several times. Then, six pieces of lotus leaves slices, 1 g of thiourea, and 0.2 g ammonium molyb‑date tetrahydrate were added into 30 mL deionized water, following by vigorous stirring for 0.5 h. The mixed solu‑tion was transferred into a tetrafluoroethylene‑lined stainless steel autoclave heated at 200 °C for 24 h to obtain hydrother‑mal C/MoS2. The resulting black slices were washed with deionized water via a suction filtration process, drying over‑night at 60 °C. Finally, the dried powder was heated to X °C (X = 600, 700, 800) and held it for 1 h in Ar atmosphere at a rate of 1 °C min−1. After cooling to room temperature with furnace, the final GHPCM were denoted as LCMS‑600, LCMS‑700, and LCMS‑800, respectively.
2.3 Preparation of Pure MoS2 and Pure Lotus Leaf Carbon
Pure MoS2and lotus leaf carbon was also fabricated as a control group in order to study the influence of components on the absorption performance. 1 g of thiourea and 0.2 g ammonium molybdate tetrahydrate were added into 30 mL deionized water, following by vigorous stirring for 0.5 h. The mixed solution was transferred into a tetrafluoroeth‑ylene‑lined stainless steel autoclave heated at 200 °C for 24 h to obtain pure MoS2, which was denoted as PMS. After the same hydrothermal treatment without adding thiourea and ammonium molybdate tetrahydrate, lotus leaves slices were heated to 700 °C and held it for 1 h in Ar atmosphere at a rate of 1 °C min−1. The final black Lotus leaves were denoted as PLC‑700.
2.4 Characterizations
The X‑ray diffraction (XRD) studies were carried out on DX‑2700 X‑ray diffractometer using Cu‑Ka radiation (λ= 1.54 Å). The morphology was characterized by scan‑ning electron microscopy (SEM) and transmission electron microscopy (TEM). The thermogravimetry (TG) and dif‑ferential scanning calorimetry (DSC) curve was character‑ized using a Netzsch TG thermal gravimetric analyzer in a N2atmosphere 30-800 °C. The differential thermal analy‑sis (DTA) curve was characterized using a SDT Q600 in a N2atmosphere 30-800 °C. ASAP2460 instrument was used to characterize the nitrogen adsorption and desorption isotherms, and the specific surface area was measured by the Langmuir method. Pore size distribution was deduced from the absorption isotherms by density functional theory. Raman spectrum was characterized by a cryogenic matrix isolated Raman spectroscopic system using a 532 nm laser. X‑ray photoelectron spectroscopy (XPS) was performed on a Thermo Scientific K‑Alpha spectrometer. Electrical con‑ductivities were detected by utilizing a standard four‑probe station (HPS2524). Based on coaxial line theory, the EMW parameters of samples were measured over the 2-18 GHz range in a vector network analyzer (VNA, 3672B‑S, Ceyear). Samples were prepared by uniformly mixing the products with paraffin at a mass fraction of 40 wt% and then com‑pacted into a columnar ring of 7.00 mm outer diameter and 3.04 mm inner diameter. The final complex permeability and complex permittivity were determined from the experimen‑tal scattering parameters through the standard Nicolson‑Ross and Weir theoretical calculations.
3 Results and Discussion
3.1 Characterization of GHPCM
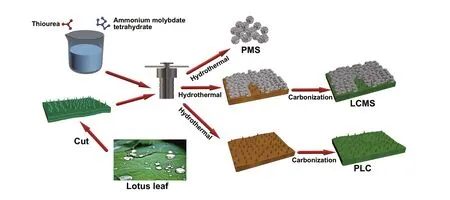
Fig. 1 Schematic illustration of the GHPCM formation process
The crystallographic structures and phase contents of the as‑synthesized samples were investigated by XRD analysis shown in Fig. 2a. As for PMS, the peaks at 14.3°, 32.7°, 39.5°, and 60.1° are assigned to (002), (100), (103), and (008) crystal planes of 2H-MoS2(JCPDS No. 37-1492) with hexagonal structure [24]. As for PLC, the peaks at 29.5° and 42.2° are assigned to (110) and (200) crystal planes of carbon (JCPDS No. 72-2091). As labeled in Fig. 2a, it can also be observed in the composites LCMS‑600, LCMS‑700, and LCMS‑800, which infers the existence of crystalline phases for both 2H-MoS2and carbon as well as the suc‑cessful synthesis of the composites. According to Scherrer equation:D= kλ/Bcosθ, whereDis the interplanar distance, k is the Scherrer constant,λis the X‑ray wavelength,Bis the line broadening at half the maximum intensity, andθis the scattering angle, the average size of MoS2crystalline particles is about 2.84 nm. To further explore the composi‑tion and molecular structure of the samples fabricated at dif‑ferent temperatures, the results of Raman spectroscopy are shown in Figs. 2b and S1a. Three peaks at about 280, 360, and 408 cm−1, originating from E1g, E12g, and A1gRaman vibrational modes of 2H-MoS2, respectively, are detected in the composites LCMS‑600, LCMS‑700, and LCMS‑800 [26]. In addition, two distinct peaks located at 1360 and 1580 cm−1are the D and G bands of the carbon phase, respectively [27]. Generally speaking, the D band is corre‑lated with the disorder or structure defects in thesp2‑hybrid‑ized carbon atoms or amorphous carbon deposits, while the G band is associated with the in‑plane vibrations ofsp2atoms in a 2D hexagonal graphitic lattice [28]. The inten‑sity ratio of two band (ID/IG) represents the disorder degree of material to some extent. Herein,ID/IGis calculated to be 0.87, 0.99, and 1.03 of LCMS‑600, LCMS‑700 and LCMS‑800, respectively, indicating the enhanced disordering with the increased carbonization temperatures. The weight loss of the LCMS‑700 during heat treatment is also detected by using TG‑ DSC and TG-DTA analysis under N2atmosphere from 30 to 800 °C (Fig. 2c and S1b). The first‑stage weight loss of about 5% appears from 50 to 200 °C and is prob‑ably resulted from the removal of surface adsorbed water or hydroxyls. And the second‑stage weight loss of about 25% occurred from 200 to 800 °C and is mainly attributed to the decomposition of organics in lotus leaves. Moreover, the two weight loss processes accurately correspond to the two endothermic processes on the DSC curve. Meanwhile, DTA curve also shows two endothermic signals.
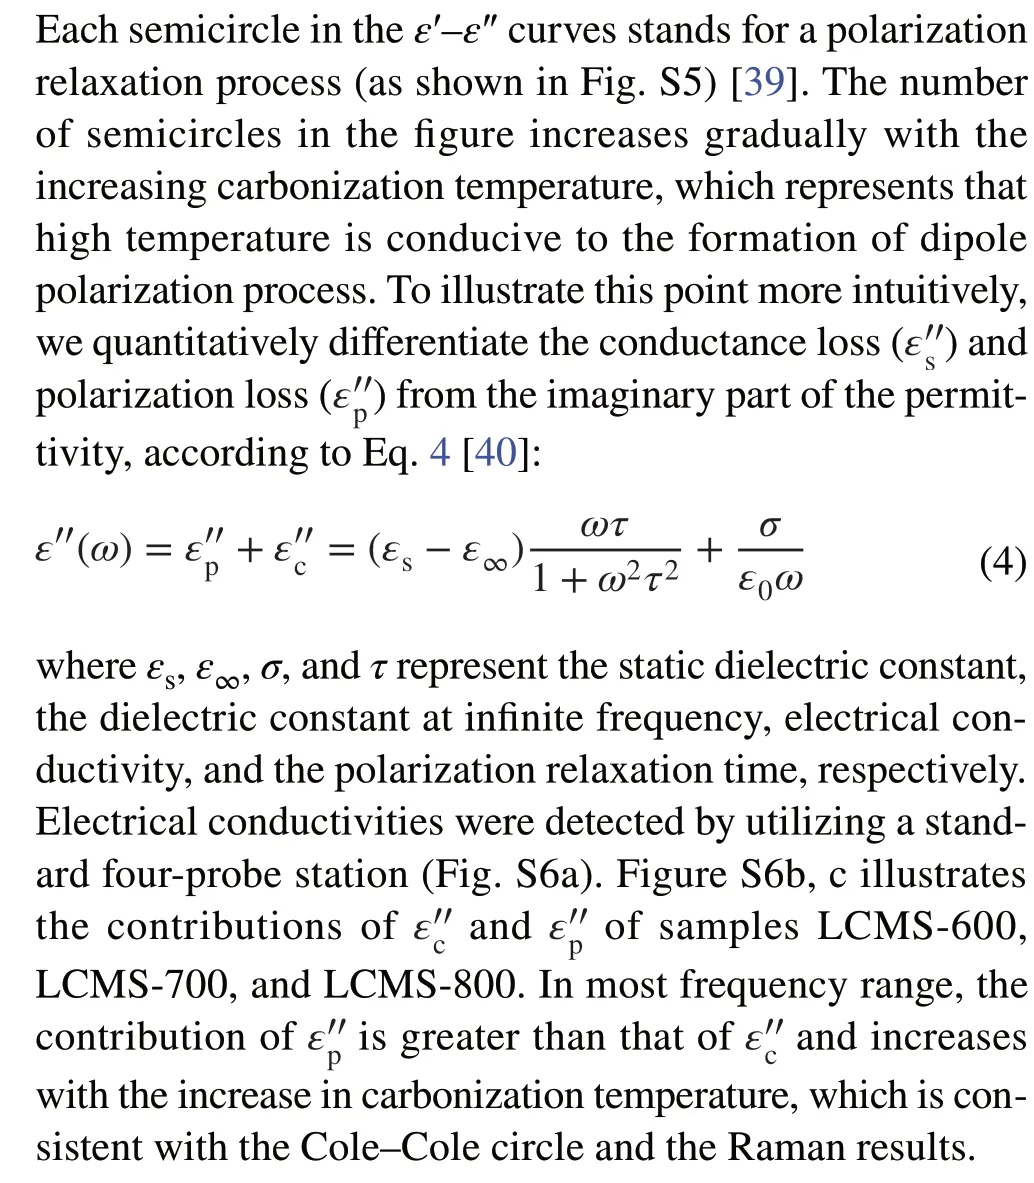
Figure 3 exhibits the SEM and TEM images of the as‑synthesized samples. Figure 3a shows the TEM image of the PMS which reveals a typical flower‑like architecture. The size of the flower formed by the assembly of the sheets is about 1 μm. The selected area electron diffraction (SAED) patterns in the insert exhibits distinct polycrystalline fringes. Therefore, it is inferred that under hydrothermal conditions, MoS2grains are stacked to form MoS2sheets, and thousands of sheets are stacked to form the flower‑like morphology subsequently. As shown in Fig. 3b, c, circular cone‑like papillae are neatly distributed on the surface of lotus leaf with micron‑sized holes surrounding. This unique structure on the front side was well maintained during the hydrother‑mal and carbonization processes and increases the contact angle when lotus leaf comes into contact with water drop‑lets, resulting in hydrophobic characteristics of surface. In addition, the GHPCM are clearly visible in the SEM images shown in Fig. 3d-f. The results indicate that carbonizing at 1 °C min−1is a suitable condition to maintain the original morphology of MGM. From Fig. 3d, e, a broken GHPCM is selected to facilitate the analysis of the internal hierarchi‑cal structure of lotus leaf. We simply divide the lotus leaf into three layers, which are named as huge‑macropore layer, loose‑packed macropores layer, and close‑packed macropo‑res layer, respectively. In the macropore layer, a honeycomb arrangement of square cavities with apertures above 300 μm is discovered. The original bound water or organics in the cavity is sufficiently volatilized during carbonization. Pore sizes of loose‑packed macropores layer and close‑packed macropores layer are similar, which are between 5 and 10 μm. The difference between them is the spacing between the pores. As for loose‑packed macropores layer, pore and pore are connected by a carbon layer of 15 μm, while pores in close‑packed macropores layer are directly in contact with each other. Thus, the lotus leaf formed with triple‑layer con‑nection has a hierarchical structure with multiple types of pores, which is rarely observed in other carbon‑based mate‑rials. As shown in Fig. 3f, it is clear that hundreds of MoS2flowers lay on the surface of the lotus leaf. The relevant elemental distribution of the GHPCMs is shown in Fig. 3g-i and details are presented in supplementary material (Fig. S2 and Table S1). According to the results, the distribution of S and Mo elements are almost the same, and the correspond‑ing atomic ratio is also close to 2:1, which further proves the successful preparation of MoS2. Besides, C content is quite low in mapping because stacked MoS2on the C surface makes the rays impenetrable. To study the specific surface area and distribution of pore size, the N2adsorption-des‑orption isotherms and pore diameter of LCMS‑700 are displayed in Fig. S1c. It can be seen that LCMS‑700 dem‑onstrates a representative type IV isotherm with a distinct hysteresis loop at theP/P0range of 0.4-1.0, which manifest the presence of mesoporous. Moreover, the result of Bar‑rett-Joyner-Halenda (BJH) indicates that the average pore diameter of LCMS‑700 mainly focuses at 2.4 and 20.7 nm. The mesoporous structure not only makes composites which possess specific surface area of 155.65 m2g−1, but also work together with the other pores shown by the SEM results to provide more paths for the reflection attenuation of EMW.

Fig. 2 a XRD patterns of samples. b Raman spectroscopy of GHPCM. c TG and DCS curve of the of GHPCM
From Fig. 4a-c and S4a-c, visible distinction in MoS2growth is displayed on two sides of lotus leaf. On the front side of the lotus leaf, MoS2all existed in flower‑like mor‑phology. While on the back side, most part of MoS2is flaked on the surface, and the remaining part exists in the form of hemisphere. The extraordinary growth mode of MoS2allows GHPCM to show an anisotropic structure similar to Janus on the microscopic level. In view of the morphology and characteristics of two sides of lotus leaf, the specific forma‑tion mechanism we speculated is shown in Fig. 4d. At the initial stage of hydrothermal process, MoS2sheets come into being first in the solvent. Due to the hydrophobicity of the front side and the hydrophilicity of the back side, the water solvent is more likely contacted with the back side, which makes the back side first covered with MoS2sheets. Fur‑thermore, the uneven surface of the front side which covers with papillae also limits the growth of MoS2sheets. As the reaction progresses, the high temperature gradually destroys the structure of the hydrophobic surface. At the same time, MoS2sheets in the solvent are assembled into flower‑shaped MoS2, which are dispersed on the front side with the mor‑phology presented in Fig. 4a. And the back side is against the flower‑shaped MoS2growth owing to the increased sur‑face energy caused by previous MoS2sheets.
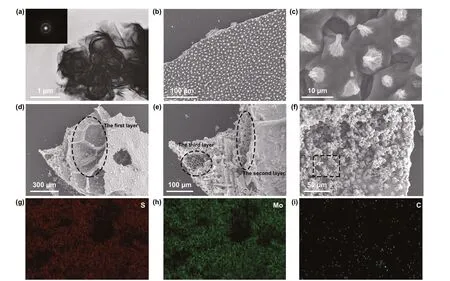
Fig. 3 a TEM images of PMS. b-c SEM images of PLC. d-f SEM images of LCMS‑700. g-i EDS of S, Mo, and C elements of LCMS‑700
The element analysis of GHPCM has been carried out by XPS to analyze the information on the surface electronic state and the composition of the samples. The XPS survey scan spectrum of the GHPCM in Fig. 5a indicated that the LCMS‑700 consisted of element C, O, Mo, and S. The core‑level spectra of C, Mo, and S are shown in Fig. 5b-d. As shown in Fig. 5b, the C 1s spectrum consisted of two peaks at ~ 285.8 and ~ 284.2 eV, which were related to C-O-C and C-C, respectively [25]. For Fig. 5c, the high‑resolution spectrum of Mo could be deconvoluted into three peaks. The Mo4+3d3/2(232.3 eV) and Mo4+3d5/2(229.1 eV) peaks belong to the semiconducting 2H‑phase MoS2. In the mean‑time, a satellite peak appears at 235.5 eV, which perhaps owe to the formation of Mo-S-C and Mo-C at the inter‑face between MoS2and carbon [20]. In addition, the peak at 226.2 eV is ascribed to S 2s [23]. The coexistence of two peaks is well demonstrated in the high‑resolution spectra of S 2p from Fig. 5d, where the peaks at ~ 161.7 and ~ 163.0 eV were consistent with the S2−2p3/2and S2−2p1/2orbitals, respectively [29]. These data further demonstrated that both carbon and MoS2were successfully combined, which can ultimately trigger intensive polarization loss to consume EMW energy.
3.2 Microwave Absorbing Property of GHPCM
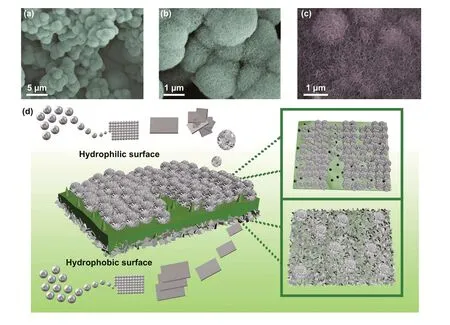
Fig. 4 a-b SEM images of front side of LCMS‑700. c SEM images of back side of LCMS‑700. d Schematic illustration of the Janus‑like struc‑ture formation process
In general, relative complex permittivity (εr=ε′ −jε″) and permeability (μr=μ′ −jμ″) are utilized to investigate the EMW properties of materials. The permeability (Fig. S4) is ignored due to the absence of a magnetic component, and the permittivity of samples is shown in Fig. 6a-c. In com‑mon, on the basis of electromagnetic theory, the real partsε′,μ′ and imaginary partsε′′,μ″ of permittivity and perme‑ability represent the storage and the dissipation capacity of EMW energy, respectively [30]. It can be clearly seen that the PLC‑700 exhibits the highestε′ andε″ value from 22.9 to 13.1 and 13.8 to 7.8, respectively. On the contrary, the PMS displays the lowestε′ andε″ value which fluctuates around 5 and 1. Once the MoS2is grown in situ on the surface of the lotus leaf,ε′ andε″ significantly decrease compar‑ing to that of the PLC and show an upward trend with the increased carbonization temperatures. In detail, theε′ values of LCMS‑600, LCMS‑700, and LCMS‑800 decrease from 3.7 to 3.4, 10.6 to 5.7, and 14.5 to 8.2, respectively. Simi‑larly, theε″ values of three samples gradually vary from 1.3 to 0.4, 4.9 to 4.3, and 5.0 to 6.7, respectively. On the basis of the dielectric loss theory, the conductive loss and polari‑zation loss are the main factors affecting the permittivity in 2-18 GHz range [31]. The conductance of materials can be simply expressed as a free electron formula (ε″ ≈σ/2πfε0), indicating that conductivity is directly proportional to theε″ [32]. And the polarization loss can be divided into interfacial polarization and dipole polarization [33].
To better analyze the dielectric loss, the samples were divided into two groups according to different compo‑nents and carbonization temperatures. Conductive loss plays a dominated role in the component group, which covers samples of PLC‑700, PMS and LCMS‑700. There are three modes of electrons transport in the conductive network, including migrating, hopping, and tunneling. The unique atomic structure and hybridization state of carbon materials give them excellent current conduction capa‑bility [3]. So, PLC has higher conductive loss than pure MoS2sample, resulting in a higherε″ value. When the low conductivity MoS2phases were grown on the surface of PLC, the conductivity of the originally flowing electrons is greatly reduced in the process of passing through these “obstacles.” As a result, the excess conductivity of MGM is tuned and a moderate permittivity is obtained at the same time. In addition to the conductive loss, the forma‑tion of interfacial polarization also plays a part of role. When MoS2is added, the potential difference between the carbon and MoS2causes charge accumulation at the inter‑face under electromagnetic field and intensifies the polari‑zation relaxation, which is helpful for dielectric loss [34]. To establish the relationship between interface structure and the permittivity, a Debye relaxation correction formula is described as Eqs. 1 and 2 [35]:
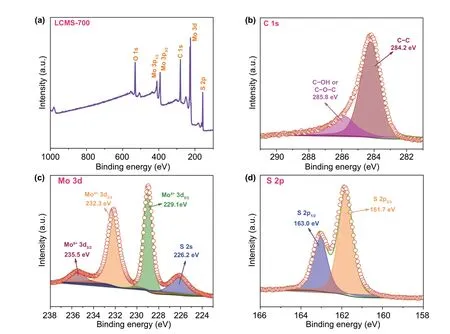
Fig. 5 a XPS survey scan spectra. XPS core‑level spectra of b C 1 s, c Mo 3d, and d S 2p of the LCMS‑700
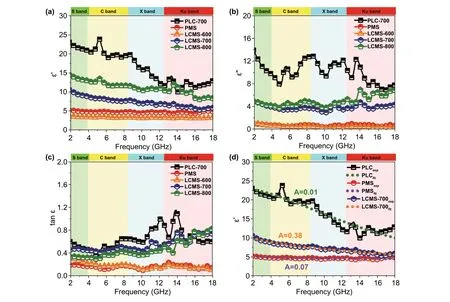
Fig. 6 a-b real and imaginary parts of permittivity. c Dielectric loss tangents. d Real part of permittivity of measured and empirical formula fit‑ted of PLC, PMS, and LCMS‑700

whereAis defined as the interface factor,ωis the angular frequency,τis viewed as the relaxation time,εrsandεr∞are the static dielectric constant and limiting dielectric constant, respectively. According to previous reports, the higher value ofA, the more interface polarization there are [35]. Fig‑ure 6d reveals the fitting curves of real part of permittivity, and the corresponding A values of PLC, PMS, and LCMS‑700 are 0.01, 0.07, and 0.38, respectively. The increased A value of LCMS‑700 represents that the combination MoS2and carbon effectively improves the interface polarization. Although LCMS‑700 is rich in interfacial polarization, it should be noted that the permittivity of LCMS‑700 is still lower than that of PLC‑700 because the proportion of inter‑facial polarization is much lower than the conductivity loss. Unlike the component group, dipole polarization is domi‑nant in the carbonization temperature group, covering sam‑ples of LCMS‑600, LCMS‑700, and LCMS‑800. Defect and functional groups on the surface of materials usually act as polarization center to bring about polarization relaxation under the impact of EMW field [36]. The intrinsic dipole moments of these centers cannot sum to zero, resulting in the dipole polarization. Once increasing the frequency of EMW field, the polarizability fails to maintain the origi‑nal state, enhancing the dielectric loss [37]. According to the previous Raman results, the disordering degree of the GHPCM increases with the increased carbonization temper‑atures, suggesting that the material has more surface defects at higher carbonizing temperature. The dipole polarization dominated by these defects makes the permittivity of sample LCMS‑600, LCMS‑700, and LCMS‑800 proportional to the temperature. A Cole-Cole semicircle model is used to better explain the polarization loss occurred in the EMW attenua‑tion, which is described as Eq. 3 [38]:

For further evaluating the EMW absorbing of the compos‑ites, theRLvalues at 0.5-5.0 mm thickness in the frequency range of 2-18 GHz are evaluated on the basis of transmis‑sion and Debye theory, which can be depicted as Eqs. 5 and 6 [41]:

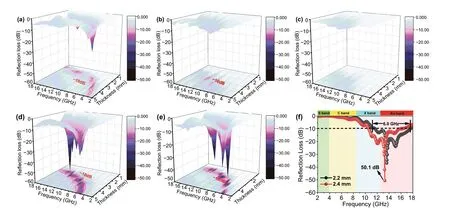
Fig. 7 3D reflection loss of the samples with different thicknesses (0.5-5.0 mm) from 2.0 to 18.0 GHz: a PLC, b PMS, c LCMS‑600, d LCMS‑700, and e LCMS‑800. f Reflection loss of LCMS‑700 from 2.0 to 18.0 GHz at 2.2 and 2.4 mm
whereZ0stands for the impedance of free space,Zinis the input impedance of the absorber,dis the thickness of the absorber, and c represents the velocity of light. Figure 7a-e displays the 3DRLcurves of the samples at different thick‑ness with 40% filling ratio. Generally speaking, the mini‑mumRLvalue lower than − 10 dB is often considered as a suitable absorber for practical applications due to 90% of the EMW energy can be attenuated in this situation. From Fig. 7a, b, we can see that the minimumRLvalue of the PLC‑700 is up to − 27.2 dB at 4.88 GHz when the thick‑ness is 3.5 mm. And only a negligible part of the effective absorption region indicates the poor absorption performance of the PMS sample. From Fig. 7d-f, it can be observed that LCMS‑700 and LCMS‑800 show an improved EMW absorption performance because of the tunable conductive loss and enhanced polarization loss. The minimumRLvalue of LCMS‑700 reaches − 50.1 dB at 13.24 GHz and the effec‑tive bandwidth is 5.80 GHz (from 10.52 to 16.32 GHz) with a thickness of only 2.4 mm. When the thickness reduces to 2.2 mm, the effective bandwidth is up to 6.04 GHz from 11.52 to 17.56 GHz, almost covering whole Ku band. If the carbonization temperature goes up to 800 °C, LCMS‑800 has a minimumRLvalue of − 44.2 dB and the corresponding effective bandwidth exceeding − 10 dB is 4.1 GHz. Both the absorption intensity and effective bandwidth are lower than that of the LCMS‑700 (Fig. S7). Due to the low carboniza‑tion temperature, LCMS‑600 shows poor absorbing perfor‑mance shown in Fig. 7c. Combined with previous analysis of EMW parameters, we speculate that the excessive high or excessive low permittivity count against getting good EMW absorption. To better illustrate this point, theRLvalues are codetermined by the attenuation constant and impedance matching [42]. The attenuation coefficient mainly measures the ability of EMW entering the material to be consumed by dielectric loss, as mentioned earlier. While the impedance matching refers to capacity that EMW can enter the material rather than being reflected on the surface. The attenuation coefficient (α) values of samples are calculated as Eq. 7, and relevant curves are displayed in Fig. 8a [43].

It can be found that theαof PLC‑700 exhibits the highest value than that of others, which indicates that the PLC‑700 possess the strongest attenuation ability. As the carboni‑zation temperature increases from 600 to 800 °C, values ofαincrease from 20, 50, and 41 to 40, 218, and 233 for LCMS‑600, LCMS‑700, and LCMS‑800 within 2-18 GHz, respectively, sharing the similar variation with permittivity. Figure 8b-f reveals a delta (Δ) model to evaluate the imped‑ance matching of the absorbers and the relevant calculation formula is shown as Eq. 8 [44]:

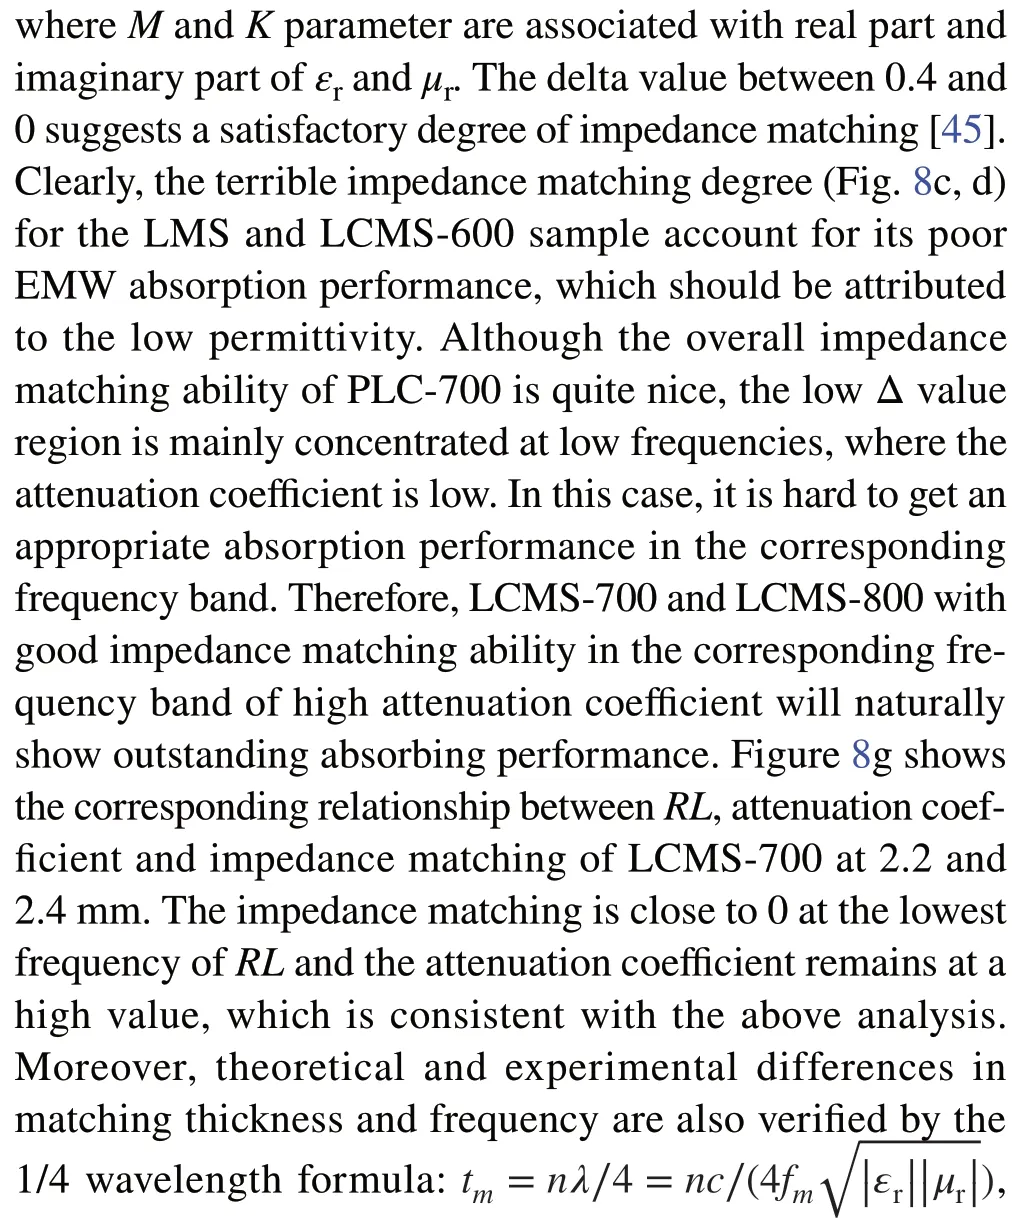
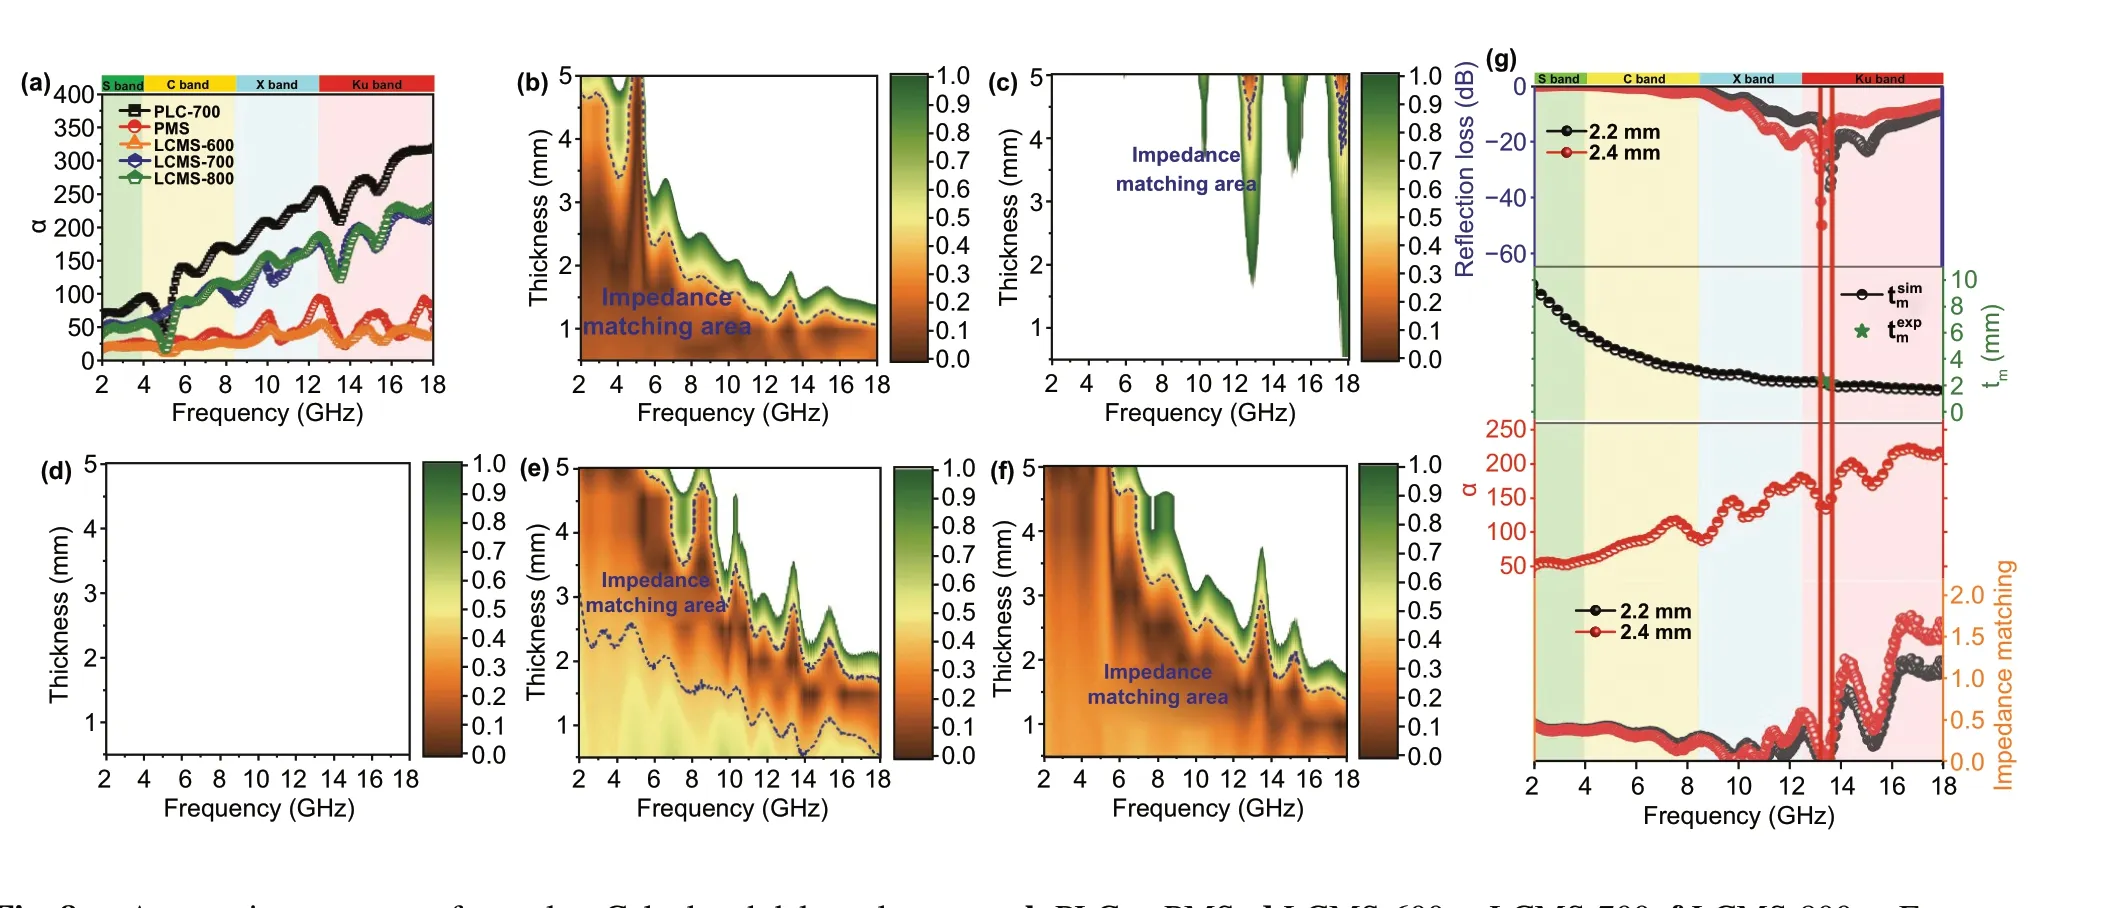
Fig. 8 a Attenuation constant of samples. Calculated delta value maps: b PLC, c PMS, d LCMS‑600, e LCMS‑700, f LCMS‑800. g Frequency dependent attenuation constant, reflection loss, delta value, and the quarter wavelength thickness of LCMS‑700
In recent years, few mathematical models and simulations have been applied in the analysis of absorbing materials to judge the consistency between the experimental results and theoretical results [48]. In this work, we set up a dielectric sum‑quotient model for the first time from the perspective of mathematical calculation to assist the analysis of the cause of the wide bandwidth of the LCMS‑700. In allusion to non‑magnetic system, we assume that the real and imaginary parts of the permeability over full frequency band are 1 and 0, respectively. By adjusting the numbers of the real and imaginary parts of the permittivity, it can be observed that the final effectiveRLvalue (RL< −10) is influenced by the sum and quotient of two parts. Subsequently,εtotalis defined as the sum of the real and imaginary parts of the permit‑tivity, and cotεis the quotient of the real and imaginary parts. The relationships betweenεtotal, cotε, thickness, fre‑quency, andRLare established and expressed in Fig. 9a-d, and the relevant data are shown in the supplementary mate‑rial (Table S2-S5). It can be concluded from the figures that with the increase of εtotal, the frequency band where the effectiveRLvalue (RL< −10) gradually moves to the low frequency and the effectiveRLvalue starts to appear at lower thickness. However, the effectiveRLband at the same thickness and cotεare reduced. Combined with the electromagnetic parameters of LCMS‑700,εtotalis close to 10 and cotεis close to 2 at the frequency whereRLis less than − 10. By matching this value to Fig. 9b, the effective frequency band of LCMS‑700 is basically matched with the calculated results. The dielectric sum‑quotient model not only verifies the authenticity of the experimental results, but also explains the reason why the material has a wide effec‑tive band from the perspective of calculation. In addition, this model will shed light on the designing consideration of the non‑magnetic EMW absorbing material systems with different frequency bands and thickness in the future.
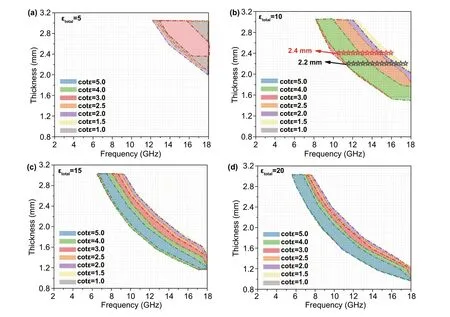
Fig. 9 Dielectric sum‑quotient model with cotε from 1.0 to 5.0: a εtotal = 5, b εtotal = 10, c εtotal = 15, and d εtotal = 20
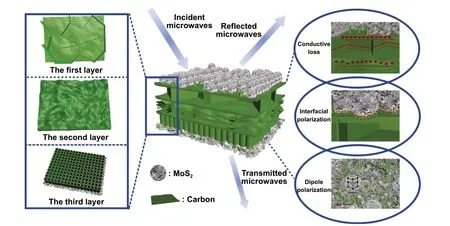
Fig. 10 Schematic illustration of the EMW mechanism in the LCMS‑700
Finally, the mechanism of the excellent EMW absorp‑tion performance of LCMS‑700 is shown schematically in Fig. 10. First of all, the interior hierarchical structures of lotus leaf can be regarded as the result of three layers, including huge‑macropore layer, loose‑packed macropores layer, and close‑packed macropores layer. Due to porous structure of each layer, the EMW entering the material will be reflected back and attenuated in the pores with differ‑ent sizes. Second, electrons in carbon could absorb EMW energy to migrate in surface/interlayer channels and then convert energy by colliding with the lattice. Moreover, below the percolation threshold, the samples are dispersed in paraf‑fin to form a network of conductance. More electrons hop between different layers of carbon and network conductiv‑ity enhances, converting more EMW energy to heat energy. Third, capacitor‑like structures would be generated at the interface of heterogeneous interface, which is also named as interfacial polarization. The addition of MoS2introduces the interfacial polarization and modifies the dielectric con‑stant of the samples, so that the impedance matching under high attenuation coefficient is improved. Fourth, numbers of functional groups and defects lead to the asymmetric charge distributions, resulting in the formation of dipoles. Increas‑ing the concentration of dipole polarization makes LCMS‑700 suffering more polarization relaxation process, which is beneficial to dielectric loss of the material. In the end, we compared the |RL|, effective bandwidth versus thickness for the MGM‑based absorption materials published in the recently literature, as shown in Fig. 11 (details in Table S2) [49-58]. It clearly suggests that the outstanding EMW absorption performance of the lotus leaf‑derived GHPCM morphology genetic composites (LCMS‑700) makes it a potential candidate for practical application in EMW field.
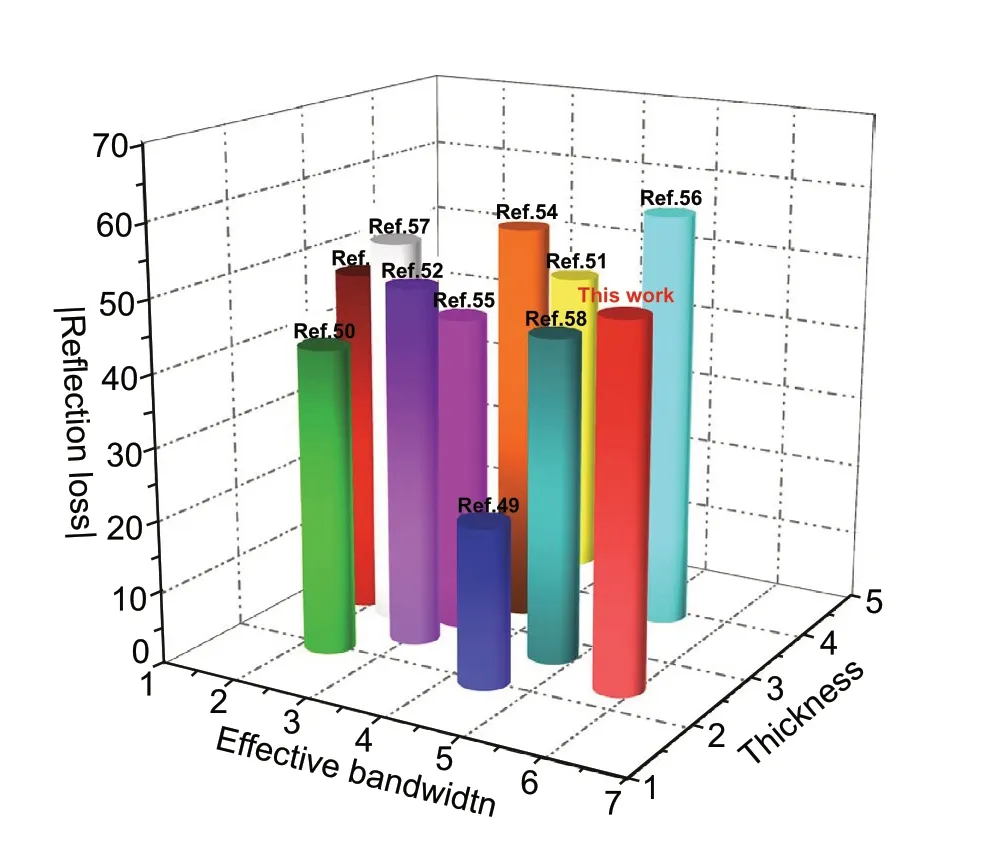
Fig. 11 EMW absorption performance of MGM‑based materials
4 Conclusion
material in this article are included in the article’s Creative Com‑mons licence, unless indicated otherwise in a credit line to the material. If material is not included in the article’s Creative Com‑mons licence and your intended use is not permitted by statutory regulation or exceeds the permitted use, you will need to obtain permission directly from the copyright holder. To view a copy of this licence, visit http://creat iveco mmons.org/licen ses/by/4.0/.
In this study, morphology genetic C/MoS2composites with gradient hierarchical porous structure were successfully fabricated by a facile in situ method. The morphological structures and the EMW absorption properties of the syn‑thesized GHPCM samples were systematically studied. The obtained morphology genetic C/MoS2composites have a variety of pore structures, giving full play to the peculiar and exquisite features of the morphology of the MGM. Besides, the papillae and hydrophilic-hydrophobic properties of lotus leaf resulted in the Janus microstructure of flower‑like and sheet‑like MoS2. The EMW absorption properties of the GHPCM could be conveniently tuned by the carbonization temperature. Remarkably, LCMS‑700 sample achieved a strong reflection loss value of − 50.1 dB at the thickness of 2.4 mm and reaches an effective bandwidth of 6.0 GHz at a relatively thin thickness of 2.2 mm. The multistage pore structure in lotus leaf provides more channels for the reflection and attenuation of EMW. And the introduction of MoS2not only enhances the interfacial polarization but also regulates the excessive dielectric of lotus leaf, which optimizes the impedance matching of composite. Particu‑larly, a dielectric sum‑quotient model is put forward based on the mathematical calculations to further verify the experi‑mental results. This investigation provides a new paradigm for the development of pure dielectric loss EMW absorbing materials by taking advantages of the morphology genetic materials and sheds light on the designing consideration of the non‑magnetic EMW absorbing material systems in the future.
AcknowledgementsThis project was supported by the National Natural Science Foundation of China (Nos. 51971162, U1933112, 51671146), the Program of Shanghai Technology Research Leader (18XD1423800), and the Fundamental Research Funds for the Cen‑tral Universities (22120180096).
Open AccessThis article is licensed under a Creative Commons Attribution 4.0 International License, which permits use, sharing, adaptation, distribution and reproduction in any medium or format, as long as you give appropriate credit to the original author(s) and the source, provide a link to the Creative Commons licence, and indicate if changes were made. The images or other third party
Supplementary InformationThe online version of this article (https://doi.org/10.1007/s4082 0‑020‑00568‑1) contains supplementary material, which is available to authorized users.
杂志排行
Nano-Micro Letters的其它文章
- Laser Synthesis and Microfabrication of Micro/Nanostructured Materials Toward Energy Conversion and Storage
- Band Engineering and Morphology Control of Oxygen‑Incorporated Graphitic Carbon Nitride Porous Nanosheets for Highly Efficient Photocatalytic Hydrogen Evolution
- A Bulk‑Heterostructure Nanocomposite Electrolyte of Ce0.8Sm0.2O2‑δ–SrTiO3 for Low‑Temperature Solid Oxide Fuel Cells
- Present and Future of Phase‑Selectively Disordered Blue TiO2 for Energy and Society Sustainability
- Efficient Catalytic Conversion of Polysulfides by Biomimetic Design of “Branch‑Leaf” Electrode for High‑Energy Sodium–Sulfur Batteries
- Magnetic Array Assisted Triboelectric Nanogenerator Sensor for Real‑Time Gesture Interaction
