The efficiency and accuracy of probability diagram,spatial statistic and fractal methods in the identification of shear zone gold mineralization:a case study of the Saqqez gold ore district,NW Iran
2021-03-03MirmahdiSeyedrahimiNiaraqAminHekmatnejad
Mirmahdi Seyedrahimi-Niaraq •Amin Hekmatnejad
Abstract In this study,geochemical anomaly separation was carried out with methods based on the distribution model,which includes probability diagram(MPD),fractal(concentration-area technique),and U-statistic methods.The main objective is to evaluate the efficiency and accuracy of the methods in separation of anomalies on the shear zone gold mineralization.For this purpose,samples were taken from the secondary lithogeochemical environment(stream sediment samples)on the gold mineralization in Saqqez,NW of Iran.Interpretation of the histograms and diagrams showed that the MPD is capable of identifying two phases of mineralization.The fractal method could separate only one phase of change based on the fractal dimension with high concentration areas of the Au element.The spatial analysis showed two mixed subpopulations after U=0 and another subpopulation with very high U values.The MPD analysis followed spatial analysis,which shows the detail of the variations.Six mineralized zones detected from local geochemical exploration results were used for validating the methods mentioned above.The MPD method was able to identify the anomalous areas higher than 90%,whereas the two other methods identified 60%(maximum)of the anomalous areas.The raw data without any estimation for the concentration was used by the MPD method using aminimum of calculations to determine the threshold values.Therefore,the MPD method is more robust than the other methods.The spatial analysis identified the detail soft hegeological and mineralization events that were affected in the study area.MPD is recommended as the best,and the spatial U-analysis is the next reliable method to be used.The fractal method could show more detail of the events and variations in the area with asymmetrical grid net and a higher density of sampling or at the detailed exploration stage.
Keywords Shear zone gold deposit·Modeling of probability diagram method·Concentration-area fractal method·U-spatial statistics method·Phases of efficiency and accuracy mineralization
1 Introduction
Varieties of different anomaly separation methods were proposed in calculating threshold values during last two decades(Sinclair 1974,1991;Govett et al.1975;Cheng et al.1994,2000;Yusta et al.1998;Cheng 1999;Gonc¸alves et al.2001;Li et al.2003;Lima et al.2003;Zuo et al.2009;Ghavami-Riabi et al.2010;Ghannadpour and Hezarkhani 2016;Ghezelbash and Maghsoudi 2018;Liu et al.2019;Yousefi et al.2019).These methods were used for different case studies but not often compared to each other at the same time.Modeling of probability diagram(MPD),spatial analysis techniques such as moving average,Kriging,U-statistic,and fractal(concentration-distance and concentration-area diagrams)are some of the geochemical anomaly separation methods.In some of these methods,the statistical distribution is considered for calculation of threshold value(Sinclair 1991;Cheng 1999;Li et al.2003).
The probability diagram was applied in statistical data analysis a long time ago(Hazen 1967).Later,this diagram was modeled to calculate the threshold value and separate the anomalous subpopulations from the background(Sinclair 1974).The result of modeling was concluded to evaluate the statistical characteristics of the anomaly subpopulation(s)(Fleischhauer and Korte 1990;Sinclair 1991;Rantitsch 2004;Ghavami-Riabi et al.2008,2010).The estimation of the number and intensity of mineralization phases are new applications of this method.
In some of the geochemical investigation methods,i.e.,the U-statistic method,the distance between the samples is used as a weight for separation of the background from anomaly(Cheng et al.1996,2000).In this method,a range of different U-value is calculated based on the defined radius.The maximum|U|value is a fundamental concept to optimize the anomaly separation(Cheng et al.1994;Li et al.2003;Ghavami-Riabi et al.2010;Darabi-Golestan et al.2013;Ghannadpour et al.2015;Ghannadpour and Hezarkhani 2016;Ghasemzadeh et al.2019)and select the best U-value.The number of geological and mineralization phases,which led to a specific variation of concentration,are determined on U-histogram.
Fractal geometry was applied in geochemical analyses,estimation of the threshold value,and separation of the background from anomaly(Lima et al.2003).The selfsimilarity of geochemical distribution for an element in geological environments was led to define fractal or multifractal characteristics(Bølviken et al.1992).The source of fractal characteristics might be the results of different geological processes such as petrogenesis,tectonic,metamorphism,and mineralization.These geological events could lead to depletion or/and enrichment of elements in the rock units and increase in the fractal dimension.The fractal dimension can be determined based on the analysis of variograms,the area-perimeter relation,concentrationarea,relation,and concentration–distance model(Bølviken et al.1992;Cheng et al.1994;Li et al.2003;Zuo et al.2009;Yousefi and Carranza 2015;Ghasemzadeh et al.2019;Madani and Sadeghi 2019;Swain et al.2019).
In this article,anomaly separation was done by modeling of probability diagram(MPD),fractal(concentrationarea),and U-statistic methods.The main objective of this research is to evaluate the accuracy and precision of these methods.The geochemical data of an area with sufficient geological evidence for mineralization was used to have a high accuracy of evaluation.In this case,a shear zone gold mineralization was examined in the current investigation.In the study area,regional and local geochemical exploration programs were finished,and the mineralized areas and ore deposits were discovered.
2 Geological setting
The study area is part of the Saqqez geological sheet,which is located 20 km southwest of Saqqez city(Fig.1).From the structural point of view,the Saqqez sheet is located in the northwestern margin of the Sanandaj-Sirjan metamorphic belt and the intersection of this zone with the Khoy-Mahabad and Alborz-Azarbayjan structural zones.Therefore,the rock units in this sheet have different characteristics.
The oldest rock units(Pre-Cambrian age)of the study area include gneiss,schist,marble,and amphibolite,which were covered by clastic-carbonate rocks of lower Pre-Cambrian to Pre-Cambrian sandstone and thick Permian limestone and granite,shale,limestone,marble,and Cretaceous volcanic rocks.There are lower metamorphic facies,such as Kahar Formation,sandwiched between the metamorphic rocks.The intensity of the metamorphism in this complex ranges from green schist to amphibolite facies(GSI 2003).
Pre-Cambrian metamorphic rocks were intruded by granitoid stocks,which are the oldest granitoid in the study area and belong to Pre-Cambrian(symbol G1in Fig.1).Some major intrusive activities also affected these metamorphic rocks.During Mesozoic and Cainozoic,some other granitoid stocks cut the metamorphic rocks and the Paleozoic clastic-carbonate cover.These igneous activities could be considered as a signature of hydrothermal skarn type metallic mineralization(Haydari 2004;Yang et al.2008;Mollai et al.2009).
During the Jurassic period,shale and sandstone rocks covered the oldest units,and in some parts of the study area,basaltic rocks were exposed.
The tectonic stress affected most of the rocks in the study area and led to faulted or tectonic contact.The more popular trends of the faulted zones are NW–SE and NE–SW(GSI 2003).
Acidic to underlying metavolcanic rocks hosted the gold mineralization that was deformed and fractured to form mylonite and ultra-mylonite facies in the study area.The hydrothermal fluids have altered these rocks to sericite,chlorite,carbonate,and formation of quartz and sulfide(Haydari 2004).Silicification,sulfidization,and carbonization represent the proximal,and sericitization and chloritization represent the distal areas to the ore zone.
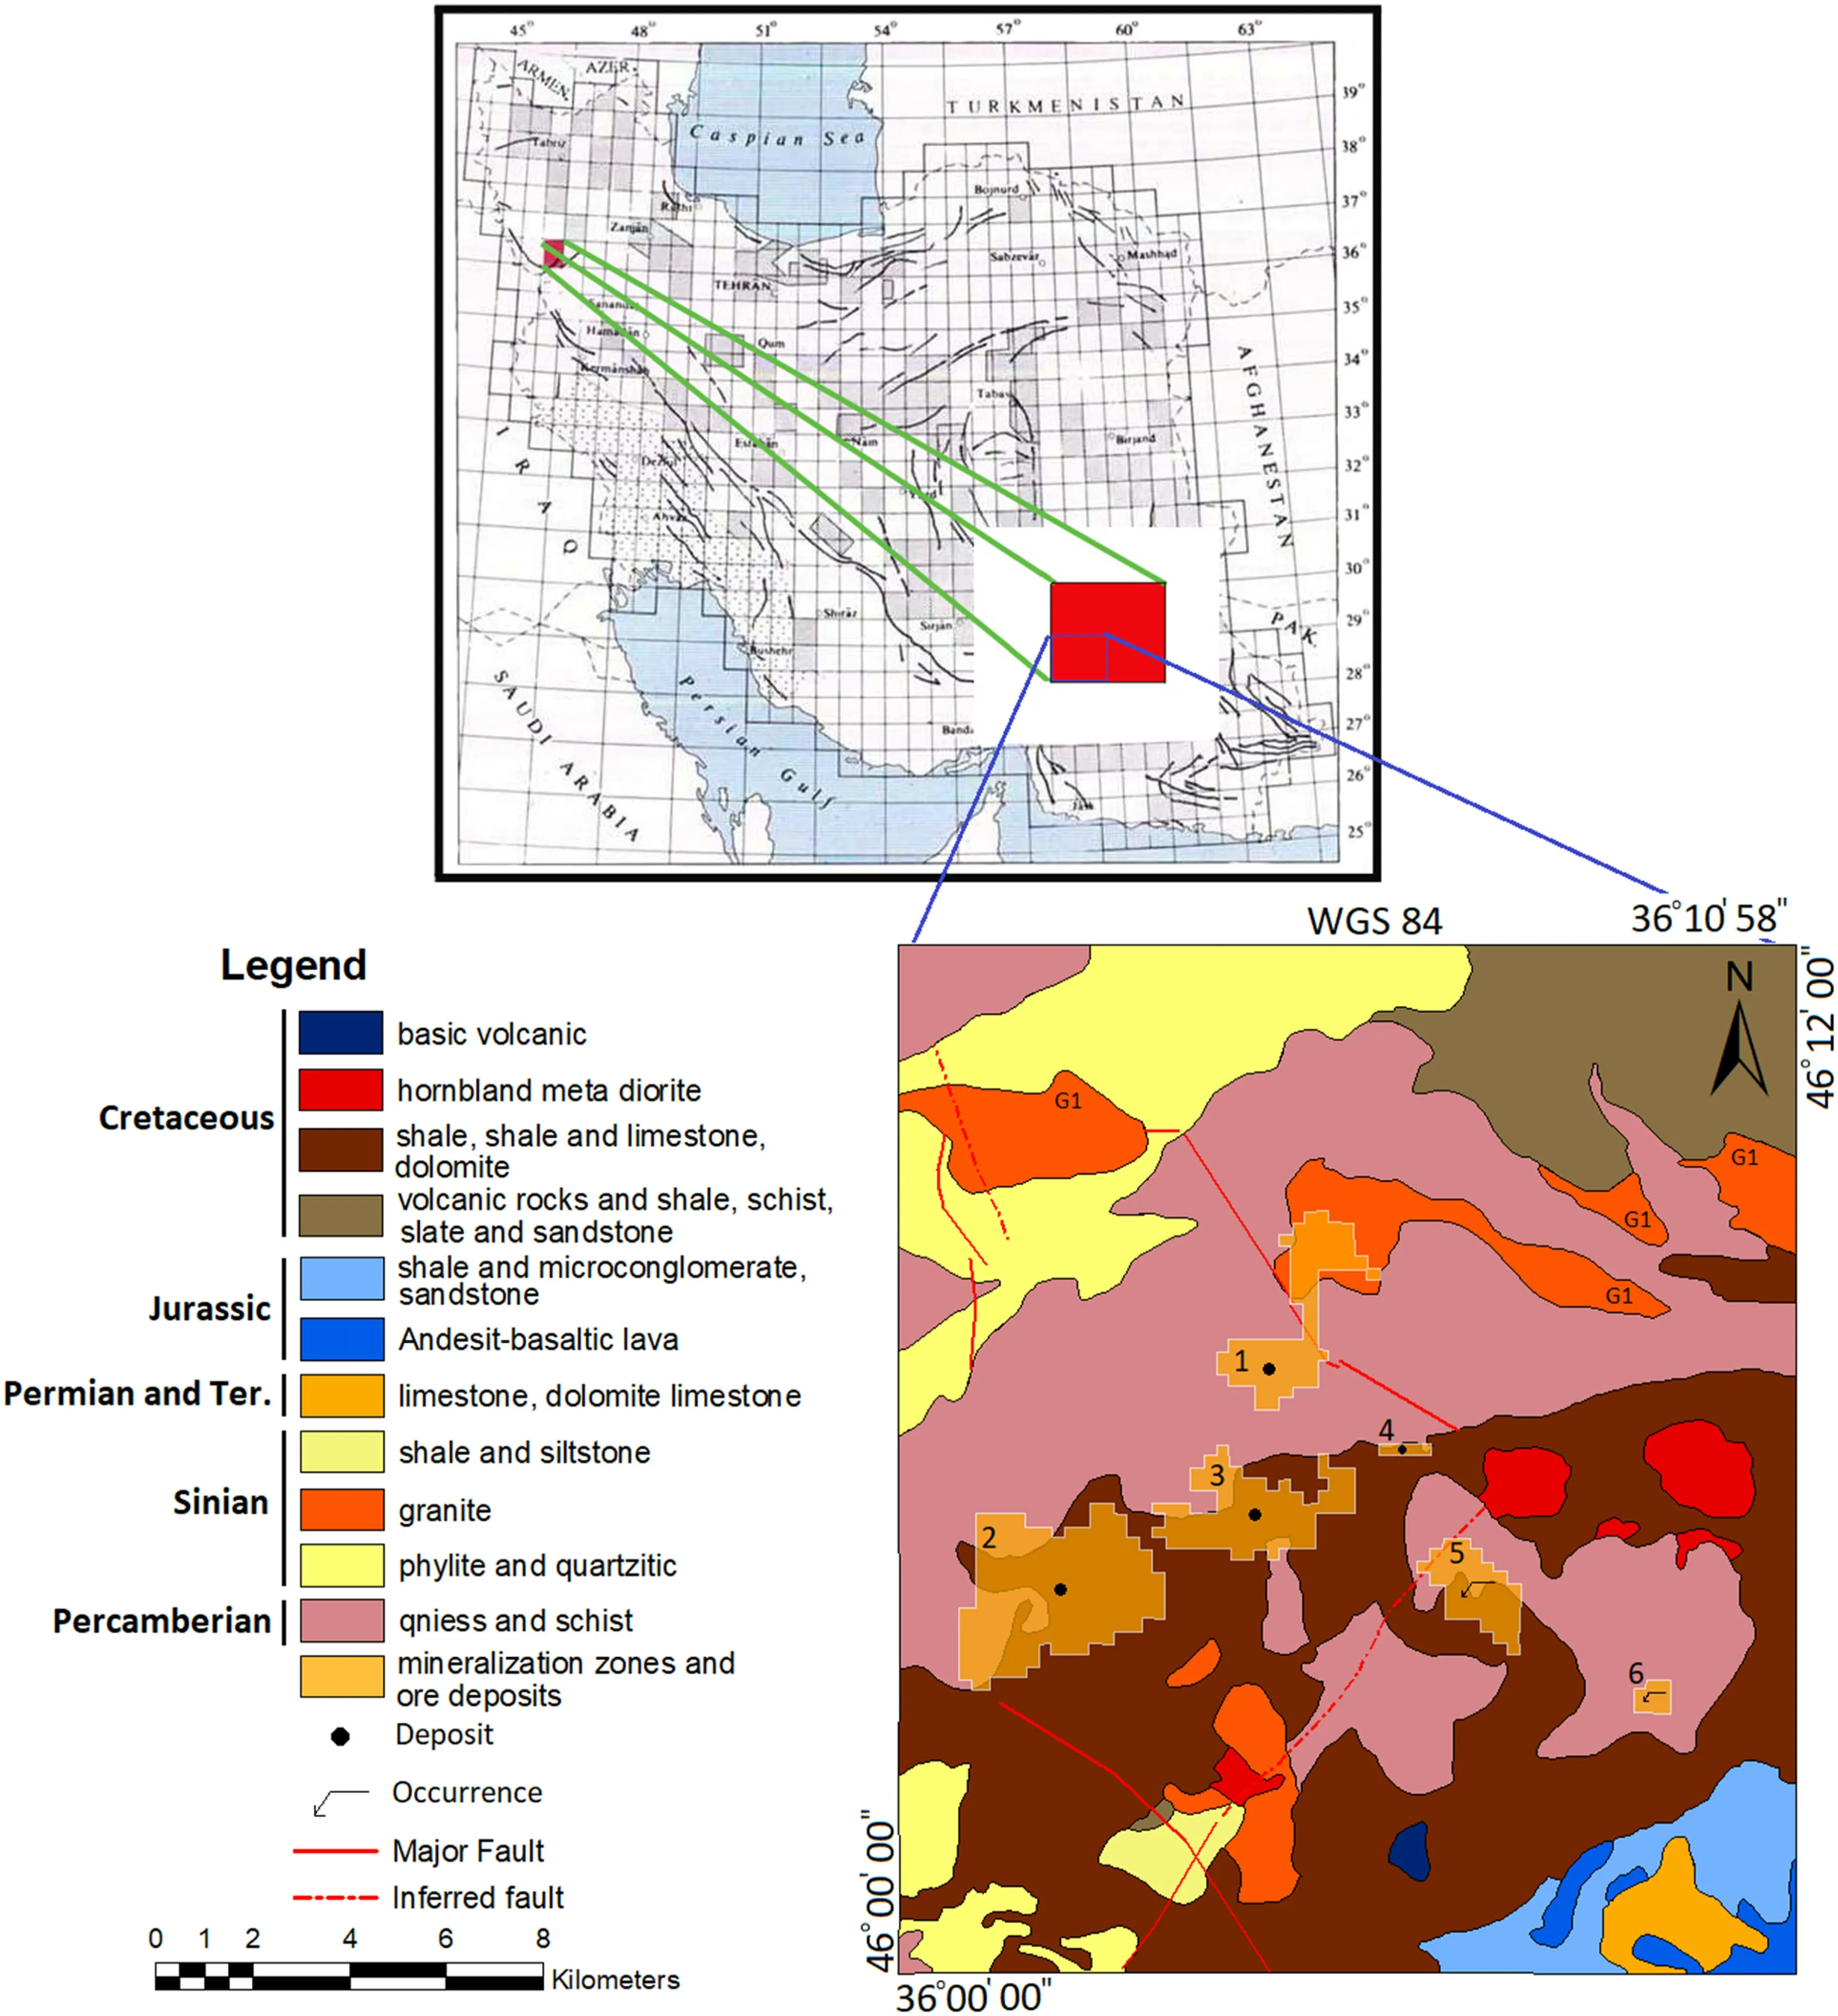
Fig.1 Geographical location and Geological map of Saqqez including gold mineralized areas(1)Gharajar,(2)Qolqola,(3)Kravian,(4)Ghabaqlocha and(5,6)occurrences(no name)(after GSI 2003)
In the study area,acidic to underlying meta-volcanic rocks were completely fractured into mylonite and ultramylonite and introduced as a shear zone(Haydari 2004).Gold mineralization within the shear zones is related to orogenic activities in metamorphic belts.This type of gold deposit is hosted by volcanic and sedimentary rocks(Eilu and Groves 2001).In this area,the surrounding rocks had chemically reacted with granitoid activities and hydrothermal fluids.These chemical reactions altered the rocks and led to some metallic hydrothermal mineralization.Some of the alteration processes include Sericitization,chloritization,silicification,sulphidization,and carbonization.These processes completed to shear zone gold mineralization.Sericitization and chloritization impressed the rocks further away from the mineralized center.The remaining alteration products have been extended in the interior zone and are closely related to the mineralized areas(Haydari 2004;Ghavami-Riabi et al.2010).Studies in the area have led to the exploration of several gold deposits and occurrences in the area.Which include:1—Gharajar,2—Qolqola,3—Kravian,4—Ghabaqlocha,and 5,6)occurrences.In order to compare the anomaly separation methods,the location of mineralization zones in the area is plotted on the geological map(Fig.1).Subsurface exploration programs have been carried out on the deposits of Gharajar,Qolqola,Kravian,and Ghabaqlocha.These mineralization zones were shown with numbers 1,2,3,and 4 on the geological map,respectively.Zones 5 and 6 in the southeast of the Kravian deposit did not include subsurface exploration and have been introduced as an occurrence.
3 Sampling and data file preparation
Geochemical samples were collected from stream sediments,with each sample covering an area of approximately 2 km2.The number of collected samples in the study area is 156.The whole sampling period follows from an approximate uniform contribution of samples.Minus 200 mesh samples were sent to be analyzed for 21 elements.These samples were analyzed using the emission-spectrometer method and atomic absorption in the laboratory of Geological Survey and Mineral Exploration of Iran(GSI).Because of the availability of mineralized areas map obtained from regional and local geochemical exploration for the Au element,only this element was used for interpreting in this article.Assay results did not show any censored data,but there was one sample with an out-layer characteristic,and therefore,it was replaced after the correction.
4 Methodology
Different anomaly separation methods,such as probability plot,fractal,and spatial statistic methods,were used to calculate the threshold value.The variations of distribution were illustrated on a diagram or histograms,and the anomalous areas were shown as isograd contour maps.A kriging interpolation technique provided contour maps with a suitable pixel size for raw or estimated data in the methods.These maps estimated the extension of secondary dispersion haloes.Subsequently,the results of different anomaly separation methods were compared based on geological information to determine the accuracy of these methods.
4.1 Interpretation of modeling of probability diagram method
Modeling of probability diagram data,which is a smart method to identify the boundaries of geochemical behavioral changes and prioritize anomalous data obtained from geochemical studies,is one of the drawing techniques for studying the variable behavior and distribution in a population.
These graphs are plotted as usual or logarithmic.In geochemical projects,these plots identify the distribution of the element concentration in the population and introduce subpopulations within the geochemical data(investigating and identifying a population composed of several different subpopulations)(Hazen 1967).
The mixing of the stream sediments in the secondary environment usually led to a uniform media for the concentration in comparison to the primary environment.This process may decrease the concentration and create a mixture of different source rocks and,thereby,the generation of different subpopulations.Modeling of probability diagram,MPD,is a method to deconvolute these subpopulations and calculate the statistical characters of each subpopulation.
Each linear trend of variation on the probability diagram is related to a population with a specific mean and variance that is the result of syngenetic,petrogenesis effects.Therefore,any change in the slope of the fit line or model on the probability diagram reflects different geochemical behaviors in the geological environment.Curve fitting or modeling of the probability diagram is done for identifying and separating these effects from each other,based on the least-square technique.This technique is a statistical procedure to find the best fit for a set of data points by minimizing the sum of the offsets or residuals of points from the plotted curve.In the modeled probability plots of a constant distribution,the fitted statistical models on the data are as follows:

The calculated section is the same as the curve or process of fitted on raw data,which is determined by the data modeling techniques.The random section is the same as the error or deviation of the calculated section(model)from the raw data(observed or measured values).The closer the conformance model is to the observed values,the error rate is equally reduced(Ghavami-Riabi et al.2010).
Different linear trends could interpret as a mixture of different subpopulations,and some of these trends might be related to the transition from one to another subpopulation.In this sub-section,MPD was used to separate the background from the anomaly for the Au element in shear zone gold mineralization.
The MPD of Au,stream sedimentary samples,is illustrated in Fig.2 for the study area data.This plot is created using Prob-plot software whose horizontal axis is the cumulative percent,and the vertical axis is the natural logarithm of concentration.The empty circles in this Fig.2 are related to a different group of raw data.A model,curve line,was fitted on the raw data,and the deviation between model and raw data was minimized based on the least square technique.
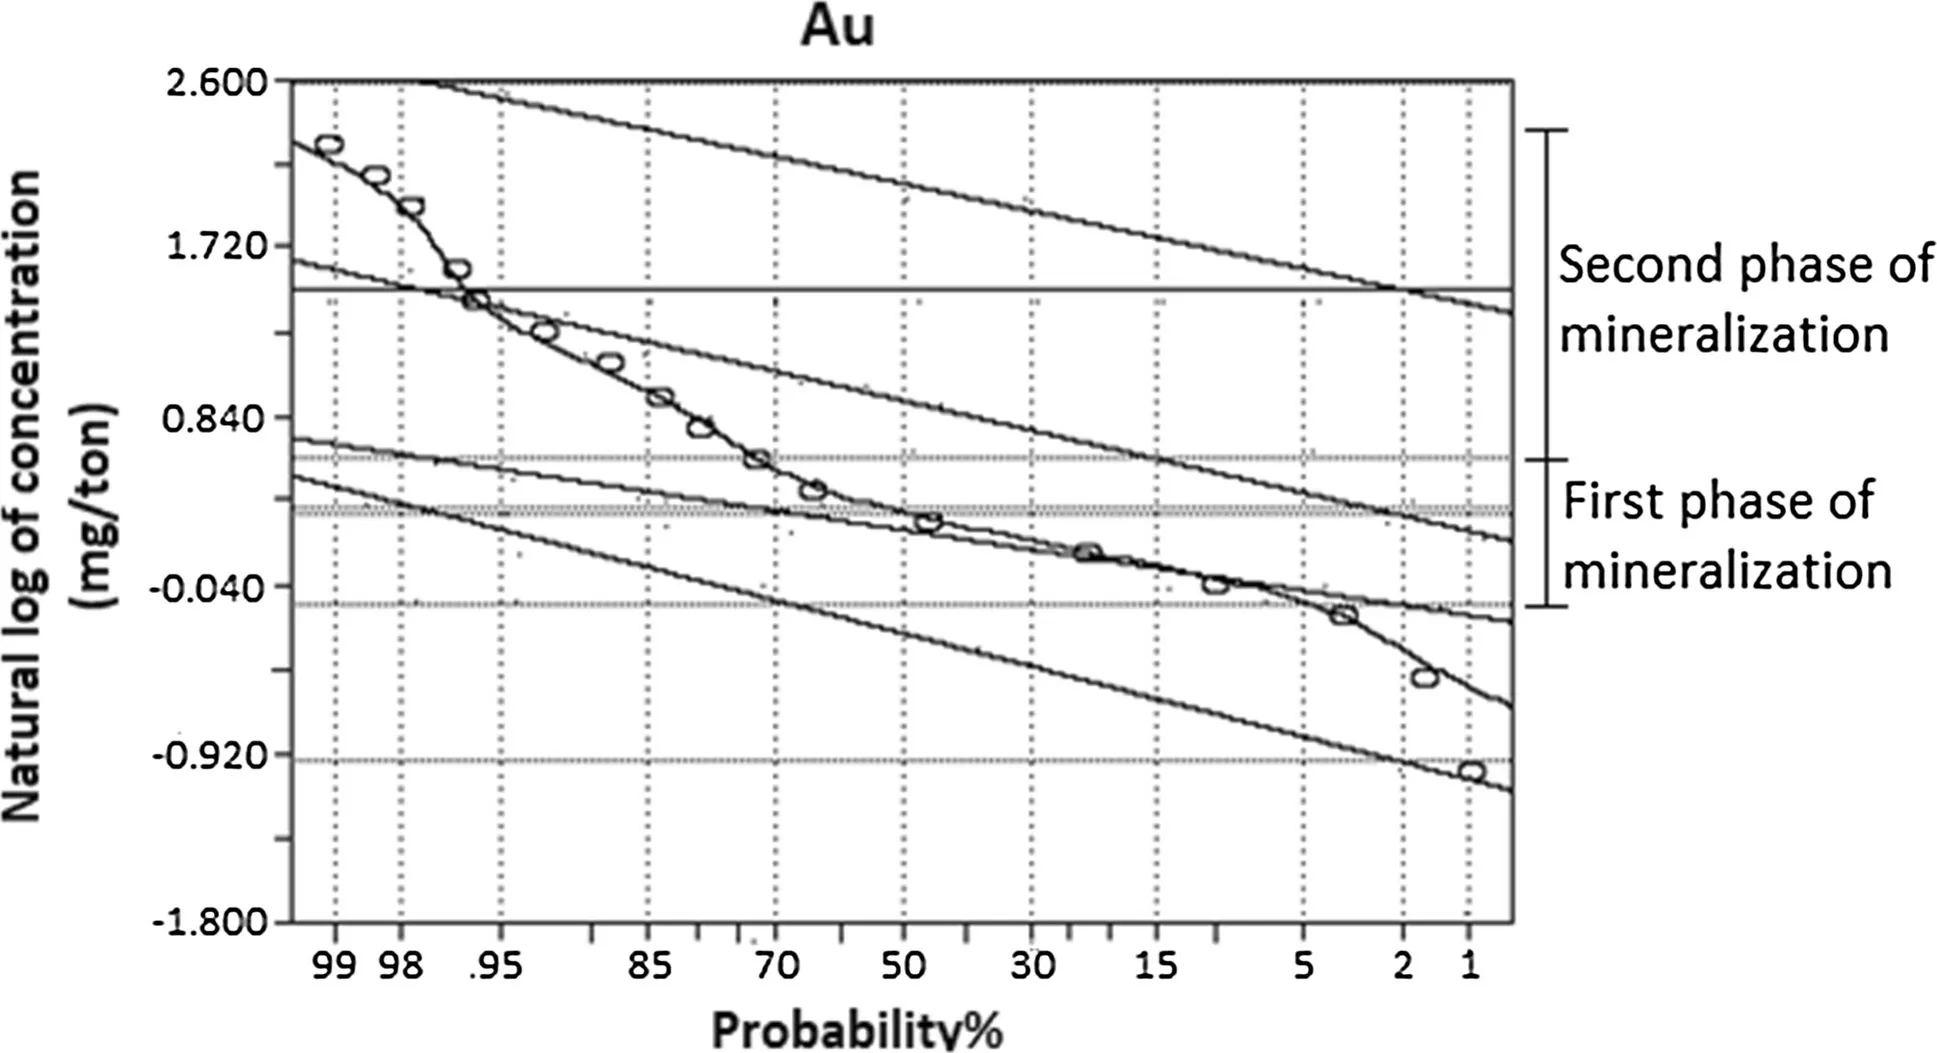
Fig.2 Results of Au probability diagram modeling
There are four different subpopulations in the data.Based on the concentrations,these subpopulations might be interpreted as background,a mixture of background and anomaly,and two anomalous subpopulations.This diagram has shown that two phases of mineralization might have affected the study area.The first phase could increase the Au values up to background concentration.The second phase had a higher intensity and could create a mineralization effect(Fig.2).During this phase,the study area was affected by two different mineralization stages with different intensities.These two stages of mineralization are related to two anomalous subpopulations.
For a better evaluation of these subpopulations,the statistical characteristics of these populations were calculated after the final fitness between raw data and model.In this model,four subpopulations can be identified,and the boundaries of each sub-population and its contribution to total data are calculated.This information consisting of the threshold value and percentage of each subpopulation,is summarized in Table 1.The first subpopulation that includes less than 5% of the data can represent the background;the second consists of 65%,the third contains 28%,and the fourth includes less than 4%of the data.The second subpopulation may reflect transitional limit from the background to the anomaly,the third subpopulation is the anomaly,and the fourth population is the upper limit of the concentrations of the anomalous population or the mineralized zone.
Based on the calculated threshold values,three values were selected as boundaries of anomalous populations,which are 5,15,and 30 ppb Au.The contour map of 15 ppb was drawn(Fig.3),a center of a first anomalous subpopulation,and 30 ppb points to the secondary stage ofmineralization.The location of four shear zone gold mineralization(zones 1,2,3,4,5,and 6)was transferred from Figs.1,2 and 3 to correlate the anomalous areas with mineralization zones in the field.The contour map shows a high correlation between the anomalous areas and six mineralized zones,and a small Au-anomalous area is also identified to the north of the mineralized zone 1.Very low stream sediment Au anomalies discovered relatively small Au-mineralized zones‘‘5 and 6’’in the study area.There is also an Au-anomaly at the eastern edge of the study area that is recommended for further exploration.

Table 1 Calculated results of Au data on probability diagram
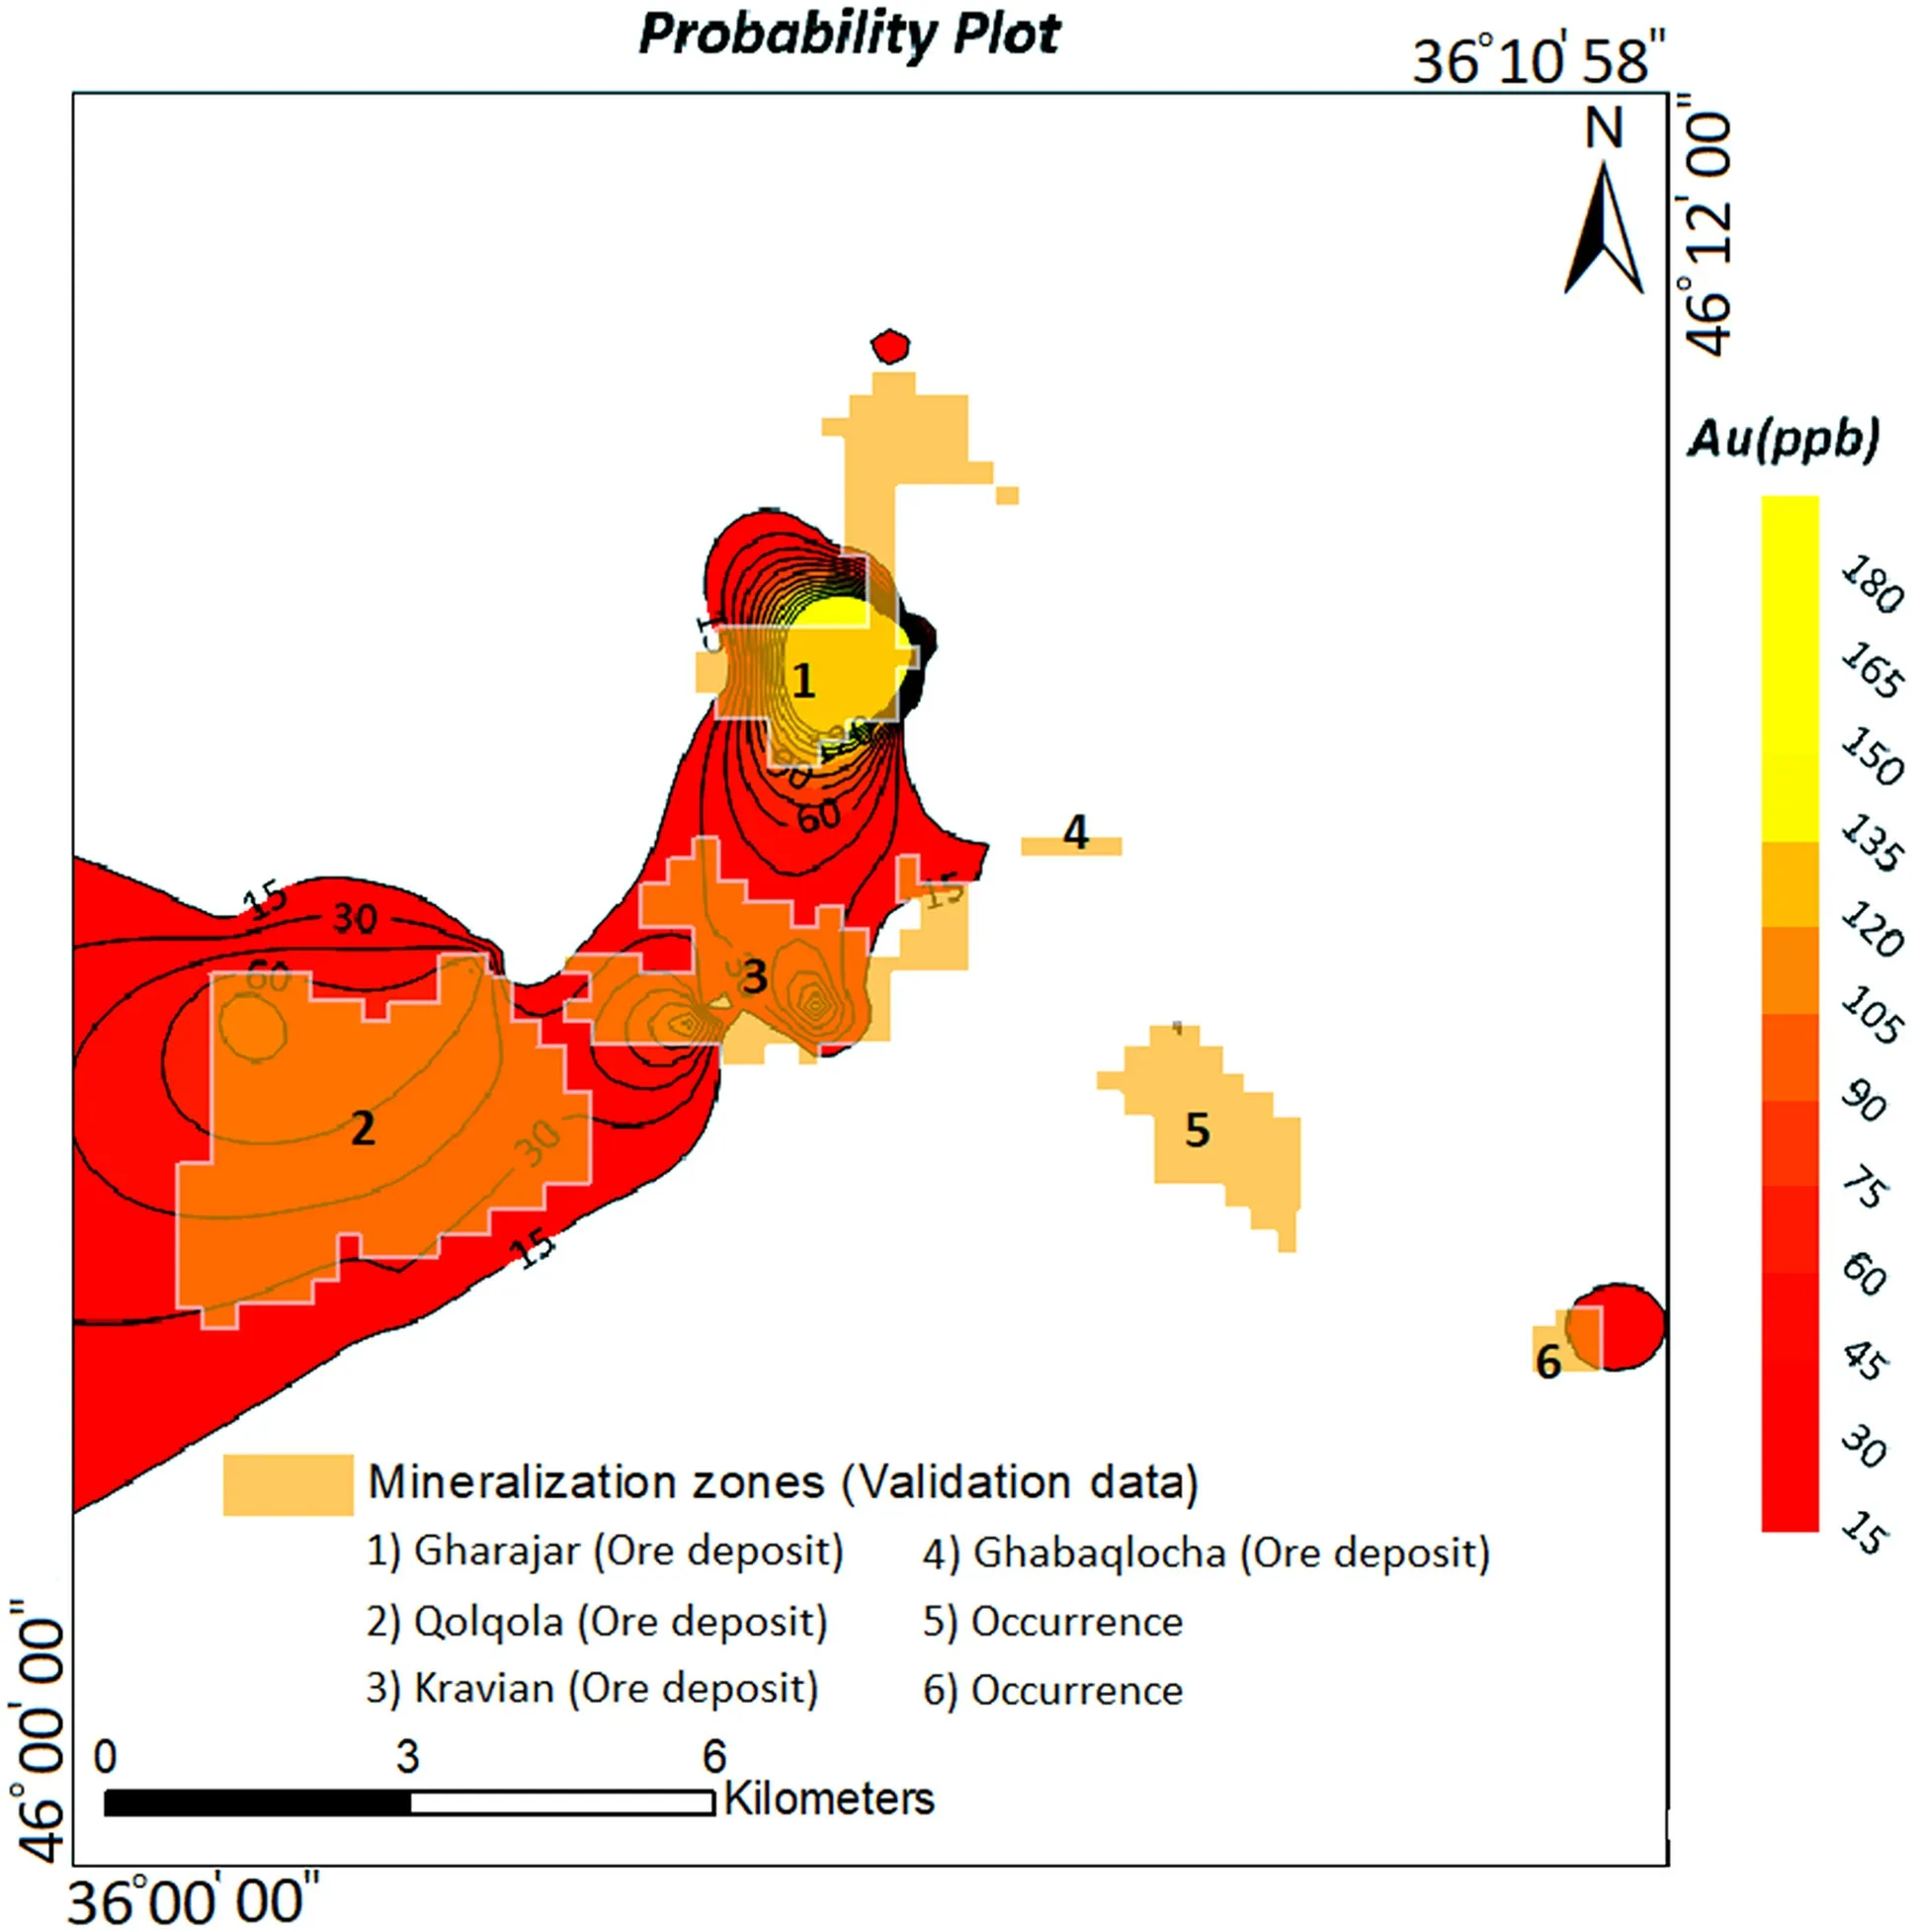
Fig.3 Contour map of anomalous areas(Au)from MPD
An extensive and continuous Au dispersion halo trending NE-SW was recognized by the probability method,which differentiated background from the anomalous areas.Therefore,this method can determine all the gold-mineralized zones in the study area.
4.2 Interpretation of concentration-area fractal method
The basis of this method is to determine the fractal dimension of geochemical patterns.Contour maps provide a smooth model of the spatial distribution of the element.IfA(ρ)the area contains a contour with a concentration value ofρ,then the area decreases with increasing concentration.

The concentration-area model to define anomalies and geochemical background is as follows:whereA(ρ)and D are the area with concentration value higher than a contour with concentration value ofρ,and exponential features,respectively.
A(ρ)can be obtained by counting the cells from the raw concentration of the element.In this method,the grid overlaps with the cells of the study area.TheA(ρ)region for a given area is equal to the number of cells(multiplied by the area of the cell)at concentrations higher than the area.In geochemical exploration,anomalies(concentrations associated with mineralization processes)reflect different power functions relative to the background value.In other words,their fractal dimension will be different,which is used to separate the anomaly from the background(Cheng et al.1994).
The existence of geochemical anomaly values increases the fractal dimension of the geochemical variable.The difference between the fractal dimension of background and anomalous values led to the identification of threshold values in separating anomalous areas from the background.In this paper,the area versus concentration fractal method was used for the calculation of the threshold values.
The high distance between the stream sediments led to the interpolation of the concentration between the samples.In other words,the stream sediment samples cannot give any information for their downstream,so they cannot participate in the estimation of unknown points along downstream.For this reason,a grid net of 100×100 m2was used for estimating the concentrations.Three weights were calculated based on the square of the inverse distance between the samples,the total area sector(Fig.4a),and the smallest cell area(100×100 m2).The average of these weights referred to the cell,with a 100×100 m2area,and a new estimation for the concentration was done for the appropriate cell.The three weights for sample i was calculated using the following relationships:where diis the distance of sample i from the estimated cell,aiis the area of the sector corresponding to the sample i within the estimated cell,and Aiis the total sector area(catchment)of sample i.
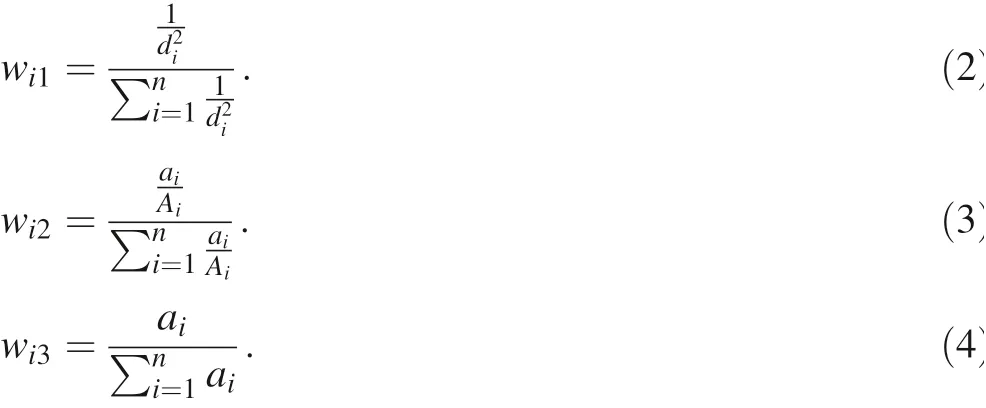
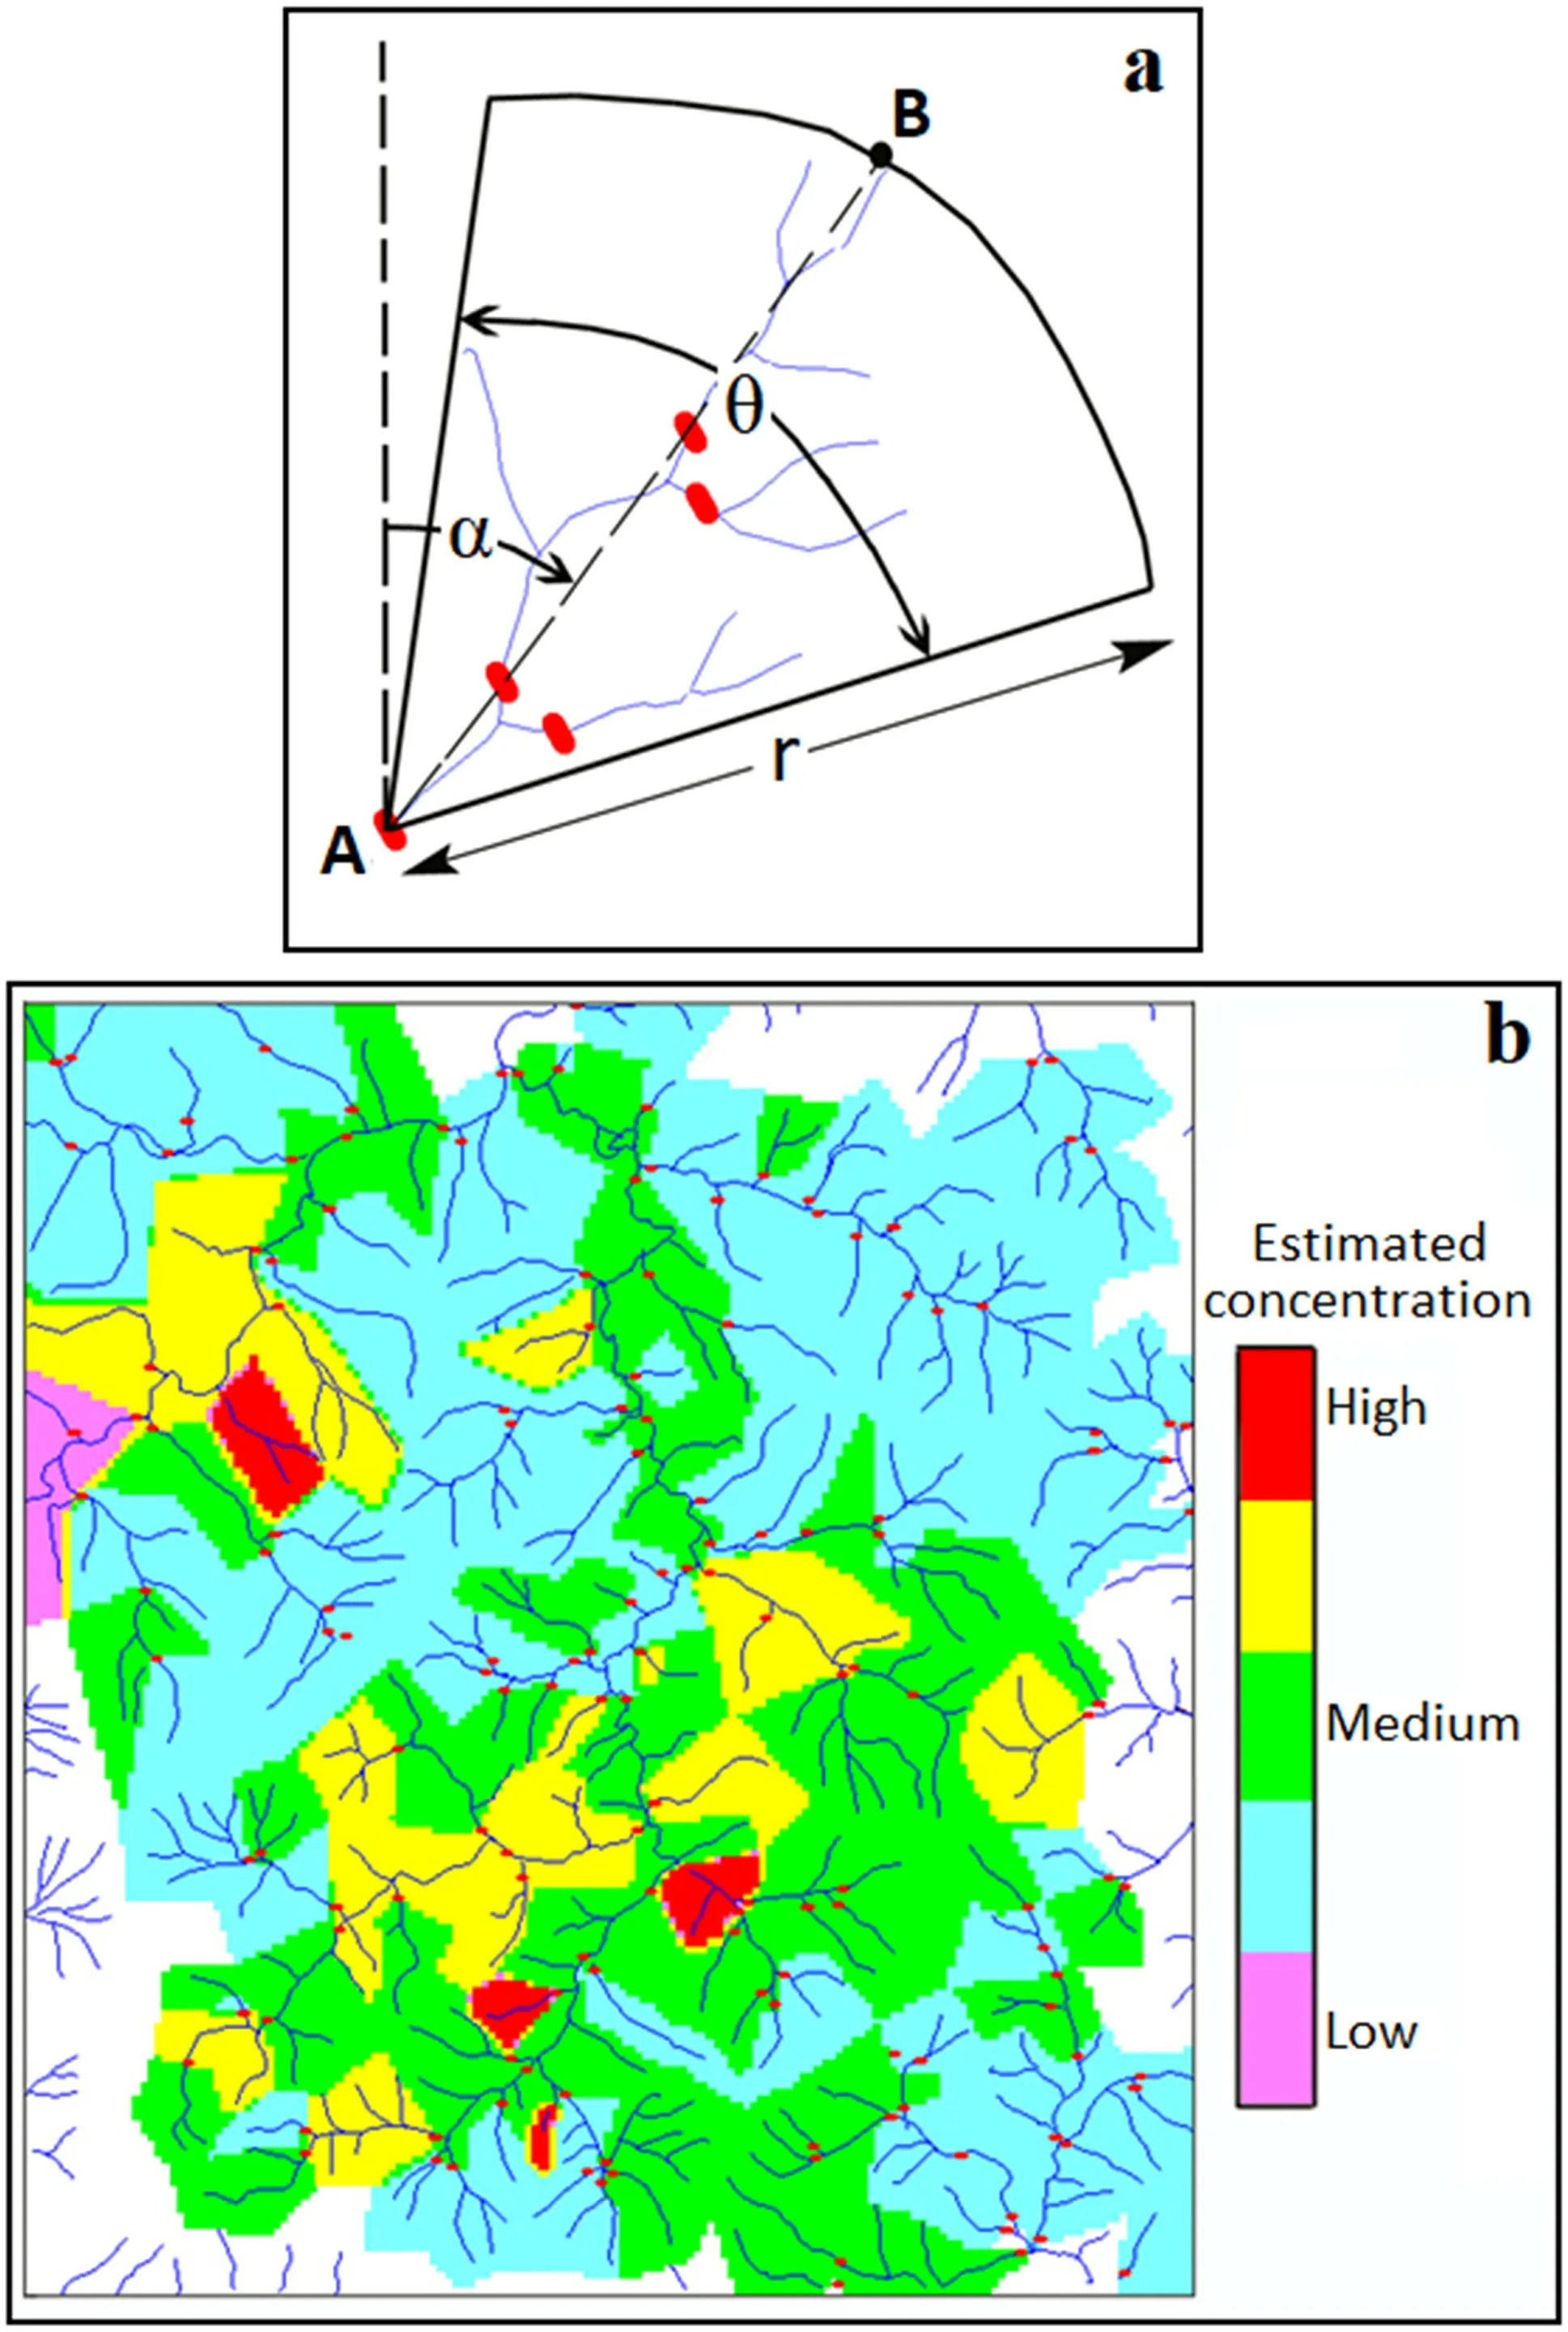
Fig.4 a Sector geometric characteristics of a catchment area and sample collection sites along with specifications required for calculations.b The resulting map of a network estimate based on stream sediments samples of the Southwest region of Saqqez for Au Element
wi1reflects the distance between the sample position(central angle of sector orθ)and the center of the estimated network cell.In this case,the inverse distance squared is used as the weight.For example,if the length of the stream is doubled,its catchment area becomes almost quadruple.For this reason,materials from point erosion in the distance 2D of the sampling point will be four times more dilute than materials from point erosion in the distance D of the site.
wi2reflects the ratio of the area’s portion of a sector located within a particular cell to the total area of the sector.For example,if a sector with an area of 80 units cuts two grid cells at a ratio of 10 and 70 units of area,then the weight of each will ber espectively.The sum of the partial areas for each sector will be the one.
wi3reflects the ratio of the area contribution of a particular sector to the sum of the areas of the various sectors occupying a particular network cell with different cell areas.For example,if the three different sectors intersect a given cell such that the first sector covers 100%of the cell and the second sector contains 50%,and the third sector occupies 10%of the cell,the share of the area of each total sector is equal tothe partial areas for each grid cell will not be equal to one.respectively.The sum of
Figure 4b shows the resulting map of a network estimate based on stream sediment samples of the study area for the Au element.This Fig.4 was provided by AutoCAD software.
The final weight of sample i is an average of the three previous weights:

The statistical analysis of the estimation results was the next step.The estimated concentration was grouped,and the total area for each range of concentration was calculated in this step.The variation of area versus concentration was drawn in a logarithmic scale to investigate the threshold in Fig.5.For drawing this graph,the number of concentrations included cells were counted in each category,then the average of the concentration of cells was assigned to each category.Here,for calculating the total area of the cells,the area of each cell(in this study,10000 m2)is multiplied by the number of cells.In the graph,the logarithm of the area of cells versus the logarithm of concentrations is plotted.
The different linear trend could be interpreted as several fractal dimension or multi-population.In Fig.5,the linear trend with a lower slope that includes the lower range of concentration illustrates the background subpopulation,and the linear trend with a higher slope,which including a high range of concentrations,determines the anomalous subpopulation.The later subpopulation is included a smaller area in comparison to the former subpopulation,which is a geochemical characteristic of the anomaly area.
The intersection points of these two trends,112 ppb Au,equals to the threshold value.Figure 6 illustrates the contour map of the threshold value.This method identifies the two mineralized areas 1 and 3,namely Gharajar and Kervian deposits,respectively.
Based on the comparison of Fig.3 with Fig.6,the secondary dispersion holes and anomaly areas determined by the fractal method are less.
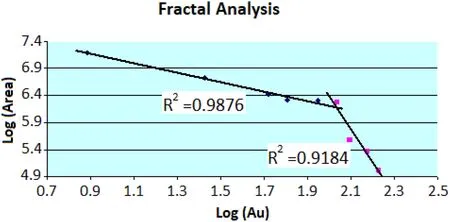
Fig.5 Modeling of Au concentration-area plot
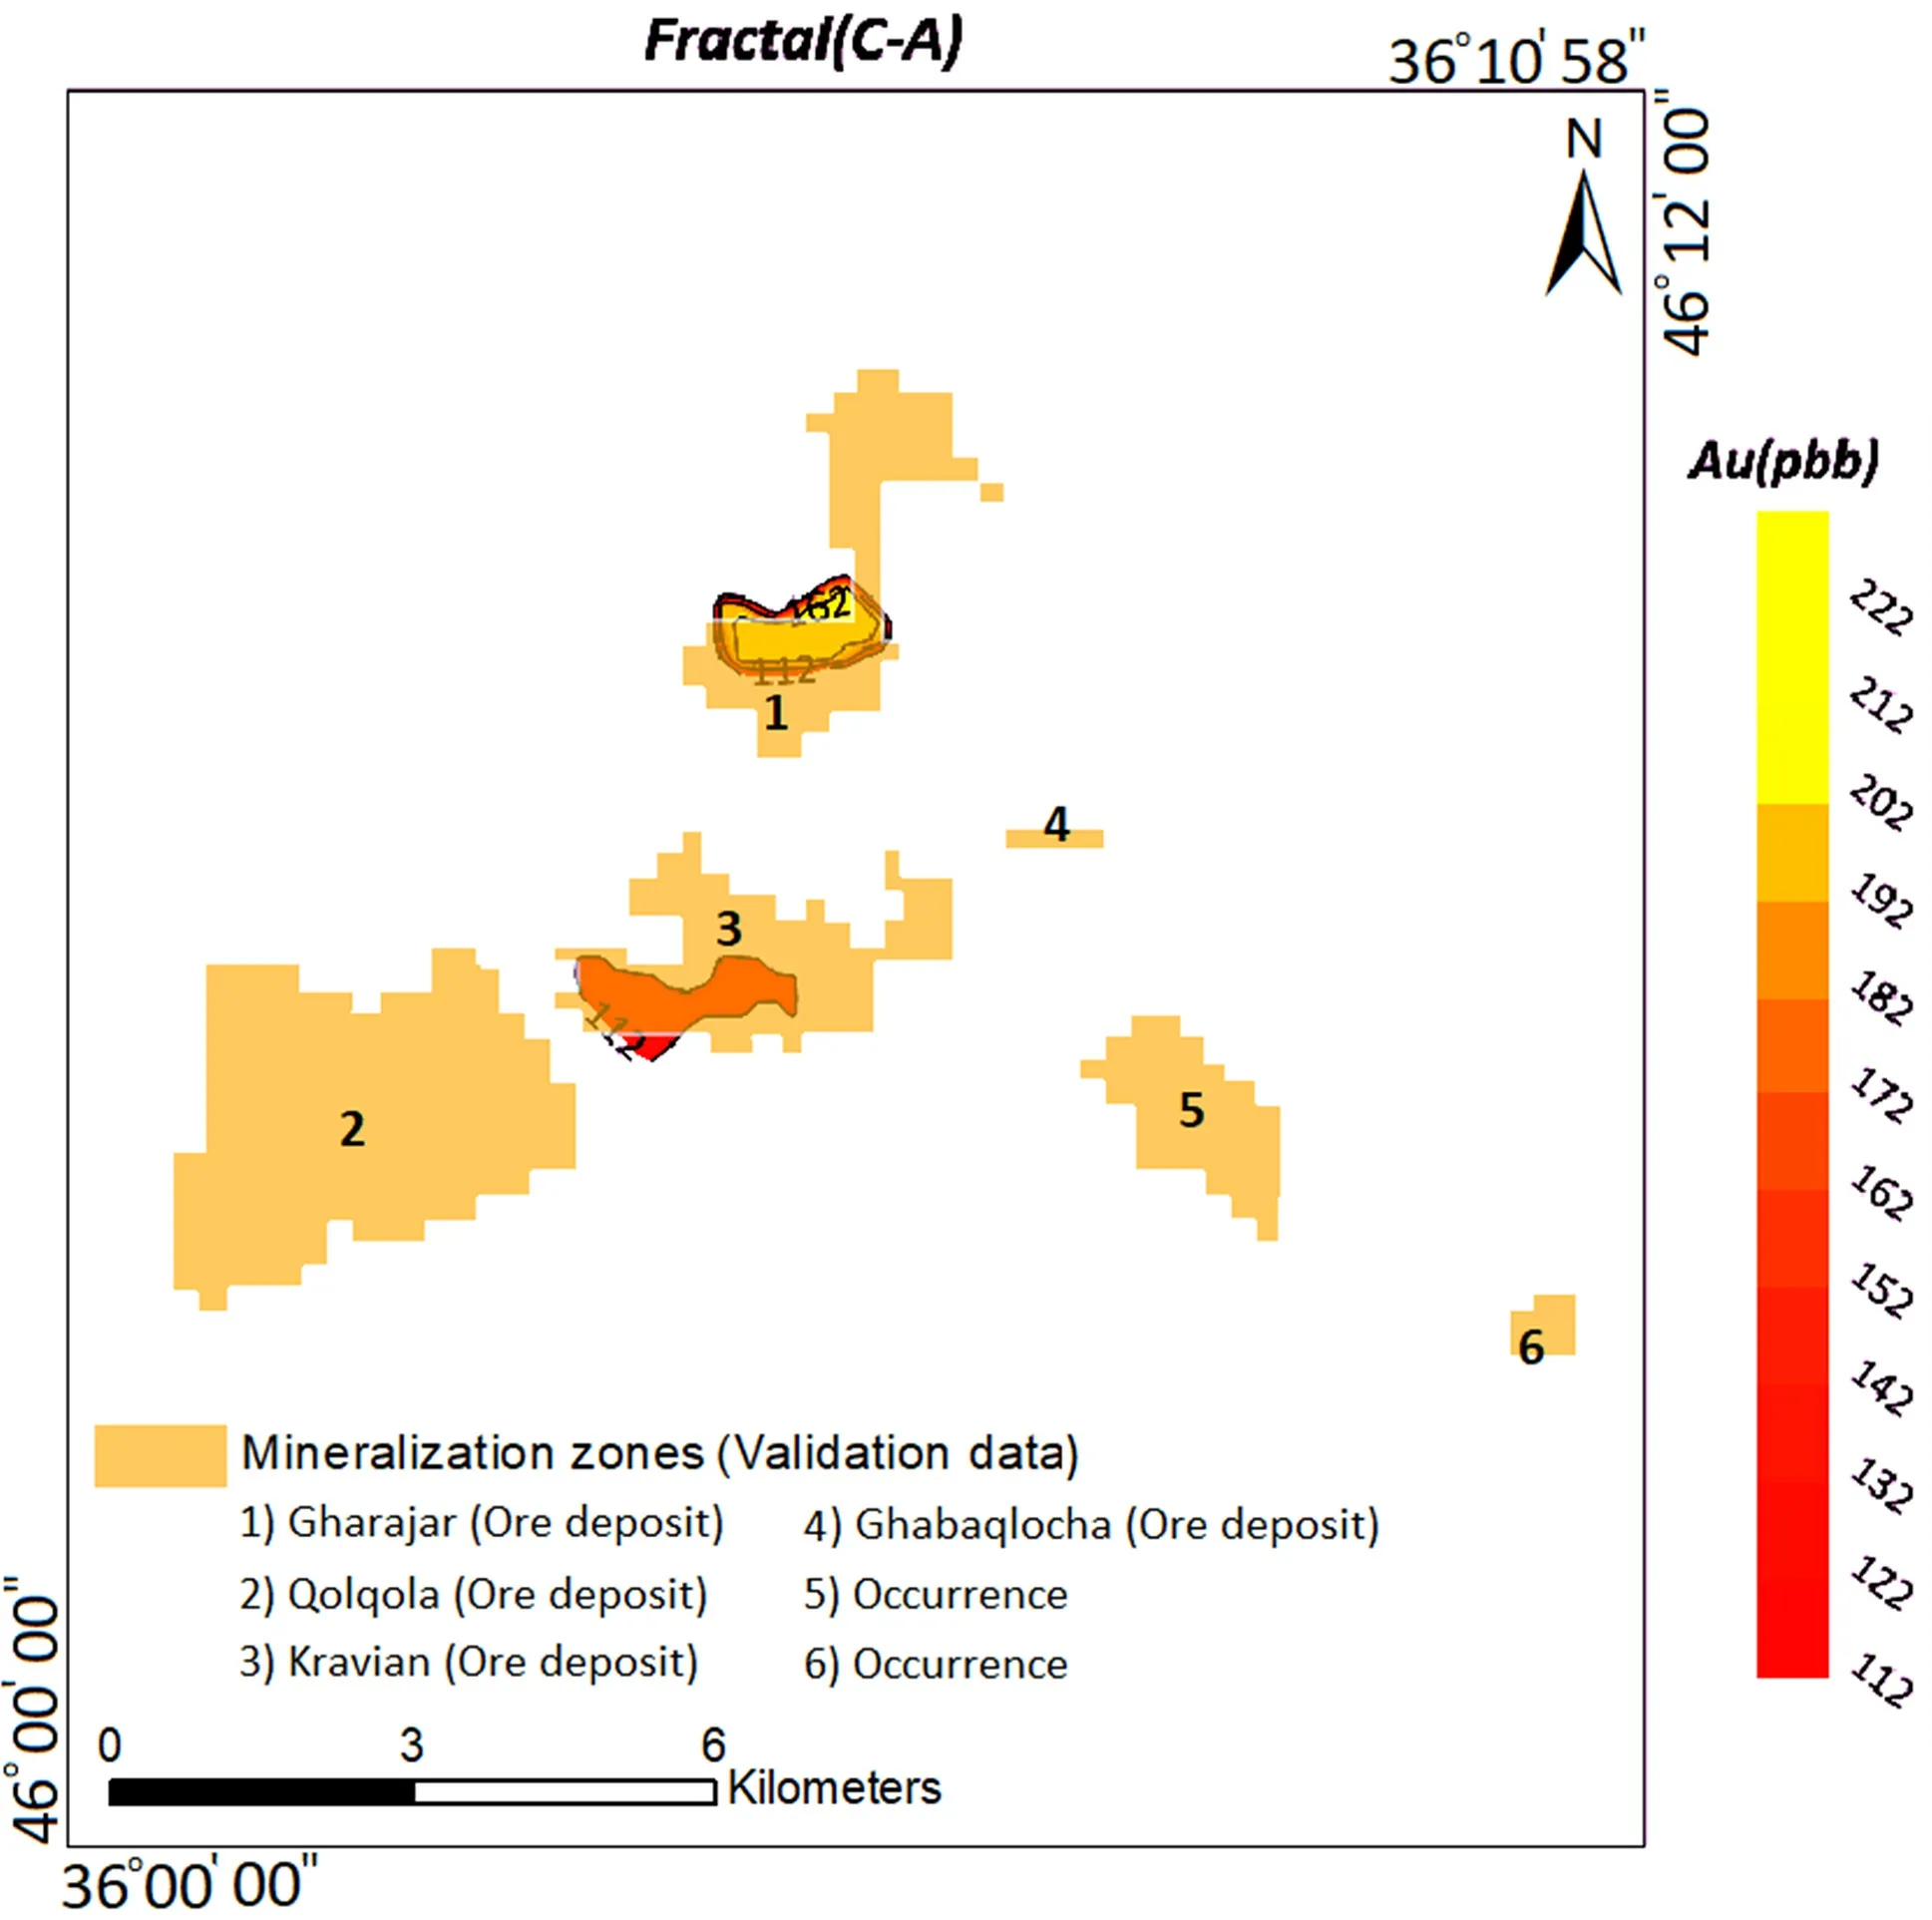
Fig.6 Contour map of Au anomaly areas using C–A method
4.3 Interpretation of U-spatial statistics method
The U-spatial statistics method is a kind of moving average method,with the feature of changing the dimensions of the window within which the averaging is performed at each particular point.Therefore,for each point,several values of the U statistics are calculated from the surrounding points.Thus,the spatial relationship of the points in this method is considered.
For calculating the U-value for each sampling point,a circle with a radius of 0 to 5000 m(r-max)is considered with 10 meters radius changes.The value of the U statistic at a point i is defined as follows:

whereμis the mean,andσis the standard deviation of the total data.The value of Ui(r)is a function of r,and changing the r values different Ui(r)values are to be obtained.For each r-value,several surrounding samples participate in calculating the U value of that unknown point.In fact,at any point,the amount of Uifor each radius of search r is an average of the samples n1from the anomaly population and n2for the background population.So,it can be written(Cheng 1999):

IfμAis the average of the anomalous population andμBis the mean of the population of the background,then it will confirm theμA<μ<μB.When the samples around sample i are all from a population(anomaly or background),the absolute magnitude U increases with increasing search radius,but for the case where all the samples around the population are anomalous,this is positive and,in the opposite,will be negative.This value increases until the neighborhood limit enters from one population,such as an anomaly(or background),to another background population(or anomaly).In this case,the first sentence of the above expression is positive and large,and the second sentence will be a negative amount with large absolute value,whose algebraic sum will be small and close to zero.Therefore,the optimal value of r,causing the greatest separation between the two populations of the anomaly and the background is the value in which U is the maximum value for it(Cheng 1999):

Cheng et al.(1994)proposed a computer program,which was written in the Matlab environment for the calculation of U value.The highest|U|value(U*)was a criterion to optimize the circle radius and access to the highest separation of the anomaly from the background area.The calculation algorithm of U*is shown in Fig.7 for 156 samples.
The histogram of the selected U values(Fig.8)was illustrated for 156 samples.The zero U value in this histogram is a boundary which is separated the background,U<0,from anomalous areas,U>0.
For calculating the threshold value,the values of¯U+SD,and¯U+2·SD(Where SD is the standard deviation)were used as a minimum of anomaly values,and the contour maps were drawn(Figs.9 and 10).The mineralized zones 1,2,and 3 were identified by U>3 ppb(Fig.9).The anomaly intensity of the blind ore deposit of Kervian(about 150–200 m below the surface)and mineralized zone 3 was lower as compared to mineralized zone 1.Therefore,the probability of mineralization of the blind ore deposit for mineralized zone 1 is higher.A narrow anomalous area for the center of mineralized zones 1,2,and 3 was separated by using¯U+2SDcriteria(Fig.10).
The spatial analysis of U could separate the three mineralized zones,including the blind ore deposit Kervian,out of six.The northern parts of 1 and 4,5,and 6 mineralized zones were not determined based on this method.
5 Discussion
5.1 Efficiency analysis
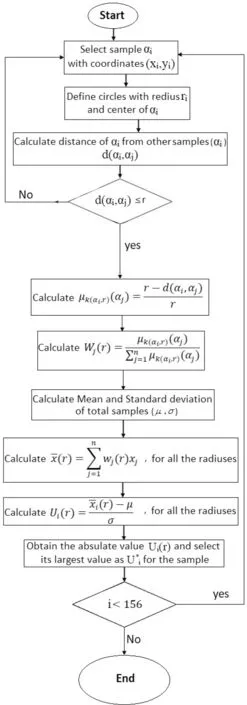
Fig.7 Algorithm of U-spatial statistics Method for calculating U*Values of the samples
Interpreting diagrams and histograms for the calculation of threshold value is one of the items that give some information about the geological and mineralization events in the study area.This item was used for analyzing the efficiency of the methods in identifying phases of mineralization.MPD(Fig.2)identified two phases of mineralization after the deconvolution of the background from the anomaly.The fractal method(Fig.5)could separate only one phase of change based on the fractal dimension.This method could separate very high concentration areas of the Au element.The spatial analysis(Fig.8)showed two mixed subpopulations after U=0 and another subpopulation with very high U values.Therefore,the spatial analysis illustrated more detail of the events and variations,which was confirmed by the other exploration information from the study area.The MPD is the following method after spatial analysis that shows the detail of the variations.
5.2 Accuracy analysis
The identification of mineralized zones and ore deposits could be used as an essential parameter to evaluate the accuracy of geochemical anomaly separation methods.The raw data were directly used to calculate the threshold value by MPD.The first step in the fractal method is an extrapolation of the concentration for a specific grid net,which is taking some time.Using the estimation extrapolation data instead of real data,and calculation of the appropriate weights for the estimation is the second step in the fractal method.In the spatial analysis method,the U value estimated based on the window defined for each sample and the concentration of the samples inside the window.Between these methods,MPD is the simplest method with the minimum calculation and no estimation for the concentration values.It is noteworthy that in all these methods,a displacement(approximately 100–300 m)may be seen at the fitted anomaly maps with the mineralized area.This problem may probably be stemmed from the secondary lithogeochemical environment.
5.3 Verification
In this research,six mineralized zones were used for the validation of methods in the shear zone gold mineralization.According to geochemical exploration results,four zones from these six ore zones are the ore deposits now(zones 1,2,3,and 4 in Fig.1),and two zones have occurrences that need further exploration(zones 5,6).Identification of the geochemical dispersion haloes,the number,width,and intensity of haloes around the mineralized zones are some other criteria for the assessment of the method accuracy.It should also be emphasized that the depth and the size of the blind ore deposit may affect the width and intensity of the haloes at the surface.
The spatial analysis could identify 60% of the mineralized zones based on the comparison of the ore deposit and mineralized zones with anomalous areas.Only 40%of the mineralized zones and ore deposits may be discriminated using the concentration-area fractal method.Finally,MPD could detect approximately more than 90%of the ore deposits and mineralization zones in the study area.The latest method showed a broader and more continuous dispersion halo as compare to the other methods.Furthermore,six mineralized zones,an anomaly with low intensity on the southeast of the study area,were identified by the MPD method.By carrying out a detailed exploration in that area,the capability of this method in geochemical exploration for Au can be further determined.
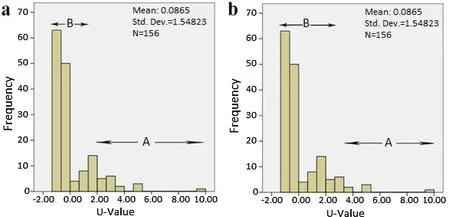
Fig.8 Histogram of U-value for Au,A Anomaly population,B:Background population(a

Fig.9 Contour map of Au-anomaly areas from U+SD method
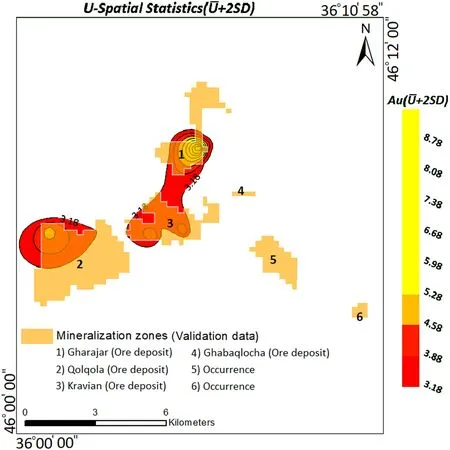
Fig.10 Contour map of Au anomaly areas from U+2SD method
6 Conclusions
The main findings of this study are as follows:
1.The U-spatial statistics method showed more detail of the events and variations with two mixed subpopulations and another subpopulation with very high U values.MPD identified two phases of mineralization after the deconvolution of the background from the anomaly.This method is the following method after spatial analysis that shows the detail of the variations.The fractal method could separate only one phase of change based on the fractal dimension.This method could separate very high concentration areas of the Au element.
2.A displacement of about 100 until 300 m can be seen at the fitted anomaly maps with the mineralized area.This problem may probably be stemmed from the secondary lithogeochemical environment.
3.Sixmineralizedzonesdetectedfromlocalgeochemicalexplorationresultswereusedforvalidating the methods mentioned above.The MPD method was able to identify anomaly areas higher than 90%.The spatial analysis and concentration-area fractal methods could identify 60 and 40%of the mineralized zones based on the comparison of the ore deposit and mineralized zones with anomalous areas,respectively.
4.MPD is recommended as the best,and the spatial U-analysis is the following method for anomaly detection.It is estimated that the fractal method could show more detail of the events and variations in the area with a symmetrical grid net and a higher density of sampling or a detail exploration stage.
AcknowledgementsWe would like to thank the Geological Society of Iran,especially the department of the gold project,for access to the analytical results.We also thank Dr.Hezareh and Dr.Ghazanfari,for their invaluable supports.
杂志排行
Acta Geochimica的其它文章
- Early Silurian Wuchuan-Sihui-Shaoguan exhalative sedimentary pyrite belt,South China:constraints from zircon dating for K-bentonite of the giant Dajiangping deposit
- Niobium-tantalum oxide minerals in alluvial placer deposits from the Ngoura area,East-Cameroon
- Development of a 100 MPa water-gas two-phase fluid pressurization device
- Helium and argon isotope geochemistry of the Tibetan Qulong porphyry Cu-Mo deposit,China
- Translocation and distribution of mercury in biomasses from subtropical forest ecosystems:evidence from stable mercury isotopes
- Neoproterozoic highly fractionated I-type granitoids of Shillong Plateau,Meghalaya,Northeast India:geochemical constraints on their petrogenesis
