Single-cell Long Non-coding RNA Landscape of T Cells in Human Cancer Immunity
2021-02-24HaitaoLuoDechaoBuLijuanShaoYangLiLiangSunCeWangJingWangWeiYangXiaofeiYangJunDong3YiZhaoFurongLi
Haitao Luo, Dechao Bu, Lijuan Shao, Yang Li, Liang Sun, Ce Wang,Jing Wang,3, Wei Yang, Xiaofei Yang, Jun Dong3,, Yi Zhao,, Furong Li,
1Translational Medicine Collaborative Innovation Center, The Second Clinical Medical College (Shenzhen People’s Hospital), Jinan University, Shenzhen 518020, China
2Shenzhen Key Laboratory of Stem Cell Research and Clinical Transformation, Shenzhen 518020, China
3Integrated Chinese and Western Medicine Postdoctoral Research Station, Jinan University, Guangzhou 510632, China
4Bioinformatics Research Group,Key Laboratory of Intelligent Information Processing,Advanced Computing Research Center,Institute of Computing Technology, Chinese Academy of Sciences, Beijing 100190, China
5Department of Gastrointestinal Surgery,The Second Clinical Medical College(Shenzhen People’s Hospital),Jinan University,Shenzhen 518020, China
Abstract The development of new biomarkers or therapeutic targets for cancer immunotherapies requires deep understanding of T cells.To date,the complete landscape and systematic characterization of long noncoding RNAs(lncRNAs)in T cells in cancer immunity are lacking. Here, by systematically analyzing full-length single-cell RNA sequencing(scRNA-seq)data of more than 20,000 libraries of T cells across three cancer types,we provided the first comprehensive catalog and the functional repertoires of lncRNAs in human T cells.Specifically,we developed a custom pipeline for de novo transcriptome assembly and obtained a novel lncRNA catalog containing 9433 genes.This increased the number of current human lncRNA catalog by 16%and nearly doubled the number of lncRNAs expressed in T cells.We found that a portion of expressed genes in single T cells were lncRNAs which had been overlooked by the majority of previous studies.Based on metacell maps constructed by the MetaCell algorithm that partitions scRNA-seq datasets into disjointed and homogenous groups of cells(metacells),154 signature lncRNA genes were identified.They were associated with effector,exhausted, and regulatory T cell states. Moreover, 84 of them were functionally annotated based on the co-expression networks,indicating that lncRNAs might broadly participate in the regulation of T cell functions.Our findings provide a new point of view and resource for investigating the mechanisms of T cell regulation in cancer immunity as well as for novel cancer-immune biomarker development and cancer immunotherapies.
KEYWORDS Long non-coding RNA;Transcriptome assembly;Metacell;Immune regulation;Functional annotation
Introduction
T cell checkpoint inhibition therapies, such as targeting exhausted CD8+T cells and regulatory T cells(Tregs),have shown remarkable clinical benefit in many cancers [1–3].Nevertheless,the mechanisms underlying therapy response or resistance are largely unknown,which leads to different therapeutic efficacies among cancer patients [4–8]. To better understand the mechanisms that underlie successful response to immunotherapy,more comprehensive studies to explore the whole transcriptome of individual T cells in tumor ecosystems are desired. Long non-coding RNAs(lncRNAs), defined as a class of non-coding RNAs longer than 200 nt with no or low protein-coding potential, comprise a large proportion of the mammalian transcriptome[9–12]. Accumulating evidence has suggested that lncRNAs are widely expressed in immune cells and play crucial roles in cancer immunity by regulating the differentiation and function of T cells[13–17].For example,overexpression ofNKILA, an NF-κB-interacting lncRNA, correlates with T cell apoptosis and shorter patient survival [18], and an enhancer-like lncRNANeSTregulates expression ofIFN-γand induces its synthesis in CD8+T cells [19]. However,previous studies seem to be somewhat scattered, and the landscape and comprehensive functional analysis of lncRNAs in T cells in cancer immunity are still lacking.
The dramatic advances of single-cell RNA sequencing(scRNA-seq) technologies have gained unprecedented insight into the high diversity in T cell types and states compared to bulk RNA sequencing (RNA-seq) methods,which do not address the complex structures of the tumor microenvironment [20–25]. Despite the advantages of the single-cell resolution,currently,most scRNA-seq studies of cancer immunology have generally focused on coding genes,overlooking the large amounts of lncRNAs.Detailed understanding of lncRNAs at the single-cell level is challenging owing to their relatively low and cell-specific expression [26–28]. As a widely used scRNA-seq approach,3′-end sequencing technologies such as droplet-based 10×Genomics have lower RNA capture efficiencies,leading to dropout events and technological noise for lowly expressed lncRNAs[29].Furthermore,accurate identification of novel lncRNAs is not suitable for the 3′-end sequencing technologies,but such analysis could be achieved by using fulllength scRNA-seq technologies such as SMART-seq2[30].In addition, the sampling noise in scRNA-seq is generated through the sampling of limited RNA transcripts from each cell [31], leading to a highly noisy estimation for most lncRNAs.Therefore,to effectively characterize the lncRNA landscape at the single-cell level,attention should be paid to choosing the appropriate scRNA-seq data and analytical approaches.
Here, using unprecedentedly large-scale full-length single-cell transcriptome data of more than 20,000 T cells from various tissues across three cancer types,we created a full annotation of the T cell lncRNA transcriptome and analyzed the functional roles associated with different Tcell states. Our study aimed to provide a basic and valuable resource for the future exploration of lncRNA regulatory mechanisms in T cells,which may facilitate novel cancer-immune biomarker development.
Results
De novo transcriptome assembly of lncRNAs from scRNA-seq data of T cells
To investigate the landscape of human lncRNAs in T cells across different tissues, patients, and cancer types, we collected the data of 24,068 T cells (the size of the gzipcompressed FASTQ file was 7.5 TB) generated by fulllength scRNA-seq with SMART-seq2. This included the raw data of 9878 cells from 12 colorectal cancer (CRC)patients(2.8 TB),10,188 cells from 14 non-small-cell lung cancer (NSCLC) patients (3.1 TB), and 4002 cells from 5 hepatocellular carcinoma(HCC)patients(1.6 TB)[32–34](Figure S1A; Table S1). These cells were collected from peripheral blood, adjacent normal tissue, and tumor tissue from each patient and sorted into CD3+CD8+(CD8) and CD3+CD4+(CD4) T cells. The reads of each cell were mapped to the human reference genome (hg38/GRCh38),and the cells with unique mapping rates of less than 20%were removed. The remaining cells with on average 1.04 million uniquely mapped read pairs(0.63 million splices on average)and at least one pair of T cell receptor(TCR)α and β chains enabled us to detect the expressed lncRNAs(Figure S1B−D).
Next,to generate the comprehensive T cell transcriptome beyond the current reference annotation, we performedde novotranscriptome assembly using the StringTie method[35]. Although StringTie could be run by providing the reference annotation to guide the transcript construction,in the current study, we focused on to what extent it could assemble the whole transcriptome without the prior annotation.Based on the T cell dataset from HCC patients,we first measured the extent of assembly in each T cell and found that an average of 4752 transcripts could be assembled at the single-cell level.An average of 69.8%(3318/4752)of those was matched to reference models (including reference protein-coding genes from GENCODE v31 and reference lncRNA genes from RefLnc database)(Figure 1A).
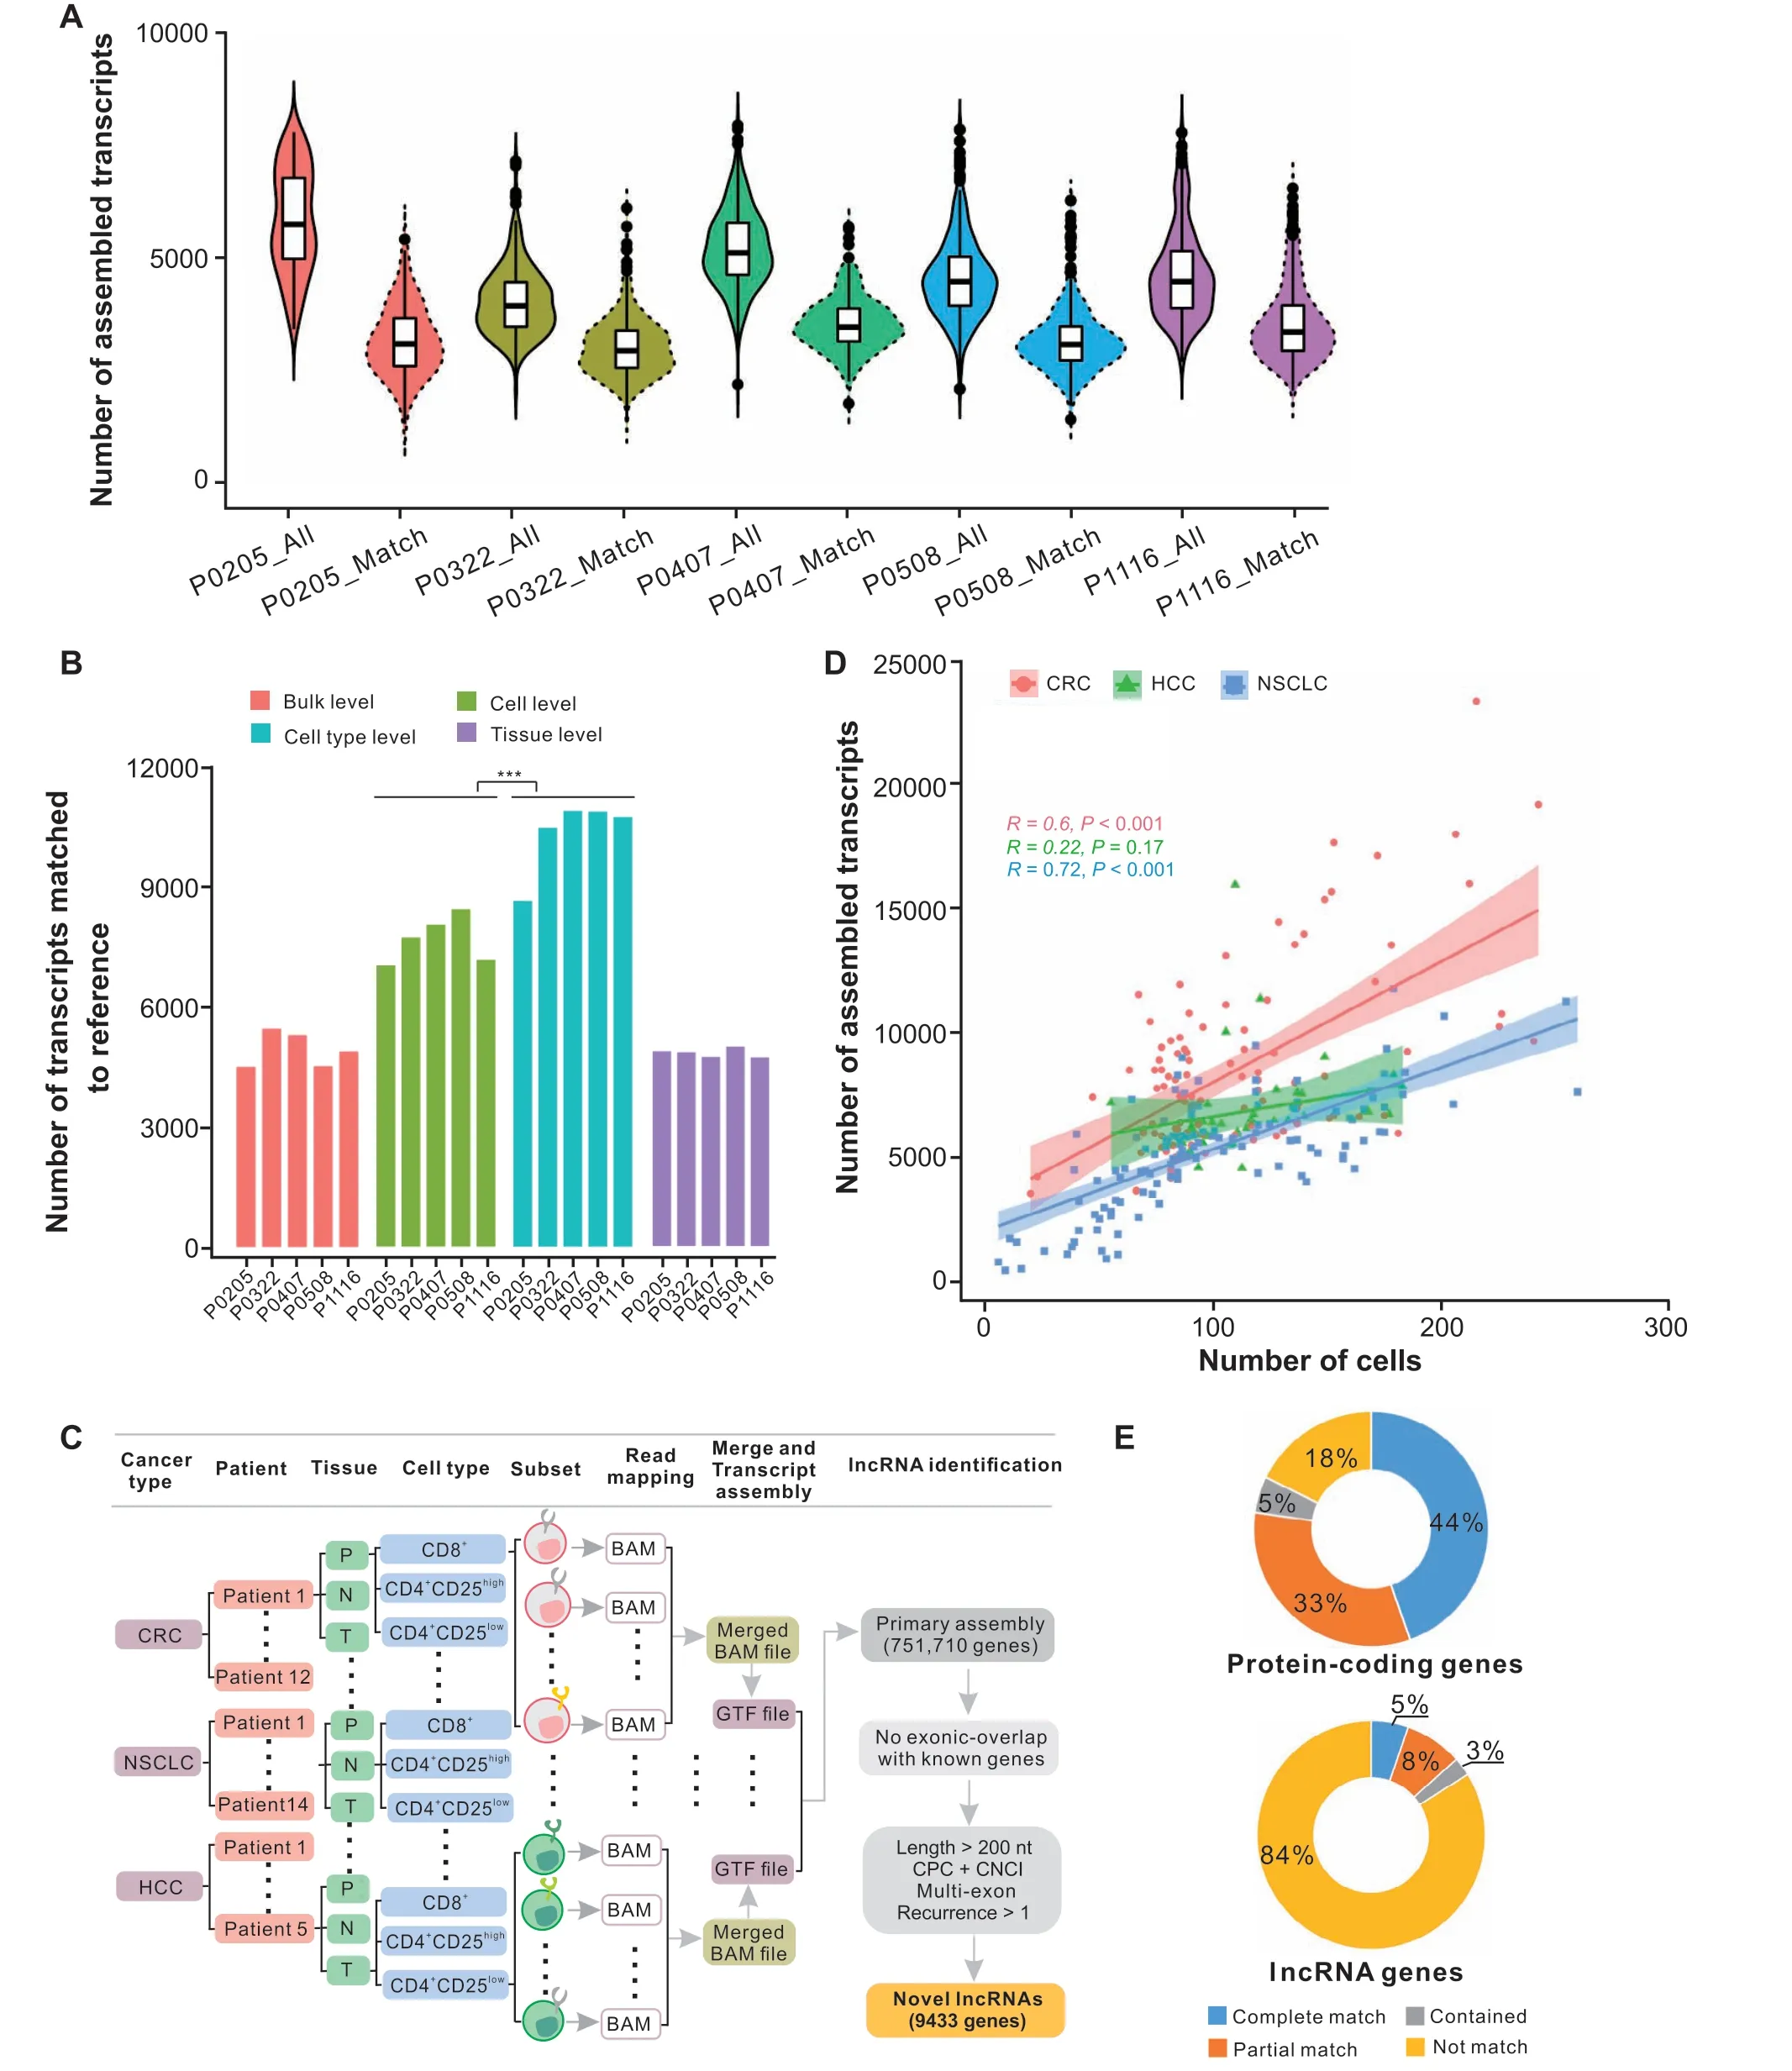
Figure 1 Statistical analysis of assembled transcripts and workflow for novel lncRNA identification process in T cells during cancer immunityA.Violin plots showing the number of assembled transcripts(All)and the number of those matched to the reference(Match)at single-cell level across five HCC patients(P0205,P0322,P0407,P0508,and P1116).B.Number of assembled transcripts matched to reference across five HCC patients based on four different strategies.***,P<0.001(Wilcoxon rank-sum test).C.Scheme of the pipeline used to identify novel lncRNAs expressed in T cells during cancer immunity using three full-length scRNA-seq datasets. D. Correlation of the number of cells and the number of assembled transcripts across different subsets for CRC, HCC, and NSCLC. 95% confidence intervals were added and shown as colored shades. E. The statistics of assembled transcripts that matched to reference protein-coding genes and reference lncRNA genes.CRC,colorectal cancer;HCC,hepatocellular carcinoma;NSCLC,non-small-cell lung cancer; P, peripheral blood; N, adjacent normal tissue; T, tumor tissue; CPC, Coding Potential Calculator; CNCI, Coding-Non-Coding Index.
To explore the best way to obtain novel transcripts, we compared the assembly results using three different approaches based on the HCC dataset: 1) map and assemble transcripts for every single cell individually (cell-level);2)assemble transcripts based on merged mapping results from each cell type of each patient(cell type-level);3)assemble transcripts based on merged mapping results from each tissue of each patient (tissue-level). The transcripts assembled from each approach were merged independently and compared with reference genes respectively (Figure S1E). We found that the number of assembled transcripts matched to reference genes based on the cell type-level strategy (average 105,527 transcripts) was significantly higher than those based on the cell-level and tissue-level methods (average 77,860 and 49,689 transcripts, respectively;P< 0.001, Wilcoxon rank-sum test) (Figure 1B).Furthermore, the average number of matched transcripts from the cell type-level was more than twice that from the bulk-seq method(average 48,854 transcripts) (Figure 1B).
According to the cell type-level pooling strategy, the cells from all patients across three cancer types were partitioned into 266 subsets (Figure 1C, Figure S1A), and the mapping results of cells from the same subset were merged and fed into the assembling program. We found that the number of assembled transcripts across different subsets showed positive correlations with the number of cells in these subsets in both CRC and NSCLC datasets(CRC:R=0.6 andP=4.3E−11;NSCLC:R=0.72,P<2.2E−16),but not in the HCC dataset (R= 0.22,P= 0.17) (Figure 1D,Figure S1F). Then, assembled transcripts from all subsets were merged together,and a total of 751,710 primary genes were obtained. Next, we compared our assembled transcriptome with reference gene models. The results showed that reference lncRNA genes had a lower detection rate than protein-coding genes.Specifically,82%(16,399/19,938)of the known protein-coding genes in GENCODE v31 could be verified, with 44% (8893/19,938) completely matched with the same intron chain, while 16% (9567/59,489) of known lncRNA genes were verified,with 5%(3140/59,489)completely matched (Figure 1E). These findings suggest that lncRNAs are expressed in a much more cell-specific manner than protein-coding genes, and further studies to uncover novel lncRNAs specifically expressed in human T cells are needed.
From the primary assembly, we developed a custom pipeline to identify novel lncRNAs.Briefly,we first selected transcripts that are more than 200 nt and have multiple exons.The transcripts that overlapped with known proteincoding or lncRNA genes were filtered out. Then, the transcripts that lacked coding potential predicted by both Coding Potential Calculator (CPC) [36] and Coding-Non-Coding Index (CNCI) [37] were retained. Finally, the remaining transcripts that were reconstructed in at least two subsets with complete match were defined as the novel lncRNA catalog (Figure 1C). Through this multi-layer analysis, we identified 9433 previously unknown lncRNA genes (13,025 transcripts with mean length of 1112 nt),which increased the number of current human lncRNA catalog [38] by 16% and nearly doubled the number of lncRNAs expressed in human T cells.
Finally, we performed experimental validation to evaluate the robustness of our identified novel lncRNAs.First, fresh peripheral blood samples were collected from three CRC patients (Table S2). Then, mononuclear cells were isolated from each sample. The CD8 and CD4 T cells were separated by immunomagnetic beads, and the separation efficiency was verified by flow cytometry (Figure 2A and B). We then selected 50 novel lncRNA transctipts for qRT-PCR analysis and Sanger sequencing across T cell samples. As a result, 38 novel lncRNA transcripts were verified successfully by Sanger sequencing (Table S3). As an example,for a novel lncRNATCONS_00180551located in an intergenic region of chromosome 11,the BLAT search result of Sanger sequencing exactly matched the junction of this novel lncRNA(Figure 2C).
Lower detection rates and expression levels of lncRNAs in T cells
Based on the relative genomic locations to reference protein-coding genes, the novel lncRNA transcripts were classified into three locus biotypes, including 6525 as intergenic,3187 as intronic,and 3313 as antisense lncRNAs.As in the case of reference lncRNA genes, these novel lncRNA genes showed fewer exons(the average number of exons was 2) and lower detection rates and average gene abundance than protein-coding genes at the single-cell level(Figure 3A and B).Specifically,by using pseudoalignment of scRNA-seq reads to both reference and novel lncRNA transcriptomes, on average 5902 genes were detected(counts larger than 1) in each cell, 41% (2397) of which were lncRNA genes, including 1258 reference and 1139 novel lncRNA genes (Figure 3A). Furthermore, for both reference and novel lncRNA genes,the average number of expressed genes across T cells was significantly lower than that of protein-coding genes.More precisely,we found that an average of 5596 protein-coding and 2093 lncRNA genes were expressed in at least 25%of cells.In such a situation,novel lncRNA genes exhibited a higher average expression number and expression rate than reference lncRNA genes[1489vs. 604; 15.8% (1489/9433)vs. 1% (604/59,489)](Figure 3B),suggesting that novel lncRNAs exhibited more enrichment than known lncRNAs in T cells in cancer.Moreover,we performed further analysis to investigate the specifically expressed lncRNAs in different tissues for each cancer type. In brief, for CD4 and CD8 T cells of three cancer types,we totally identified 96 and 90 lncRNA genes(including 44 and 40 novel lncRNA genes) that were expressed in a tissue-specific pattern,respectively(Table S4).For example, some novel lncRNA genes such asXLOC-301694andXLOC-126527were significantly expressed in CD4 T cells from tumor tissue of CRC(adjustedPvalue = 3.17E−68 and 1.72E−64, respectively), while others such asXLOC-302096andXLOC-502999were significantly enriched in CD4 T cells from normal tissue and peripheral blood of CRC, respectively (adjustedPvalue = 9.18E−82 and 1.35E−44, respectively) (Table S4).Finally, we assessed the evolutionary conservation of these novel lncRNA transcripts and found that,on average,61.2%have orthologous regions in the primate genomes,while only 3.4%are mapped to the mouse genome,suggesting the poor sequence conservation of these novel lncRNA transcripts.
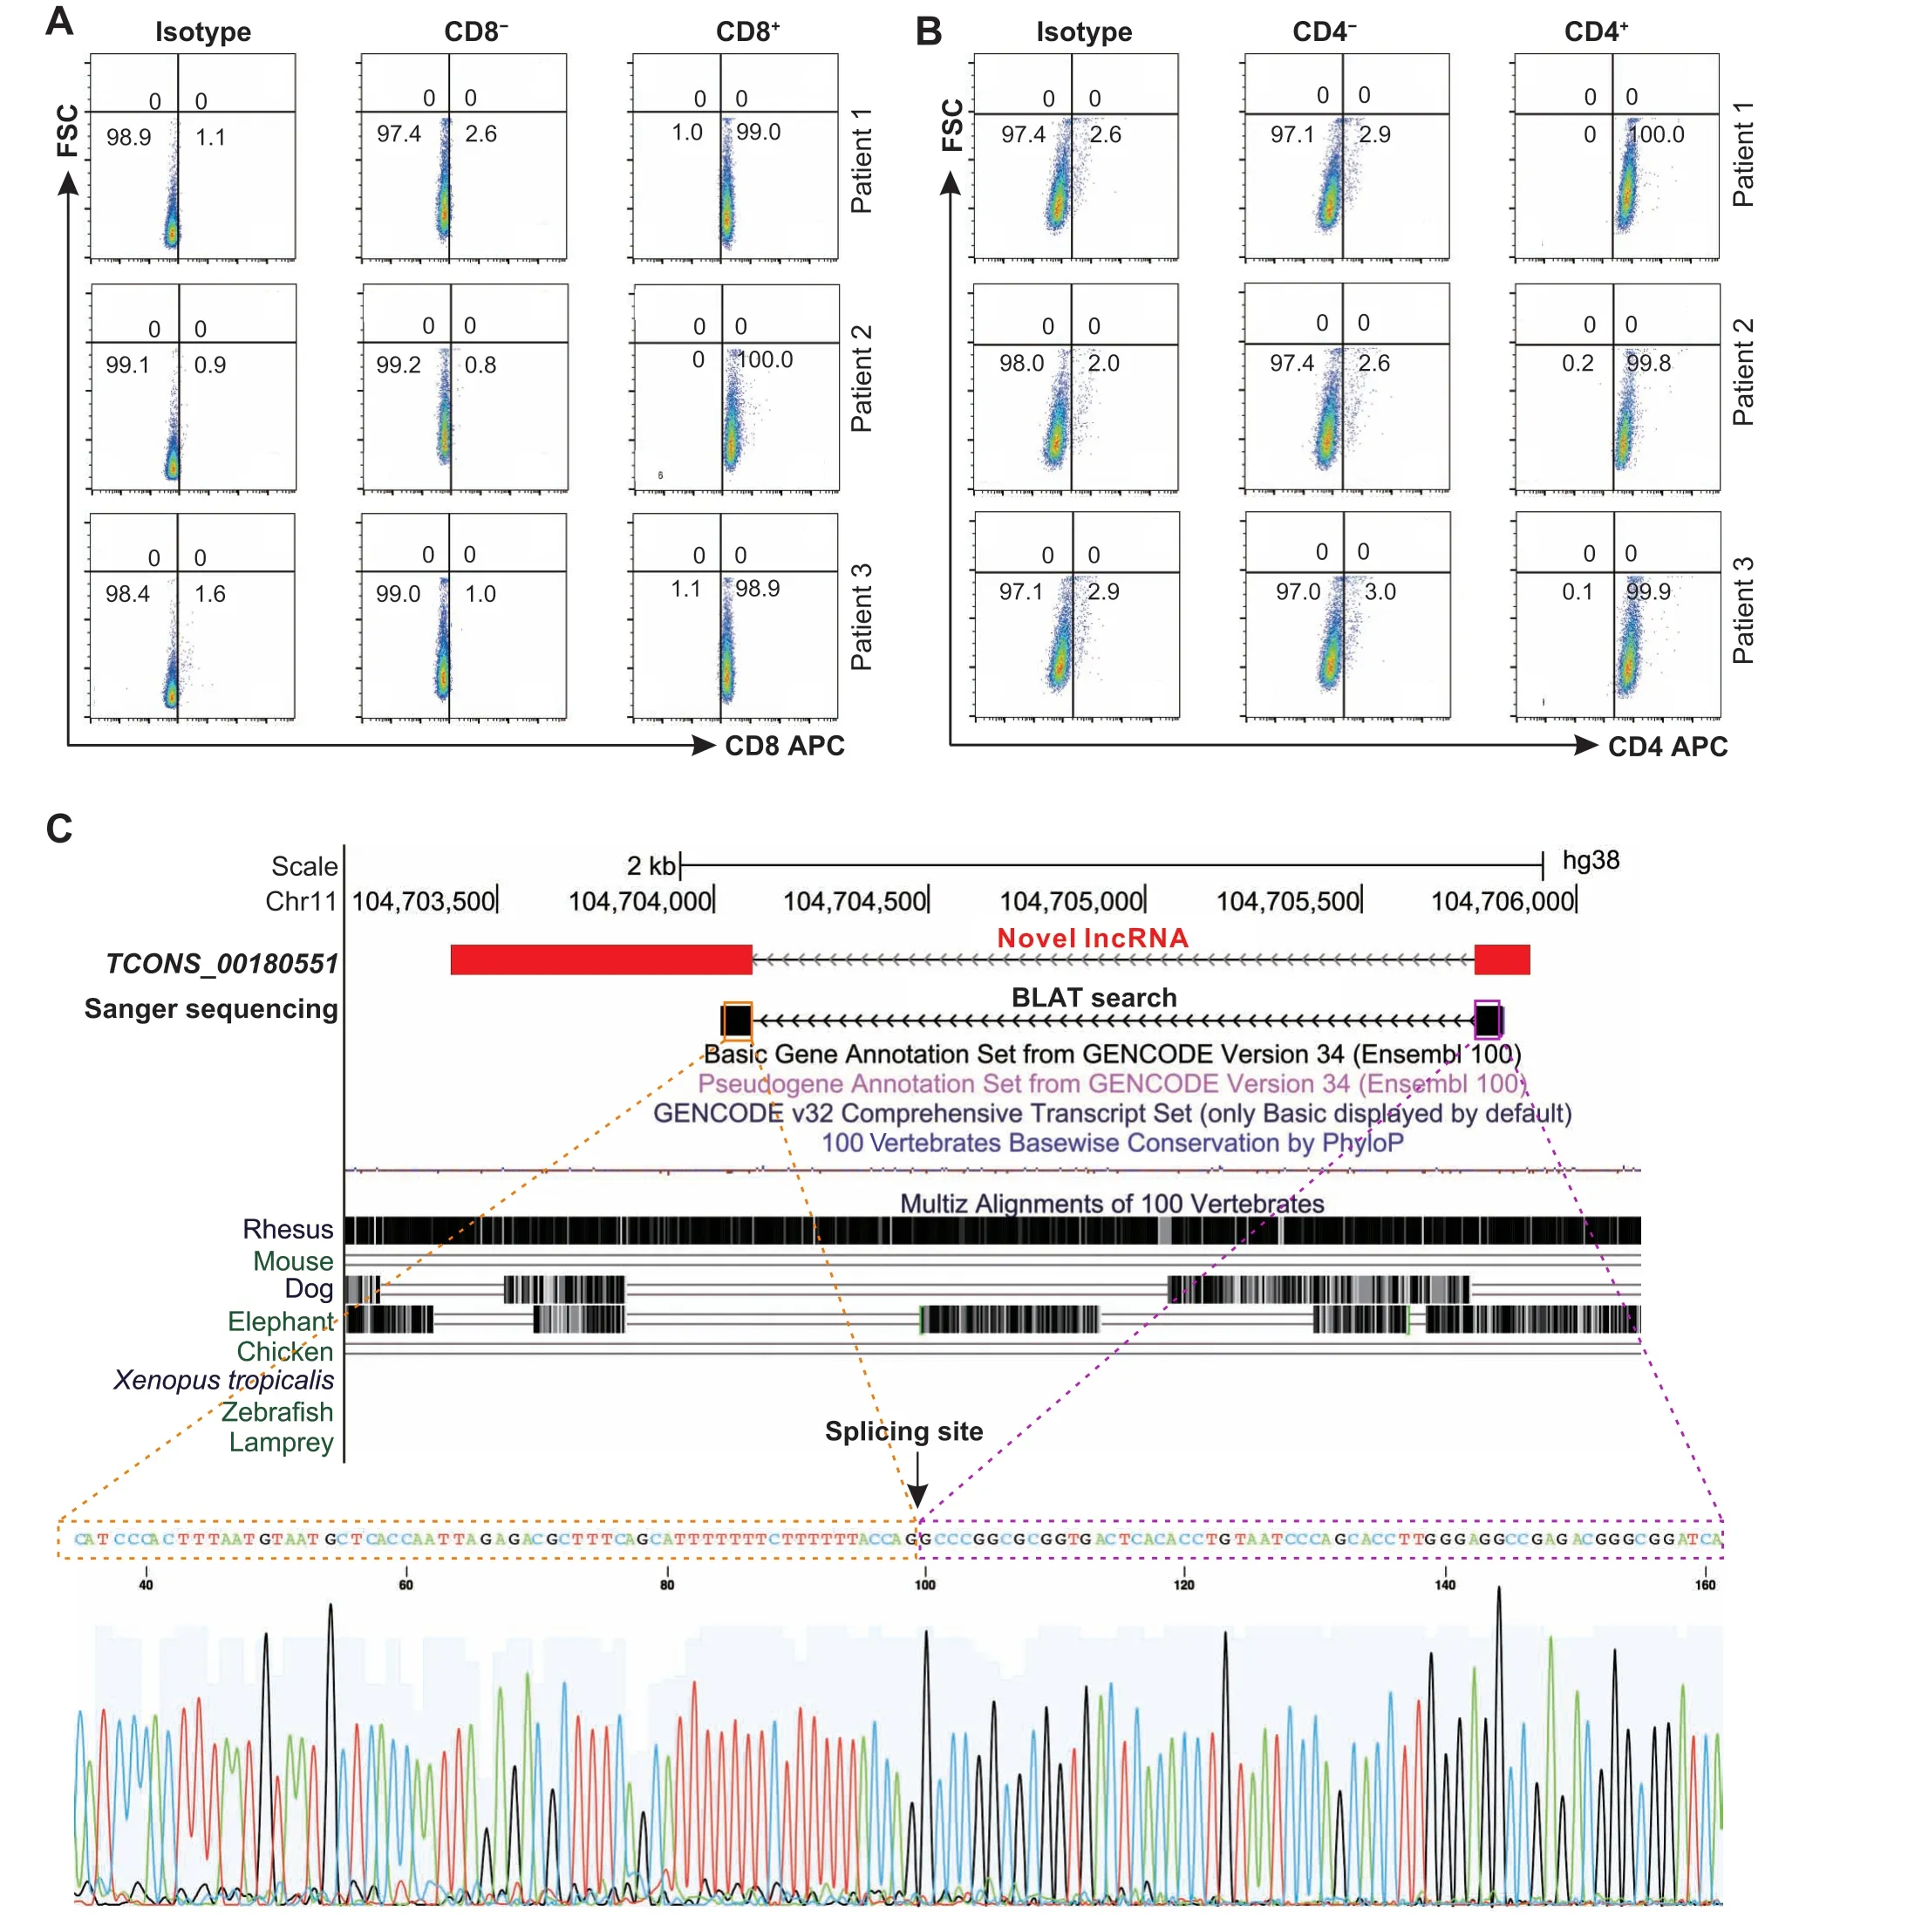
Figure 2 Validation of novel lncRNAs using qRT-PCRA.Flow cytometric analysis for CD8 T cells.T cells from three NSCLC patients were separated by magnetic beads and stained with antibody CD8-APC.B.Flow cytometric analysis for CD4 T cells.T cells from three NSCLC patients were separated by magnetic beads and stained with antibody CD4-APC.Isotype was used as a negative control. C. An example of novel intergenic lncRNA that was validated by Sanger sequencing. The genomic views are generated from the UCSC Genome Browser. The spliced sequence outputted by Sanger sequencing is shown.
More than one hundred signature lncRNAs associated with T cell states were identified based on metacell maps
To explore signature lncRNAs associated with T cell states in cancer immunity,we used the MetaCell method[31]that partitioned the scRNA-seq datasets into disjointed and homogeneous cell groups (namely metacells) using the non-parametricK-nn graph algorithm. For the low and specific expression nature of lncRNA genes, metacells pooling together data from cells derived from the same transcriptional states could serve as building blocks for approximating the distributions of lncRNA gene expression and minimizing the technical variance and noise. After quality control, 19,572 cells with predefined cluster annotations and 21,205 genes, including both proteincoding and lncRNA genes, were retained and used for the following analyses. The expression tables of CD8 and CD 4 T cells across three cancers (Tables S5 and S6) were fed into the MetaCell pipeline separately, resulting in detailed maps of 43 and 65 metacells,respectively(Figure 4A and B).
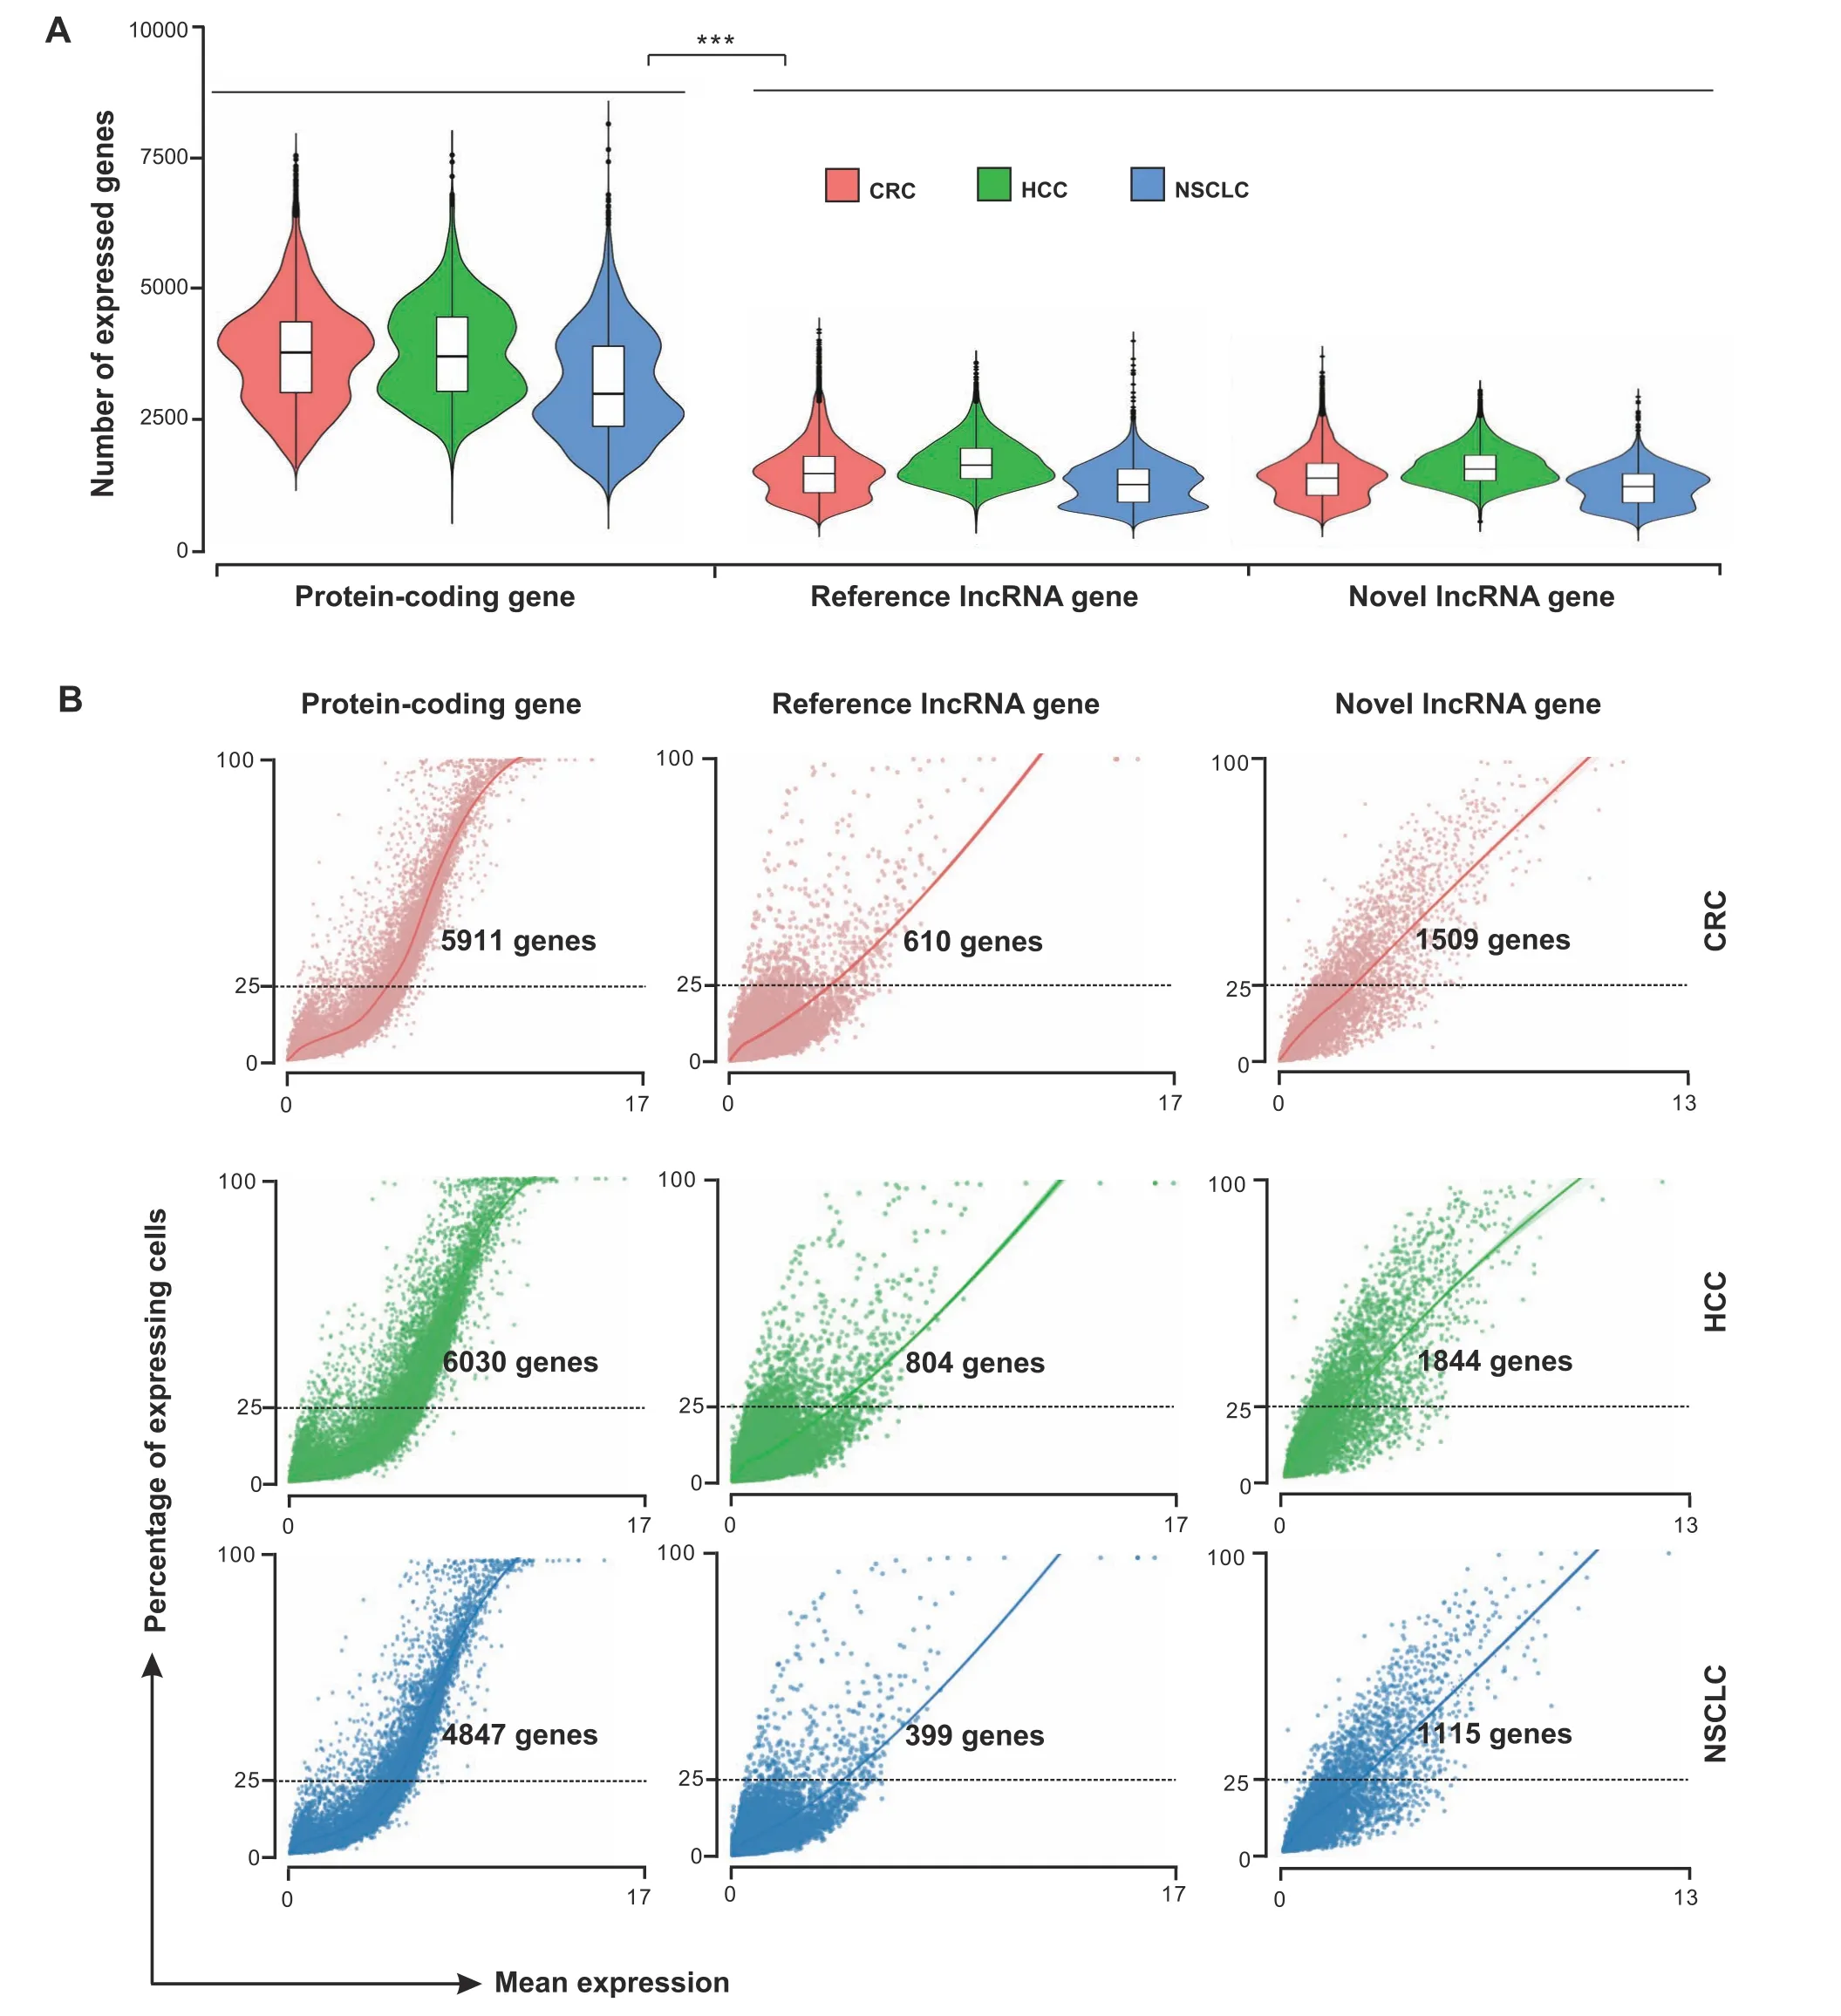
Figure 3 Expression features of reference genes and novel lncRNA genes at the single-cell levelA.Number of protein-coding,reference lncRNA,and novel lncRNA genes expressed in T cells across three cancer types.***,P<0.001(Wilcoxon ranksum test). B. Plots showing the percentage of expressing cells against the mean expression level (log counts) for protein-coding, reference lncRNA, and novel lncRNA genes across three cancer types. The number of genes that are expressed in at least 25% of the cells is provided in the figure.
Based on the 2D projections (Figure 4A and B), the predefined cell cluster annotations (Table S1), and the metacell similarity matrices (similarity among 43 or 65 metacells for CD8 or CD4 T cells)(Figure 4C and D,Figure S2A and B),we organized the complex transcriptional landscape of CD8 T cells into naïve, effector/pre-effector, intermediate, and exhausted metacell groups and that of CD4 T cells into naïve,effector, intermediate, exhausted/pre-exhausted, and regulatory(including FOXP3+CTLA4lowand FOXP3+CTLA4high)metacell groups(Figure 4C and D).To evaluate the composition of metacells, we mapped tissue- and cancer-specific patterns in all metacells and achieved results in accordance with previous studies[32–34](Figure 4C and D,Figures S3 and S4). As an example, exhausted metacells were preferentially enriched in tumors,while effector metacells were prevalent in peripheral blood. Although some metacells were enriched in different cancer types,they were organized into the same functional groups(Figure 4C and D).Notably,effector metacell groups (cytotoxic state) and exhausted metacell groups (dysfunctional state) were located in different directions in the metacell maps, while the diffuse border was observed between the intermediate state and the cytotoxic or dysfunctional state (Figure 4E and F). These intermediate cells exhibited remarkable transcriptional heterogeneity indicating functional divergence of these cells(Figure 4E and F,Figures S3 and S4).The observed cluster distribution in both CD8 and CD4 metacell maps might suggest a relative transition from activation to exhaustion that began with naïve cells,followed by intermediate cells,such as central memory(CM),effector memory(EM),and tissue-resident memory (RM) cells, and ended with exhausted cells. Moreover, the CD4 metacell map revealed that Tregs were subdivided into FOXP3+CTLA4lowTregs and FOXP3+CTLA4highTregs that were preferentially enriched in peripheral blood and tumors,respectively(Figure 4D and F). These observations demonstrated that the diversity and dynamics of T cell states in cancer immune infiltrates could be controlled by complex and intricate gene regulatory mechanisms.The association between these cell states and lncRNAs is still poorly characterized,prompting us to subsequently investigate the potential roles of lncRNA genes in T cells. Currently, a few cell groups, such as FOXP3+CTLA4highTregs and exhausted T cells (both expressing inhibitory receptors,e.g., PDCD1 and TIGIT),have been used as therapeutic targets for anti-cancer immunotherapies[1–3],thus we focused on these cells in the following analyses.
To explore signature lncRNAs associated with effector T cells, exhausted T cells, and Tregs, we performed a systematic analysis of these metacell groups based on welldefined anchor genes[39],such as the genes associated with CD8 effector functions (CX3CR1,FGFBP2,GZMH, andPRF1) or with the CD8 exhausted state (HAVCR2,LAG3,PDCD1,TIGIT, andCTLA4). As a result, 154 lncRNA genes were identified to be significantly correlated to the anchor genes,which were involved in a set of co-expressed gene modules,including effector,exhausted,and Treg gene modules (Figure 5A and B; Table S7). Interestingly, a putative CTLA4highTreg gene subset was observed in the Treg gene module,suggesting its specific functional role in tumor-infiltrating Treg cells(Figure 5B).Overall,combined with the expression profile across metacell groups, we found 47 and 79 lncRNA genes correlated with effector and exhausted states in CD8/CD4 T cells, respectively, which were designated as effector and exhausted signature lncRNAs, respectively (Figure 5C, Figure S5). Similarly, 49 lncRNA genes were highly associated with Tregs and were designated as Treg signature lncRNAs(Figure S5).Among these signature lncRNA genes,14 were shared between CD8 and CD4 effector states; 7 were shared between CD8 and CD4 exhausted states; 21 lncRNA genes associated with Tregs overlapped with those characteristics in the exhausted CD 4 T cells (Table S7), indicating the presence of shared regulatory roles of these lncRNAs.In contrast,no signature lncRNA was shared between exhausted and effector states.
The functions of 84 signature lncRNAs were annotated by co-expression networks
To gain further insights into the functional roles of signature lncRNAs in different T cell states in cancer, we built a coding-noncoding network (CNC), as we previously reported [40,41], using linear correlation over all metacells.Applying this strategy, the functions of 54% (84/154) signature lncRNAs were annotated (Table S8). As expected,both CD8 and CD4 exhausted T cells had the functional enrichments of signature lncRNAs that were markedly different from CD8 and CD4 effector T cells, respectively,including regulation manners in immune system processes and several signaling pathways (Figure 6A and B). For example, exhausted signature lncRNAs were significantly enriched in immunoinhibitory functions such as negative regulation of immune response (adjustedPvalue =2.96E−14),negative regulation of Tcell activation(adjustedPvalue=1.24E−06),and positive regulation of interleukin-10 biosynthetic process (adjustedPvalue = 1.02E−18). In comparison, effector signature lncRNAs were enriched in cytotoxic programs such as T cell proliferation involved in immune response (adjustedPvalue = 8.16E−09), positive regulation of cytokine secretion (adjustedPvalue =4.65E−05),and positive regulation of cytolysis(adjustedPvalue= 1.59E−19) (Figure 6A and B; Tables S9 and S10).These results are consistent with the phenotypes of exhausted or effector states of T cells as described in previous studies[1,32–34,42].In addition,the enriched functions of Treg signature lncRNAs were similar with those of CD4 exhausted signature lncRNAs involving multiple immunosuppressive programs (Figure 6C; Table S11), suggesting the shared regulatory roles of these lncRNAs in CD4 Tregs and exhausted T cells. Further analysis of the functions of co-signature lncRNAs that were shared between CD8 and CD4 exhausted or effector states,as well as between CD4 exhausted and Treg states (Figure S6), suggested that the signature lncRNAs might broadly participate in the regulation of T cell functions within the human tumor microenvironment.
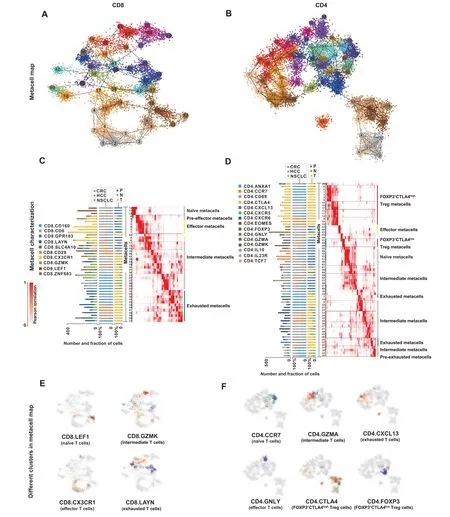
Figure 4 Characterization of T cell states based on the 2D projection of T cells and the annotation of metacell mapsA.2D projection of CD8 T cells from three cancer types into 43 metacells.B.2D projection of CD4 T cells from three cancer types into 65 metacells.In panels A and B, metacells are indicated as nodes, which are numbered (1–43) and color-coded for differentiation. Cells are shown as small data points,which are color-coded according to the metacells they belong to. C. CD8 metacells (rows) ordered by groups and organized within each group. D. CD4 metacells(rows)ordered by groups and organized within each group.The left bar plot shows the number of cells of different clusters in each metacell.The middle and right bar plots show the percentage of cells from different cancer types(CRC,HCC,and NSCLC)and tissues(P,N,and T)in each metacell,respectively.Heatmaps show the confusion matrices(the pairwise similarities between metacells)for CD8 or CD4 metacells.The annotations of different metacell groups are shown on the right.E.2D projections of the composition of CD8 T cells from different clusters.F.2D projections of the composition of CD4 T cells from different clusters. In panels E and F, cells from different clusters are colored-coded according to the metacells they belong to.
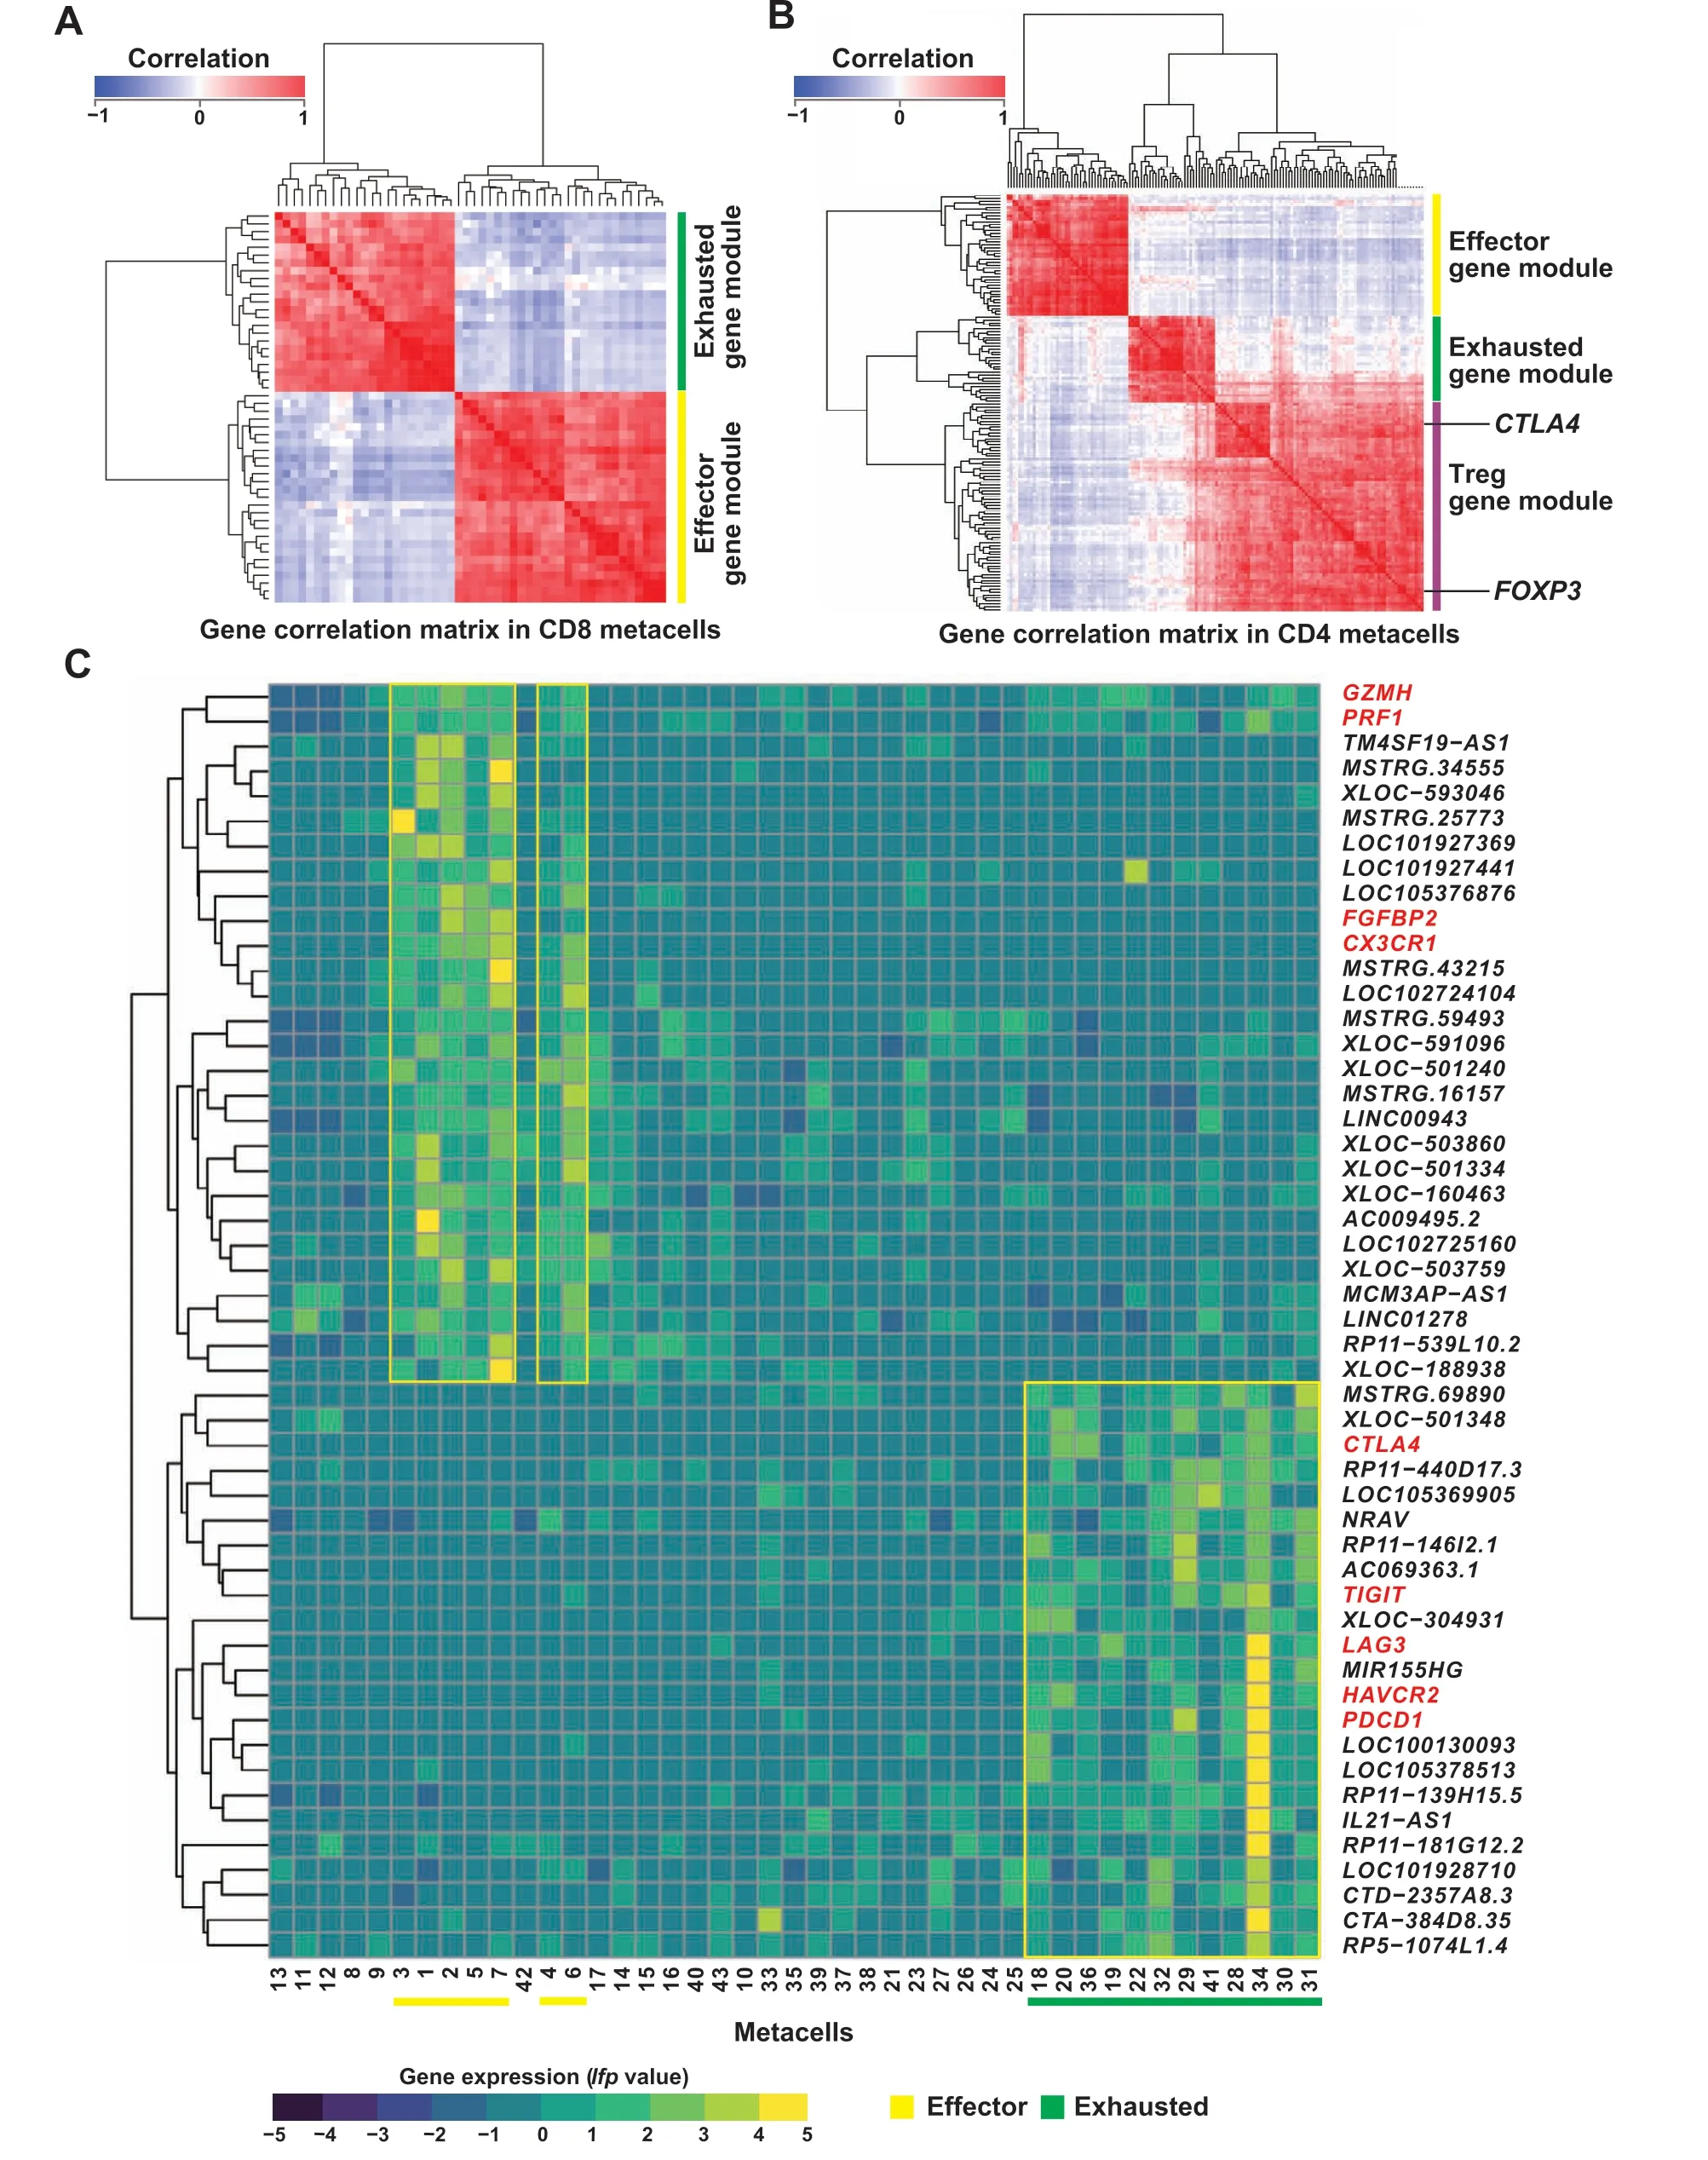
Figure 5 Correlation and expression analyses of signature lncRNAs associated with different T cell statesA.Pearson correlation heatmaps for signature lncRNA genes and anchor genes in CD8 metacells.B.Pearson correlation heatmaps for signature lncRNA genes and anchor genes in CD4 metacells.The signature gene modules and two anchor genes(CTLA4 and FOXP3)are labeled on the right.C.Expression(log fold enrichment values;lfp values)of signature lncRNA genes and anchor genes across CD8 metacells.Signature lncRNA genes and anchor genes are marked in black and red on the right,respectively.Metacells are numbered at the bottom.Metacell groups associated with effector and exhausted functions are underlined with yellow and green bars, respectively.
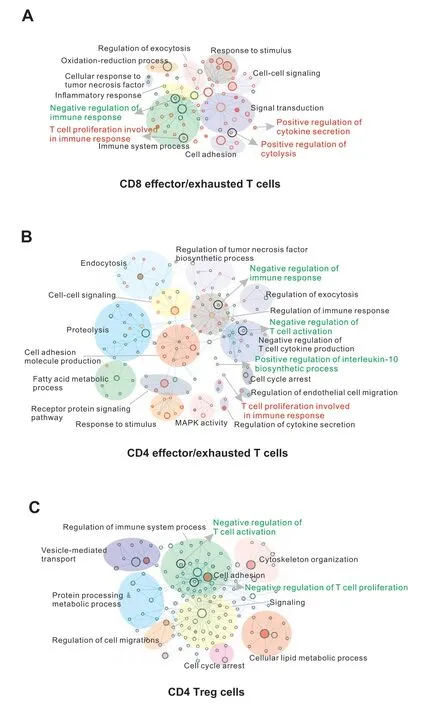
Figure 6 Functional annotation of signature lncRNAsA. Functional enrichment maps of signature lncRNAs for CD8 effector/exhausted T cells. B. Functional enrichment maps of signature lncRNAs for CD4 effector/exhausted T cells. C. Functional enrichment maps of signature lncRNAs for CD4 Treg cells.The enriched gene sets from Gene Ontology based on the predicted functions of signature lncRNA genes are visualized by Cytoscape plugin Enrichment Map. Each node represents a gene set;the size of the node is indicative of the number of genes and the color intensity of the node reflects the level of significance. Effector signature gene sets are shown in red circles, exhausted or Treg ones in green circles, and the common gene sets in orange circles. Maps are magnified differently for easy visualization.
For example, a known lncRNATM4SF19-AS1, defined as a signature lncRNA for both CD8 and CD4 effector T cells, was transcribed in the antisense orientation to theTM4SF19gene and co-expressed with 66 protein-coding genes and 11 lncRNA genes (Figure 7A and B). Of note,TM4SF19-AS1was highly correlated and located in the same topologically associated domain (TAD) with its host geneTM4SF19(Pearson correlation coefficient = 0.88)(Figure 7A), a member of the four-transmembrane L6 superfamily participating in various cellular processes including cell proliferation, motility, and cell adhesion [43–46].Consistently,TM4SF19-AS1was significantly enriched in several effector T cell-associated processes such as cellular response to cholesterol(adjustedPvalue=1.09E−30),cell adhesion(adjustedPvalue=5.25E−27),and regulation of tumor necrosis factor biosynthetic process (adjustedPvalue=3.75E−11)(Figure 7C).Interestingly,a recent study suggested that the anti-tumor response of CD8 T cells could be enhanced by regulating cholesterol metabolism[47].For another example, a novel lncRNAXLOC-633950, defined as a signature lncRNA for both CD4 exhausted T cells and Tregs, was an intergenic gene and transcribed from the promoter-enhancer cluster region of theSLAandCCN4genes(Figure 7D).Furthermore,XLOC-633950,as a novel gene whose expression was supported by multiple expressed sequence tags(ESTs),was located in the same TAD with theSLAgene, which acted as an inhibitor of antigen receptor signaling by negative regulation of positive selection and mitosis of T cells [48–51] (Figure 7D). In accordance withSLAfunctions,the functional enrichments ofXLOC-633950according to its co-expressed protein-coding genes were mainly associated with immunoinhibitory processes, such as negative regulation of T cell cytokine production (adjustedPvalue = 4.56E−13) and negative regulation of T cell proliferation and activation(adjustedPvalue = 7.25E−11 and 5.85E−08, respectively) (Figure 7E and F). These results provided a starting point for future dissecting the mechanisms of signature lncRNAs.
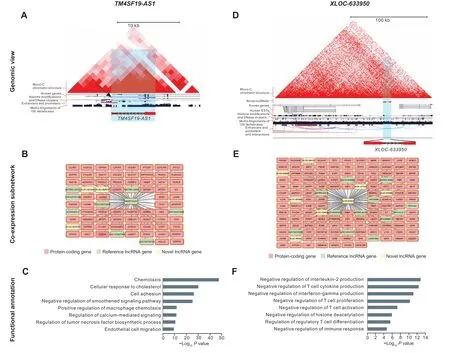
Figure 7 Genomic and functional characterization of example signature lncRNAsA. Genomic view of a known effector signature lncRNA TM4SF19-AS1. The genomic view is generated from the UCSC Genome Browser. B. Coexpressed genes of TM4SF19-AS1.Co-expressed protein-coding genes,reference lncRNA genes,and novel lncRNA genes are colored in pink,light green,and light yellow, respectively. C. Functional annotations of TM4SF19-AS1 based on co-expression network. D. Genomic view of a novel exhausted signature lncRNA XLOC-633950. The genomic view is generated from the UCSC Genome Browser. E. Co-expressed genes of XLOC-633950. Coexpressed protein-coding genes, reference lncRNA genes, and novel lncRNA genes are colored in pink, light green, and light yellow, respectively. F.Functional annotations of XLOC-633950 based on co-expression network.
Discussion
Despite the obvious advantages, most scRNA-seq datasets were still limited in their ability to study lncRNAs, which have emerged as central players and key regulators in a number of biological processes such as anti-tumor immune response [52,53]. In comparison with many scRNA-seq methods that amplify only the 3ʹend of transcripts, the SMART-seq2 protocol could generate full-length cDNA from polyadenylated transcripts and thus is suitable for analysis of lncRNAs [30,54]. In the current study, we performed systematic analyses of SMART-seq2 full-length scRNA-seq datasets and provided the first comprehensive atlas of lncRNAs in T cells of human cancer.
Recently, Jiang et al. [38] presented a comprehensive human lncRNA catalog (RefLnc) containing 77,900 lncRNAs based on analysis of 14,166 polyA(+) RNA-seq libraries and previously known annotations. Among the RefLnc lncRNAs, only 16% could be assembled and expressed in T cells. In addition, compared with bulk RNAseq data, scRNA-seq data could detect more known and novel transcripts.These observations suggested that despite the vast number of lncRNAs that have been identified using bulk RNA-seq data[10,12,26,38,55],the catalog of human lncRNAs is still far from being complete at single-cell resolution due to their low and cell-specific expression patterns. Based on the cell-pooling strategy and more than 20,000 scRNA-seq libraries from 31 patients across three cancer types, we identified 9433 previously non-annotated lncRNA genes. These results significantly expand the current lncRNA catalog and enable us to carry out in-deep analysis of the T cell context-specific lncRNA transcriptome.It should be noted that the StringTie method we used to assemble transcripts was not designed for single-cell data and may decrease the sensitivity of lncRNA detection at the single-cell level.To effectively identify lncRNAs,the reads from 90 cells on average were pooled together and then were fed into the StringTie program. The number of unique mapped reads for each cell set were equivalent to those produced by canonical RNA-seq data. Nevertheless,further evaluation of StringTie performance on such pooling reads is needed. Furthermore, all the scRNA-seq data used in the current study were generated by sequencing the polyadenylated transcriptome, in which nonpolyadenylated lncRNAs were absent.
Several previous studies have applied full-length scRNA-seq to unleash tumor-infiltrating lymphocytes in HCC [34], NSCLC [32], and CRC [33], providing a deep understanding of the immune landscape of T cells in cancer.Nevertheless, the physiological functions of lncRNAs in different T cell states during the cancer immune response remain elusive. Although the abundance of lncRNAs is relatively low and hard to distinguish from technical noise in single T cells,pooling the transcripts from multiple cells that are derived from the same cell state allows more accurate quantification of lncRNAs, making it feasible to explore their signatures and putative regulatory mechanisms associated with T cell states in cancer immunity. Based on such partitioning and pooling strategies, in this study, we used the MetaCell method to identify homogeneous T cell groups from scRNA-seq data and derived detailed maps of 43 and 65 metacells for CD8 and CD4 T cells,respectively.These metacells with higher homogeneity allowed a more accurate quantification of lncRNAs as well as identification of T cell differentiation gradients. For example, we observed 7 metacells involved in CD8 effector cell cluster,which might reflect the transcriptional heterogeneity in this cluster(Figure 4C).The roles of lncRNAs in these different subsets (metacells) of CD8 effector T cells need further investigation.While MetaCell was not designed to perform single-cell lncRNA analysis, the MetaCell partitioning algorithm facilitated robust cell grouping of scRNA-seq data,which enabled us to study lncRNAs more accurately.
According to the metacell maps (Figure 4E and F), in contrast to the pool of intermediate T cells with diffuse borders with other cell states, a discrete pool of effector T cells, exhausted T cells, and Tregs was observed that showed clear gaps among them, thus facilitating unbiased analysis of signature lncRNAs in these cell states. In total,154 signature lncRNA genes were obtained, providing a useful reference lncRNA resource to further investigate their functions in T cell-mediated cancer immunity. Since lncRNAs generally interact with protein-coding genes, and highly correlated genes generally have similar functions,the putative functions of these signature lncRNA genes could be predicted by the co-expressed protein-coding genes.Therefore, by constructing the ‘two color’ co-expression network in which both protein-coding and lncRNA genes were involved,the functions of 84 signature lncRNA genes were annotated. Some lncRNAs were genomically colocated with their host genes, which revealed the complicated regulation mechanisms of lncRNAs in cancer immunity. For example, as described above,TM4SF19-AS1was both co-expressed and co-located with its host geneTM4SF19,whose family had functions in various biological processes,including cell proliferation and cell adhesion that were consistent with the characteristics of effector T cells[43–46].
Our study has a few limitations which could be addressed in the future. On the one hand, limited by the sources of high-quality SMART-seq2 data, only three cancer types were studied in this work.On the other hand,other types of immune cells involved in tumor, such as dendritic cells,natural killer cells, and tumor-associated macrophages,were not included.To depict a more comprehensive atlas of lncRNAs in cancer immune regulation at single-cell level,more cancer types and immune cells should be further explored in the future.
In summary, the current study provides the first comprehensive catalog and the functional repertoires of lncRNAs in human cancer T cells.Although the expression patterns and exact mechanisms of these signature lncRNAs in regulating T cell states need further experimental validation,we provide the groundwork for future studies of the functional mechanisms of lncRNAs in the T cell-mediated cancer immunity,especially in two of the essential states of T cells: effector state and exhausted state. The signature lncRNAs of CD8 exhausted T cells and tumor Tregs may serve as new targets for novel cancer-immune biomarker development and cancer immunotherapies.
Materials and methods
Full-length scRNA-seq and bulk RNA-seq datasets from cancer patients
Raw sequencing data of three compendium datasets used in the current study were authorized by the European Genomephenome Archive (EGA) and obtained from the EGA database (EGA: EGAS00001002791, EGAS00001002430,and EGAS00001002072). The CRC scRNA-seq dataset contains the raw data of 11,138 single T cells isolated from different tissues (peripheral blood, adjacent normal, and tumor tissues) of 12 CRC patients [33]. The NSCLC scRNA-seq dataset contains the raw data of 12,346 single T cells from 14 NSCLC patients [32]. The HCC scRNA-seq dataset contains the raw data of 5063 single T cells from 6 HCC patients[34].All the data were generated by Illumina HiSeq 2500 sequencer with 100 bp pair-end reads or Illumina Hiseq 4000 sequencer with 150 bp pair-end reads.The cells from HCC patient P1202 (TCRs could not be assembled in those cells) were not analyzed in the current study. After preliminary filtration, 24,068 T cells with at least one pair of TCR α and β chains were retained.The bulk RNA-seq data of five tumor samples from HCC patients were obtained from the HCC dataset.
According to the cell annotations from original papers[32–34],these T cells were classified into different subtypes(Figure S1A; Table S1). PTC, NTC, and TTC represent CD3+CD8+T cells that were isolated from peripheral blood,adjacent normal, and tumor tissues, respectively. PTH,NTH, and TTH represent CD3+CD4+CD25lowT cells that were isolated from the three tissues. PTR, NTR, and TTR represent CD3+CD4+CD25highT cells that were isolated from the three tissues.PPQ,NPQ,and TPQ represent CD4+T cells that were isolated from the three tissues.PTY,NTY,and TTY represent CD4+CD25intT cells that were isolated from the three tissues.
Read mapping and transcript assembling
Clean reads from each T cell were mapped to the human reference genome (version hg38/GRCh38) using STAR aligner (v2.7.1) [56] with thetwopassModeset as Basic.The BAM files of T cells from each cell type of each patient were merged using SAMtools merge [57]. StringTie(v2.0.3) [35] was used to assemble transcripts based on genomic read alignments. Assembled transcripts of all cell types across all patients were merged together using the Cuffmerge utility of the Cufflinks package[58].
Comparison with reference gene annotation
For reference gene annotation, lncRNA genes were collected from RefLnc [38], and other genes were collected from GENCODE v31 [59]. According to the “class code”information outputted by Cuffcompare, the merged assembly was classified into four categories by comparison with the reference gene annotation, including known proteincoding genes, known lncRNA genes, potentially novel genes (class code is “i,x, u”),and others.
Identification of novel lncRNAs
Based on the potentially novel gene catalog derived from single-cell data, we developed a custom pipeline for the identification of reliable novel lncRNAs that included the following steps: 1) transcripts that were more than 200 nt and had more than one exon were selected for downstream analysis(for intergenic transcripts,at least 1 kb away from known protein-coding genes); 2) transcripts that were predicted to lack coding potential by both CPC[36]and CNCI[37]were regarded as candidate non-coding transcripts and retained; 3) the remaining transcripts that were assembled and had the same intron chain of at least two cell types were retained as the final novel lncRNA catalog. The final lncRNA catalog was obtained by combining the reference lncRNA and novel lncRNA genes directly. The UCSC liftOver tool (http://genome.ucsc.edu/cgi-bin/hgLiftOver?hgsid=806106955_h2xhcK2iPRI7SiMkxkB41I2mwF9O)was used to identify the orthologous locations of human novel lncRNAs in the mouse genome and in the genomes of primates such as chimpanzee and gorilla, with the parameters:Minimum ratio of bases that must remap=0.1 and Minimum ratio of alignment blocks or exons that must map=0.5.
Experimental validation of novel lncRNAs
Three CRC patients were enrolled at Shenzhen People’s Hospital, Shenzhen, China. The clinical characteristics of three patients are summarized in Table S2.Peripheral blood samples from those patients were obtained and treated with anticoagulation. Peripheral blood mononuclear cells(PBMCs)were extracted by Ficoll-Paque Plus(Catalog No.17144003,GE Healthcare,Pittsburgh,PA).Then,CD8 and CD4 T cells were separated by immunomagnetic beads(Catalog No. 130045101, Miltenyi Biotec, Bergis-Gladbach, Germany). The separation efficiency was verified by flow cytometry.The sorted cells were dissolved in Trizol Reagent(Catalog No.15596026,Ambion,Boston,MA) for RNA extraction according to the manufacture’s protocol. cDNA was synthesized by PrimerScript RT Reagent Kit (Catalog No. AHG1552A, Takara, Kyoto,Japan). We chose 50 novel lncRNA transcripts to perform experimental validation according to the following criteria:1) highly expressed in either CD8 or CD4 T cells; 2) reconstructed in at least ten subsets with complete match; 3)uniquely mapped to the human genome. For each lncRNA transcript, at least two pairs of primers for qRT-PCR were designed using NCBI Primer-BLAST (https://www.ncbi.nlm.nih.gov/tools/primer-blast). In order to ensure the specificity of primers, UCSC InSilicon PCR (http://genome.ucsc.edu/cgi-bin/hgPcr) was used to compare the primer pairs with the human genome (hg38). Some primer pairs were specifically designed to span splicing sites(exon junctions). qRT-PCR was performed with SYBR Green Master Mix (Catalog No. RR820A, Takara) on an ABI StepOnePlus (Applied Biosystems, Boston, MA).GAPDHas a housekeeping gene was used as the positive control.For each lncRNA,we selected one qRT-PCR product for Sanger sequencing.
Data normalization
We calculated the read counts and transcripts per million(TPM) values using pseudoalignment of scRNA-seq reads to both protein-coding and lncRNA transcriptomes, as implemented in Kallisto (v0.46.0) [60] with default parameters, and summarized expression levels from the transcript level to the gene level.
Low-quality and doublet cells were removed if the number of expressed genes(counts more than 1)was fewer than 2000 or higher than the medians of all cells plus 3×the median absolute deviation. Moreover, the cells with the proportion of reads mapped to mitochondrial genes larger than 10%were discarded.Genes with average counts more than 1 and expressed in at least 1%of cells for each type of cancer were retained.The combined count tables from all T cells passing the aforementioned filtration were normalized using a pooling and deconvolution method implemented in the R package named ComputeSumFactors [61] with the sizes ranged from 80, 100, 120, to 140. According to the assumption that most genes were not differentially expressed, normalization was performed within each predefined cluster separately to compute cell size factors.The cell size factors were rescaled by normalization among clusters. Finally, the counts for each cell were normalized by dividing the cell counts by the cell size factor.
Construction of metacell maps
The MetaCell method [31], which partitioned the scRNA-seq dataset into disjointed and homogeneous cell groups (metacells) using theK-nn graph algorithm, was performed for both the CD8 and CD4 T cells independently.We first removed specific mitochondrial genes (annotated with the prefix “MT-”) that typically mark cells as being stressed or dying,rather than cellular identity.Based on the count matrices of both protein-coding and lncRNA genes,feature genes whose scaled variance (variance/mean on down-sampled matrices) exceeded 0.08 were selected and used to compute cell-to-cell similarity using Pearson correlations. According to the cell-to-cell similarity matrices,two balancedK-nn similarity graphs for CD8 and CD4 T cells were constructed using the parameterK= 100 (the number of neighbors for each cell was limited byK).Next,we performed the resampling procedures (resampling 75%of the cells in each iteration with 500 iterations) and coclustering graph construction(the minimal cluster size was 50).Finally,the graphs of metacells(and the cells belonging to them) were projected into 2D spaces to explore the similarities between cells and metacells.
Annotation of metacells
Annotation of metacells was performed based on the metacell confusion matrix and predefined cluster annotations(Table S1)of T cells involved in the metacells.Briefly,we first created a hierarchical clustering of metacells according to the number of similarity relationships between their cells.Next, we generated clusters of metacells as confusion matrices based on the hierarchy results, and then annotated these clusters according to the annotations of T cells.
Defining signature lncRNAs associated with T cell states
To identify signature lncRNAs associated with effector and exhausted T cells as well as Tregs,as described in a recent study[39],we adopted the anchor approach by identifying the lncRNAs that were significantly correlated to welldefined anchor genes,based on their expression levels(log fold enrichment scores;lfpvalues calculated by the Meta-Cell method) in metacells. The lncRNAs that significantly correlated with anchor genes (adjustedPvalue < 0.01 and ranked in the top 5 percentile for each anchor gene) were regarded as signature lncRNAs. The anchor genes were defined as follows. The anchor genes of CD8 exhausted T cells includeHAVCR2,LAG3,PDCD1,TIGIT,andCTLA4;the anchor genes of CD8 effector T cells includeCX3CR1,FGFBP2,GZMH, andPRF1; genes associated with Tregs includeFOXP3.The anchor genes of CD4 exhausted T cells includeCXCL13,PDCD1,TIGIT,CTLA4, andHAVCR2;genes associated with CD4 effector T cells includeGNLY,GZMB,GZMH,PRF1, andNKG7.
Functional prediction of signature lncRNAs based on co-expression networks
Based onlfpvalues of both lncRNA and protein-coding genes across all metacells, we used a custom pipeline for large-scale prediction of signature lncRNA functions by constructing the coding-lncRNA gene co-expression networks [40,41]. Briefly, genes with log enrichment scores ranked in the top 75%of each metacell were retained.Then,Pvalues of Pearson correlation coefficients for each gene pair were calculated based on the Fisher’s asymptotic test using the WGCNA package of R.Pvalues were adjusted based on the Bonferroni multiple test correction using the MULTTEST package of R.The gene pairs with an adjustedPvalue < 0.01, Pearson correlation coefficient > 0.7, and ranked in the top 5% for each gene were involved in the co-expression network.
Based on the co-expression network, lncRNA functions were predicted using module- and hub-based methods.Specifically, the Markov Cluster algorithm was adopted to identify co-expressed modules[40].For each module,if the known genes were significantly enriched for at least one Gene Ontology (GO) term, the functions of the lncRNAs involved in the module were assigned as the same ones.For the hub-based method,the functions of a hub lncRNA(node degree > 10) were assigned, if its immediate neighboring genes were significantly enriched for at least one GO term.
Data availability
All the novel lncRNA genes identified in the current study and their expression files are available in the NONCODE database(http://noncode.org/datadownload/Novel_lncRNA_in_T_cells.gtf.gz).
Ethical statement
This study was approved by the Institutional Ethics Committee at Shenzhen People’s Hospital, Shenzhen, China.The written informed consent was obtained from patients.
CRediT author statement
Haitao Luo:Conceptualization, Methodology, Software,Visualization, Formal analysis, Writing - original draft,Writing - review & editing, Funding acquisition.Dechao Bu:Conceptualization, Software, Visualization.Lijuan Shao:Investigation,Resources.Yang Li:Resources.Liang Sun:Software, Funding acquisition.Ce Wang:Data curation.Jing Wang:Data curation.Wei Yang:Data curation.Xiaofei Yang:Data curation.Jun Dong:Conceptualization,Validation,Supervision,Writing-review&editing.Yi Zhao:Conceptualization, Validation, Supervision, Writing - review & editing.Furong Li:Conceptualization, Validation, Supervision, Funding acquisition, Writing - review & editing. All authors have read and approved the final manuscript.
Competing interests
The authors have declared no competing interests.
Acknowledgments
This work was supported by the Science and Technology Project of Shenzhen, China (Grant Nos.JCYJ20190807145013281, JHZ20170310090257380,JCYJ20170413092711058,and JCYJ20170307095822325),the China Postdoctoral Science Foundation (Grant No.2019M663369), and the National Natural Science Foundation of China (Grant No. 31970636).We thank Drs. Lei Zhang and Yao He (Peking University, China) for their assistance with the raw data download. The data analysis was performed on Amazon Web Services (AWS) China region,and we thank Mr.Hansen Huang,Chao Wu,and Fei Shi for providing the technical service and support. We thank Mr. Geoffrey Pearce for his suggestions on the writing of this paper.
Supplementary material
Supplementary data to this article can be found online at https://doi.org/10.1016/j.gpb.2021.02.006.
ORCID
0000-0003-3671-7786 (Haitao Luo)
0000-0002-8833-5432 (Dechao Bu)
0000-0001-7980-2003 (Lijuan Shao)
0000-0001-8199-8527 (Yang Li)
0000-0002-5213-6941 (Liang Sun)
0000-0003-3048-7596 (Ce Wang)
0000-0001-7856-4533 (Jing Wang)
0000-0003-2138-5563 (Wei Yang)
0000-0001-6255-5181 (Xiaofei Yang)
0000-0002-6064-0814 (Jun Dong)
0000-0001-6046-8420 (Yi Zhao)
0000-0002-0606-8861 (Furong Li)
杂志排行
Genomics,Proteomics & Bioinformatics的其它文章
- Genomics, Proteomics & Bioinformatics
- Call for Papers Special Issue on “Artificial Intelligence in Omics”
- Call for Papers Special Issue on “RNA Modifications and Epitranscriptomics”
- Advanced Single-cell Omics Technologies and Informatics Tools for Genomics, Proteomics, and Bioinformatics Analysis
- A Single-cell Transcriptome Atlas of Cashmere Goat Hair Follicle Morphogenesis
- Integration of Droplet Microfluidic Tools for Single-cell Functional Metagenomics: An Engineering Head Start
