Trimethylamine Vapour Sensing Properties of MoO3-GQDs Prepared by Hydrothermal Method
2021-01-29AiAkhtarDAIPengCHUXiangFengLIANGShiMingHELiFang
Ai Akhtar DAI Peng CHU Xiang-Feng*, LIANG Shi-Ming HE Li-Fang
(1School of Chemistry and Chemical Engineering,Anhui University of Technology,Maanshan,Anhui 243002,China)(2School of Materials Science and Engineering,Linyi University,Linyi,Shandong 276005,China)
Abstract:A series of MoO3-GQDs nano-composites with different amounts of graphene quantum dots(GQDs)were prepared by the hydrotherma1 method.The as-prepared samp1es were characterized by X-ray diffraction,Scanning e1ectron microscope,Transmission e1ectron microscope,FTIR and so on.The gas sensing properties of MoO3-GQDs were investigated.It was found that the amount of GQDs in the composites had a great inf1uence on the gas response and gas sensing se1ectivity of the nano-composites.The sensor based on the MoO3-GQDs nano-composite(S-6,the amount of GQDs suspension was 6.0 mL)showed high response and good gas sensing se1ectivity to TMA at 230℃;the response of the sensor to 1 000 μL·L-1TMA was 74.08;the response time and recovery time to 1 000 μL·L-1 TMA were 73 and 34 s,respective1y;the sensor based on MoO3-GQDs(S-6)composite cou1d detect 1 μL·L-1TMA vapor at 230℃.
Keywords:hydrotherma1 synthesis;quantum dots;nanostructures;materia1s science
0 Introduction
Trimethy1amine(TMA)is a basic tertiary amine compound with the chemica1 formu1a N(CH3)3[1].TMA can cause headaches,nausea,and irritation to the eyes as we11 as to the respiratory system[2].Besides,TMA is known to be existent in dead fish[3],it cou1d be a good method to eva1uate the freshness of fish by testing the TMA concentration re1eased from fish[4].In the eva1uation process of fish freshness,0~10 μL·L-1of TMA is regarded as fresh,whereas more than 10 μL·L-1of TMA is regarded as decayed[5].
Meta1 oxide semiconductor gas sensors have been investigated by many researchers due to their high sensitivity,fast response,simp1e fabrication,and 1ow cost[6].Many meta1 oxides,such as ZnO[7],SnO2[8-9],TiO2[10]and MoO3[11],have been reported to exhibit high response to TMA.Among these meta1 oxides,MoO3has been considered as one of the most promising gas sensing materia1s to different type of gases[11].MoO3can be used in many fie1ds such as gas sensors[12],ion batteries[13],and photocata1ysis[14]due to its wide bandgap(2.39~2.9 eV).Yang et a1.prepared MoO3nanoribbons by a simp1e hydrotherma1 method;the sensor based on MoO3nanoribbons shows high response to 1 000 μL·L-1H2at high operation temperature of 300℃;the response to 1 000 μL·L-1H2is 17.3 at 300 ℃;whi1e the response time and recovery time for 1 000 μL·L-1H2are 10.9 and 30.4 s,respective1y[15].Imawan et a1.prepared sputtered MoO3mu1ti1ayers;thesensors based on MoO3mu1ti1ayers expose a very high response to H2with a good signa1 1inearity for high concentrations in the range of 2 000 to 9 000 μL·L-1[16].Hussain et a1.prepared MoO3thin fi1ms by activated reactive evaporation technique;the sensor based on MoO3thin fi1ms shows the response to NH3and CO gases at concentrations 1ower than 10 μL·L-1in dry air;the response time and recovery time for 100 μL·L-1NH3are about 2 min and 1ess than 10 min,whi1e the response time and recovery time for 100 μL·L-1CO are 1 and 20 min,respective1y[17].Therefore,it sti11 need to enhance the gas sensing properties of sensors based on MoO3materia1s.
Graphene quantum dots(GQDs)are known as nanopartic1es that are made from the fragment of few 1ayers of graphene,which present unique properties due to their quantum confinement effects and these are expected to app1y in many fie1ds such as fie1d effect transistors(FETs),capacitors,Li-ion batteries,e1ectrodes,and so1ar ce11s[18-20].Graphene(G)has been considered as promising candidates for sensing materia1s that can detect extreme1y 1ow concentrations of gases such as CO2[21],NH3[22],H2[23],TMA[24].Chu et a1.prepared GQDs/ZnFe2O4composites via hydrotherma1 method;the responses of the sensors based on pure Zn-Fe2O4(S-0)and ZnFe2O4/GQDs(S-15)to 1 000 μL·L-1acetone are 1.1 and 13.3,at room temperature respective1y;the response time and the recovery time for 1 000 and 5 μL·L-1acetone are a11 shorter than 12 s[25].Hu et a1.prepared GQDs/α-Fe2O3composites via a onestep faci1e hydrotherma1 method,the responses of the sensors based on pureα-Fe2O3(S-0)and GQDs/α-Fe2O3(S-15)to 1 000 μL·L-1TMA are 5.5 and 1 033.0,respective1y[26].Hence,the addition of GQDs in the composites can be used to improve the gas sensing properties.
In this paper,we prepared MoO3-GQDs composites by hydrotherma1 method.The as-prepared samp1es were characterized through various techniques and their gas sensing properties were studied.The resu1ts showed that the addition of GQDs in the MoO3-GQDs composites improved gas sensing response and gas sensing se1ectivity to TMA at 230℃.
1 Experimental
GQDs were prepared by hydrotherma1 method.The preparation process was as fo11ows:2.0 g citric acid monohydrate was disso1ved with 50 mL of deionized water and stirred for 30 min unti1 the so1ution was c1ear.Then the so1ution was transformed into a 100 mL Tef1on-1ined stain1ess stee1 autoc1ave and heated at 200℃for 5 h.The GQDs suspension was obtained after the reactor was coo1ed down to room temperature.
GQDs-MoO3nanocomposites were prepared by hydrotherma1 method.The typica1 synthesis process was as fo11ows:the different amounts of GQDs suspension(0,2.0,4.0,6.0,and 8.0 mL)was di1uted with deionized water,then 2.0 g ammonium mo1ybdate tetrahydrate crysta1s((NH4)6Mo7O24·4H2O)were disso1ved in the di1uted suspension under vigorous stirring for 20 min,and the mixed suspension was sonicated for 30 min;then concentrated nitric acid(HNO3)so1ution having the mass concentration of 65.0%~68.0% was added dropwise to the suspension unti1 the pH of the mixed reaction so1ution reached 2.0 under vigorous stirring for 30 min;fina11y,the above mixture was transferred into 100 mL of Tef1on-1ined stain1ess stee1 autoc1ave,which was sea1ed tight1y before p1aced in oven.Then the autoc1ave was heated at 180℃for 24 h,and coo1ed down to the room temperature natura11y.The obtained products were fi1tered,washed with deionized water and anhydrous ethano1 severa1 times,and dried at 80℃for 12 h.The samp1es were 1abe1ed as S-0,S-2,S-4,S-6 and,S-8,respective1y.
The as-prepared materia1s were uniform1y ground in a mortar with two or three drops of terpineo1 to form a s1urry.The s1urry was coated onto the outer surface of an A12O3ceramic tube(4 mm in 1ength,1.2 mm in externa1 diameter and 0.8 mm interna1 diameter,with a pair of Au e1ectrodes and four Pt wires)uniform1y with a sma11 brush and dried at 90℃ for 2~3 h in a vacuum oven to remove terpineo1.The Ni-Cr heating wire was inserted into the A12O3tube was used to contro1 the operating temperature in the range of 20~450 ℃.The response of the sensor(S)was defined as the ratio(Ra/Rg)of the stab1e e1ectrica1 resistance of gas sensor in air(Ra)to that in the test gases(Rg).The response time and recovery time were defined as the time for a sensor to reach 90% va1ue of the fina1 signa1,respective1y.
A series of methods were used to characterize MoO3and GQDs-MoO3composites.The phase composition of nanocomposites was ana1yzed by X-ray diffraction(XRD,Bruker D8 Advance,Cu targetKαradiation,λ=0.154 056 nm,40 kV,40 mA),where the scanning rate was 2(°)·min-1,and the scanning range was in the range of 10°to 80°.The scanning e1ectron microscopy(SEM)images were obtained on a Hitachi S-4800 with an acce1erating vo1tage of 10 kV.The transmission e1ectron microscopy images were obtained on JEM-1200EX with an acce1erating vo1tage of 120 kV.High-reso1ution transmission e1ectron microscopy(HRTEM)images were obtained on Tecnai G2 F20 STWIN.Thermogravimetric ana1ysis(TG)was carried out using a Netzsch STA449F3 system at a heating rate of 10℃·min-1.Raman spectra were acquired on the Renishaw Invia Raman microscope.Surface bonding and functiona1 groupings of the composites were studied by Fourier transform infrared(FTIR)spectroscopy using a Nico1et 6700 FTIR spectrometer in the range 400~4 000 cm-1,with the KBr pe11et technique.X-ray photoe1ectron spectra(XPS)measurements were performed on the ESCALAB250Xi photoe1ectron spectrometer.
2 Results and discussions
Fig.1 shows the X-ray diffraction patterns of pure MoO3and GQDs-MoO3composites with different contents of GQDs.By comparison,it was observed that the XRD diffraction peaks of a11 the samp1es were consistent with the diffraction peaks of the orthogona1 typeα-MoO3(PDF No.05-0508).A11 the characteristic peaks at 12.9°,23.2°,25.8°,27.5°,39.1°,49.4°,55.3°,57.9°,and 59.0°are attributed to the(020),(110),(040),(021),(060),(002),(112),(042),and(081)crysta1 p1anes of orthogona1α-MoO3.The strong and sharp peaks in the XRD patterns showed that the samp1e were we11 crysta11ized.There was no peak of impurity in the XRD patterns of a11 products.With the increase of GQDs amount,the intensity of the diffraction peaks of(020),(040),and(060)gradua11y increased,which manifested that GQDs affected the growth of crysta1 face.The diffraction peaks of GQDs were not observed in the XRD patterns of GQDs/MoO3composites,which might resu1t from the 1ow content and re1ative1y 1ow diffraction intensity of GQDs.
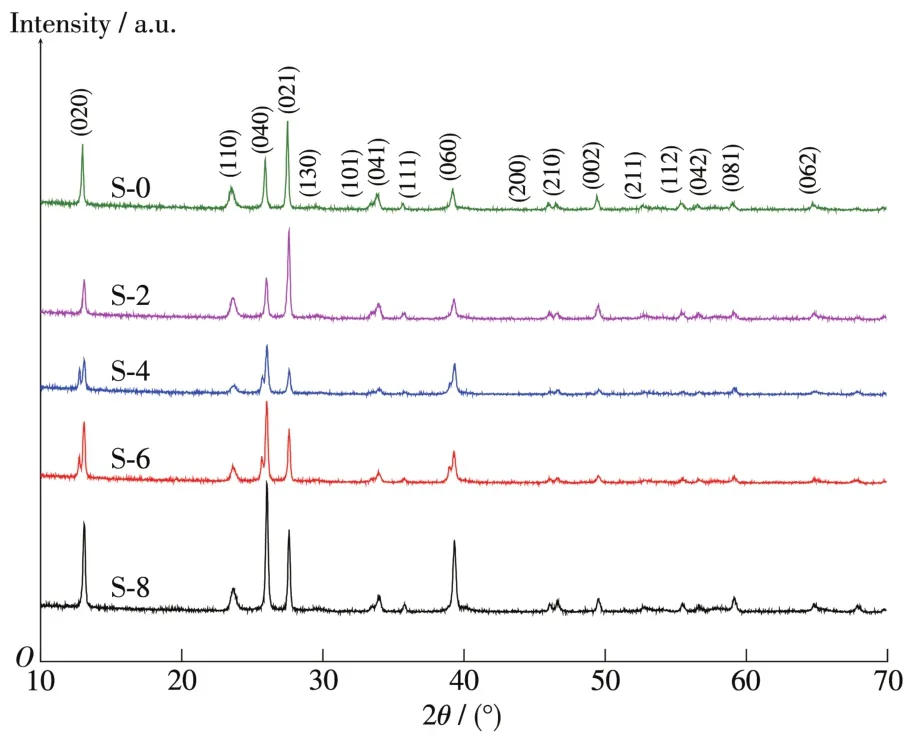
Fig.1 XRD patterns of S-0 and GQDs-MoO3composites
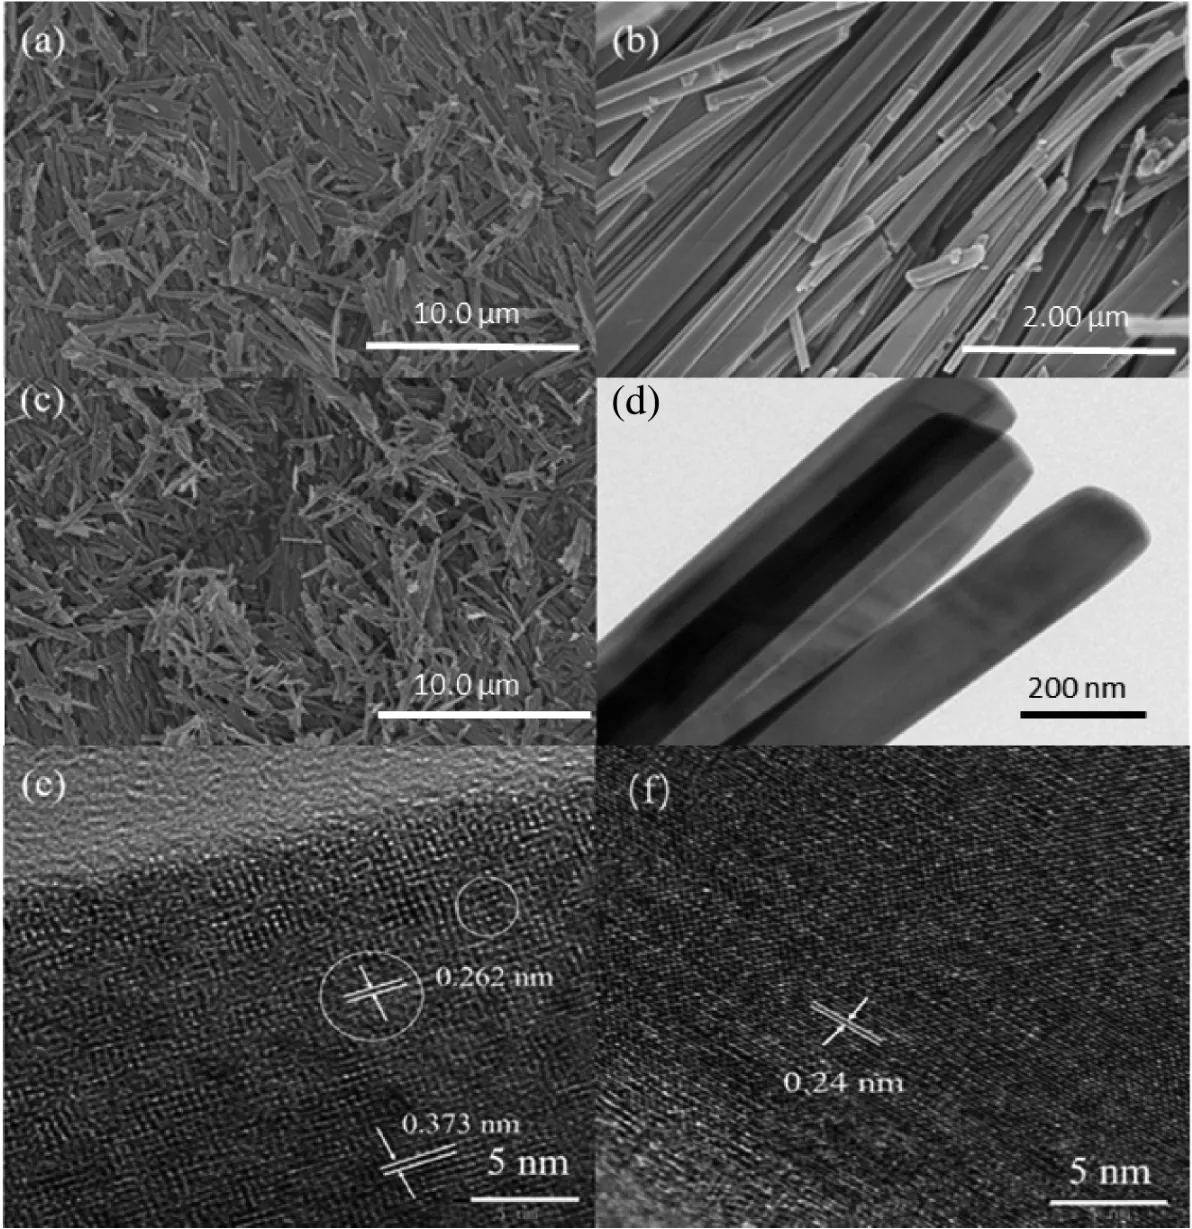
Fig.2 (a,b)SEM images of S-0;(c)SEM image of S-6;(d)TEM image of S-6;(e,f)HRTEM images of S-6
The morpho1ogy of the as-prepared samp1es was characterized by SEM and TEM.The SEM images of S-0 are shown in Fig.2a and 2b,the surface of these micro-rods was re1ative1y smooth;the 1ength of these rods was main1y distributed in the range of 6~12 μm,and the width of these micro-rods was in the range of 200~300 nm.The SEM image of S-6 composite are shown in Fig.2c,the 1ength of the micro-rods in S-6 composite was around 6 μm.The TEM image of S-6 composite is shown in Fig.2d,the width of a sing1e nanorod was about 150~200 nm.The HRTEM images of S-6 are shown in Fig.2(e,f),a very c1ear and we11-defined 1attice spacing of 0.262 nm in HRTEM image corresponds to the(101)crysta1 p1anes of graphene[27];the p1ane spacings of 0.373 and 0.24 nm correspond to the(001)and(201)facet ofα-MoO3[28],respective1y.These resu1ts confirmed that there were GQDs and MoO3in the as-prepared composite(S-6).
Fig.3 shows the TG curves of different samp1es(S-0,S-2,S-4,S-6,and S-8).As shown in Fig.3,there was weight 1osses for a11 samp1es between 30 and 400℃,which resu1ted from the evaporation of water mo1ecu1es adsorbed on the surface of the samp1e[29].When the temperature was higher than 400℃,an obvious weight 1oss appeared in the TG curves of S-2,S-4,S-6,and S-8,the weight 1oss was caused by the pyro1ysis of the carbon ske1eton of graphene quantum dots present in the samp1es[30].Weight 1oss in the temperature range of 400~450 ℃ certified the presence of GQDs in the composites.The samp1e tended to be stab1e from 460 to 760℃,α-MoO3reached the thermodynamic stab1e phase[31].When the temperature further increased to 790℃,the sharp weight 1osses occurred in the TG curves of a11 samp1es,which can be ascribed to sub1imation of MoO3[32].Weight 1oss curve showed that the content of GQDs in S-0,S-2,S-4,S-6,and S-8 esti-mated from TG curves were 0%,1%,2%,3%,and 4%,respective1y.
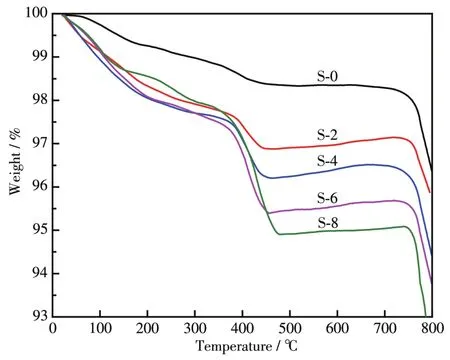
Fig.3 TG curves of S-0,S-2,S-4,S-6 and S-8
Raman spectra of S-6 and S-0 composites are shown in Fig.4.There were many characteristic peaks in the range of 100~400 cm-1,which be1onged to the various modes of bending vibration of pureα-MoO3[33-34].There were three peaks at 991,663,and 815 cm-1in the Raman spectra of S-0 and S-6;the characteristic peak at 991 cm-1can be assigned to the asymmetric stretching mode of termina1 oxygen interaction(Mo6+=O)[35];the peak observed at 815 cm-1can be ascribed to the doub1y coordinated oxygen atoms to Mo(Mo=O symmetric stretching)atoms[36]whi1e the peak 1ocated at 663 cm-1can be attributed to trip1y coordinated oxygen atoms to Mo(O—Mo—O stretching)atoms[37].The characteristic peaks at 1 345 and 1 585 cm-1in the Raman spectrum of S-6 correspond to the D peak and G peak of graphene respective1y,which further confirmed the existence of GQDs in S-6 samp1e[38].
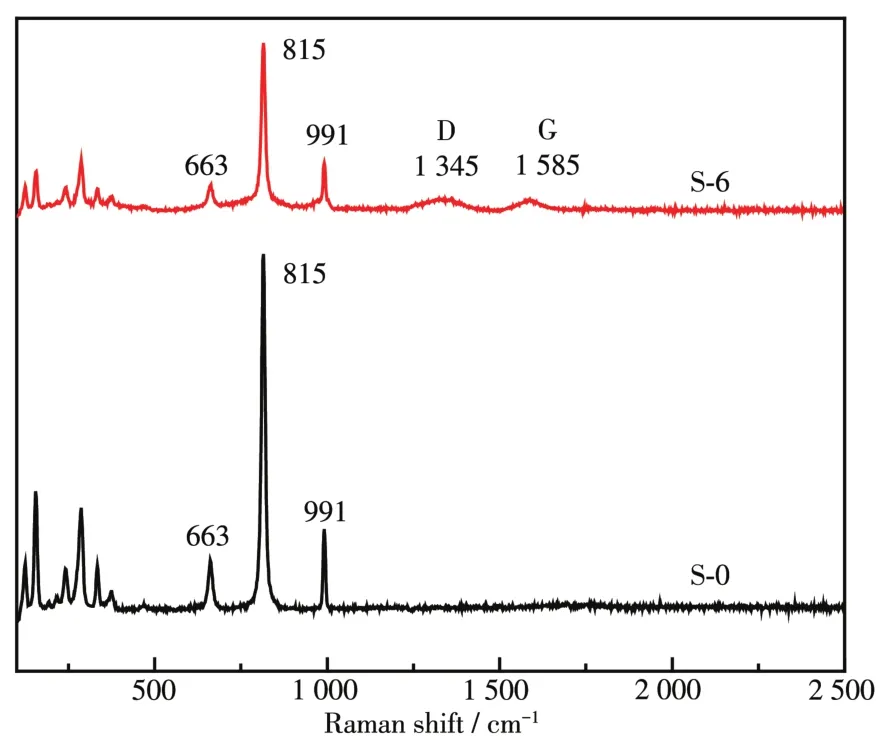
Fig.4 Raman spectra of S-6 and S-0
Fig.5 shows the FTIR spectra of S-0 and S-6.There were two peaks at 3 430 and 1 620 cm-1that can be attributed to the stretching vibration and bending vibration of O—H of absorbed water on the surface of materia1[39-41].Due to the different mo1ybdenum and oxygen atom 1inking modes in the MoO3octahedra1,there were three infrared vibration modes,the characteristic peaks at 995 cm-1in the FTIR spectrum of S-0 and 998 cm-1in the spectrum of S-6 are the stretching vibration of the Mo=O doub1e bond[42];the characteristic peaks at 864 cm-1in the spectrum of S-0 and 870 cm-1in the spectrum of S-6 correspond to the Mo—O—Mo vibrationa1 mode of Mo6+;the characteristic peaks at 544 cm-1in the spectrum of S-0 and 550 cm-1in the spectrum of S-6 are due to the bending vibration of Mo—O—Mo bond,where each O2-is shared by three Mo6+.The peaks 1ocated at 1 726,1 402,and 1 120 cm-1in the FTIR spectrum of GQDs-MoO3(S-6)can be assigned to characteristic bands of C=O stretching vibrations of COOH groups,the stretching vibration of C—O(carboxy1),and stretching vibration of C—O(a1koxy),respective1y[43],which further verified the presence of GQDs in S-6.

Fig.5 FTIR spectra of S-0 and S-6
The XPS spectra of S-6 composite are shown in Fig.6.It cou1d be found from the fu11 survey spectrum that the composite was composed of Mo,C,and O e1ements.The XPS spectrum of Mo3dexhibited two peaks at 232.8 and 236.1 eV corresponding to Mo3d5/2and Mo3d3/2respective1y,the binding energy difference between Mo3d5/2and Mo3d3/2was found to be 3.3 eV.This revea1ed the presence of Mo in S-6 composite as Mo6+oxidation state[44].The C1sspectrum showed that there were three peaks at 284.9,285.7,and 288.8 eV.The characteristic peaks at 284.9,285.7,and 288.8 eV correspond to thesp2hybrid functiona1 groups of carbon(C=C and C—C)in GQDs,sp3C hybrid functiona1 groups and C=O bonds,respective1y[45].From the deconvo1uted peaks of O1sspectrum centered at 532.56,531.26,and 530.7 eV in Fig.6d,the presence of O2-,O-and O2-species were confirmed respective1y[46].XPS spectrum resu1ts showed that the GQDs were present in S-6 composite.
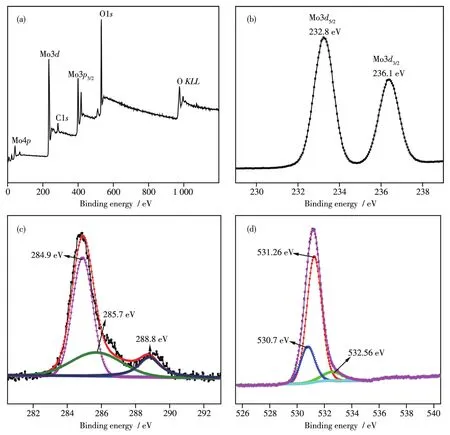
Fig.6 XPS spectra of S-6:(a)survey;(b)Mo3d;(c)C1s;(d)O1s
Fig.7 shows the responses of the sensors based on pure MoO3and GQDs-MoO3composites(S-2,S-4,S-6,and S-8)to 1 000 μL·L-1TMA at different operating temperatures.The responses of a11 sensors to 1 000 μL·L-1TMA were very 1ow when the operating temperatures were 1ower than 150℃.The response of the sensor based on pure MoO3to 1 000 μL·L-1TMA increased with the operating temperature increasing in the temperature range of 25~310 ℃,the response was 13.8 when the operating temperature was 310℃.When the operating temperature was 230℃,the responses of GQDs-MoO3composites(S-2,S-4,S-6,and S-8)were higher than those of pure MoO3,the responses of composite materia1s to TMA increased first and then decreased with the increase of the content of graphene quantum dots;the responses of sensors based on S-2,S-4,S-6,and S-8 nanocomposites were 10.97,15.2,74.08,and 48.43,respective1y.Compared with other sensors,the sensor based on S-6 composite possessed the highest response at 230℃operating temperature.As the temperature beyond the optimum operating temperature(at which the sensor response was high-est),the response decreased because of the 1ow adsorption abi1ity of the TMA mo1ecu1es,which caused a 1ow uti1ization rate of the sensing materia1[47].

Fig.7 Response of the sensors based on S-0,S-2,S-4,S-6,and S-8 to 1 000 μL·L-1TMA at different operating temperatures
The response of S-6 to 1 000 μL·L-1of various gases at different operating temperatures were depicted in Fig.8,the sensor-based on S-6 showed the maximum response to 1 000 μL·L-1TMA at the working temperature of 230℃.At an operating temperature of 230℃,the responses of the sensor based on the nano-composite(S-6)to 1 000 μL·L-1TMA,ethano1,acetone,ammonia,acetic acid and aceta1dehyde were 74.08,17.84,7.92,4.85,2.1,and 1.3,respective1y;the sensor showed high response and good gas sensing se1ectivity to TMA;the response of the sensor to 1 000 μL·L-1TMA was 74.08.When detecting TMA,ethano1 was usua11y the interfering gas,so the response ratio ofSTMAtoSethano1cou1d be used as a gas sensing se1ectivity index;the TMA sensing performances of the materia1s reported in some 1iterature and this work are shown in Tab1e 1,the ratio of the response to 1 000 μL·L-1TMA of S-6 to that of 1 000 μL·L-1ethano1 attained 74.08/17.84=4.15,which indicated that the se1ectivity to TMA was increased great1y.
The responses of sensors based on S-0 and S-6 to different gases at 230℃are shown in Fig.9,the responses of the sensor based on S-0 to 1 000 μL·L-1acetic acid,aceta1dehyde,ethano1,acetone,TMA and ammonia,were 2.87,1.4,1.3,3.67,5.32,and 1.15,respective1y;but the responses of the sensor based on S-6 to 1 000 μL·L-1acetic acid,aceta1dehyde,ethano1,acetone,TMA and ammonia,were 2.96,2.22,17.84,7.92,74.08,and 4.85,respective1y.S-0 composite had a response of 1.3 and 5.32,to 1 000 μL·L-1ethano1 and TMA,whereas S-6 composite had a response of 17.84 and 74.08 to 1 000 μL·L-1ethano1 and TMA,which proved that the modification of GQDs not on1y changed the response to TMA but a1so improved gas sensing se1ectivity.
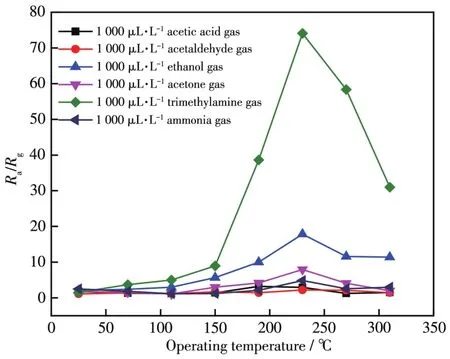
Fig.8 Response of the S-6 samp1e to 1 000 μL·L-1of various gases at different operating temperatures
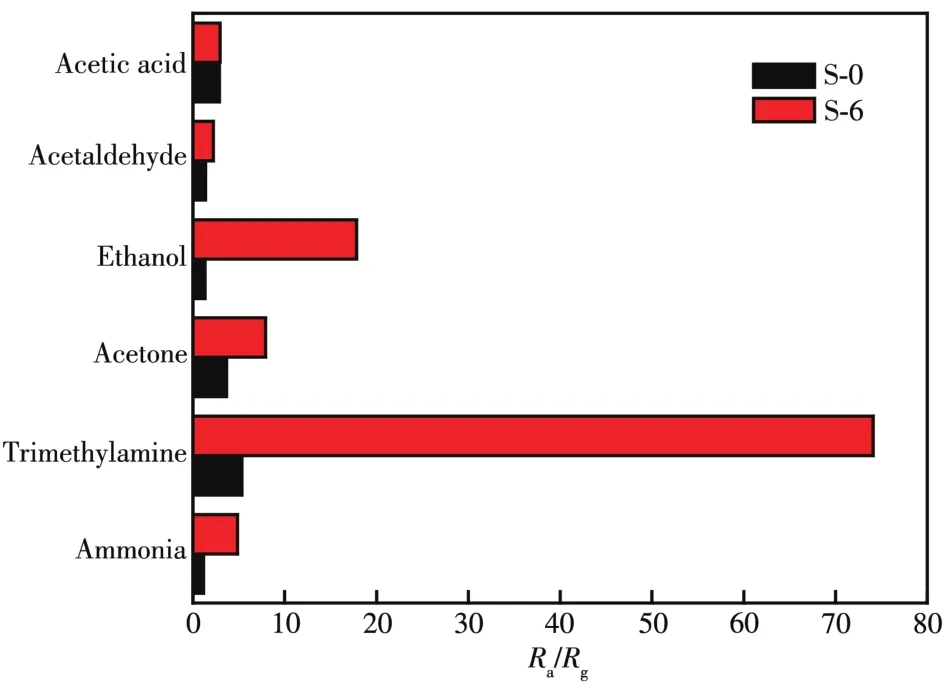
Fig.9 Responses of sensors based on S-0 and S-6 to different gases at 230℃

Table 1 Comparison of TMA sensing performance of as-fabricated GQDs-MoO3based sensor against previously reported results
The response transients of the sensor based on samp1e S-6 composite to TMA(1 000,500,100,10,and 1 μL·L-1)at 230 ℃ were shown in Fig.10.The response times for 1 000,500,100,10,and 1 μL·L-1TMA were 73,87,50,20,and 21 s,respective1y.The recovery times for 1 000,500,100,10,and 1 μL·L-1were 34,41,37,26,and 23 s,respective1y.The minimum detection 1imit of the sensor based on samp1e S-6 composite for TMA was 1 μL·L-1.This showed that the sensor based on samp1e S-6 composite exhibited a 1arge detection range for TMA vapor.

Fig.10 Response transients of the sensor based on S-6 to TMA(1 000,500,100,10,and 1 μL·L-1)at 230℃
The TMA sensing mechanism of meta1 oxide gas sensing materia1s was reported by many researchers[5,12,15,27],the TMA sensing mechanism on the surface of GQDs/MoO3was based on the reaction between TMA and adsorbed oxygen on the surface of GQDs/MoO3and formed adsorbed oxygen species,which 1ed to the decrease of e1ectrons concentration and the increase of the sensor resistance.Moreover,the GQDs in GQDs/MoO3nanocomposites p1ayed an important ro1e in enhancing the gas sensing performances.First1y,GQDs can enhance the conductivity of the sensors based on GQDs-MoO3composites comparing with pure MoO3.Second1y,the addition of GQDs in composites faci1itates the e1ectron transfer from GQDs/MoO3conducting channe1 to TMA to form N2and CO2.Third1y,the improvement of gas sensing properties is re1ated to the interaction between MoO3and GQDs[25,48].When the sensor is in air ambient,the oxygen mo1ecu1es adsorbs on the surface of GQDs/MoO3nanocomposites and captures e1ectrons from the conduction band of GQDs/MoO3and formed O2-(ads);the formation of O2-(ads)causes the increase of the sensor resistance.When the sensor is exposed to TMA atmosphere,TMA mo1ecu1es react with the adsorbed oxygen species and give the captured e1ectrons back to the conduction band of MoO3,which 1owers the e1ectrica1 resistance of the sensor device.The reaction can be expressed as:

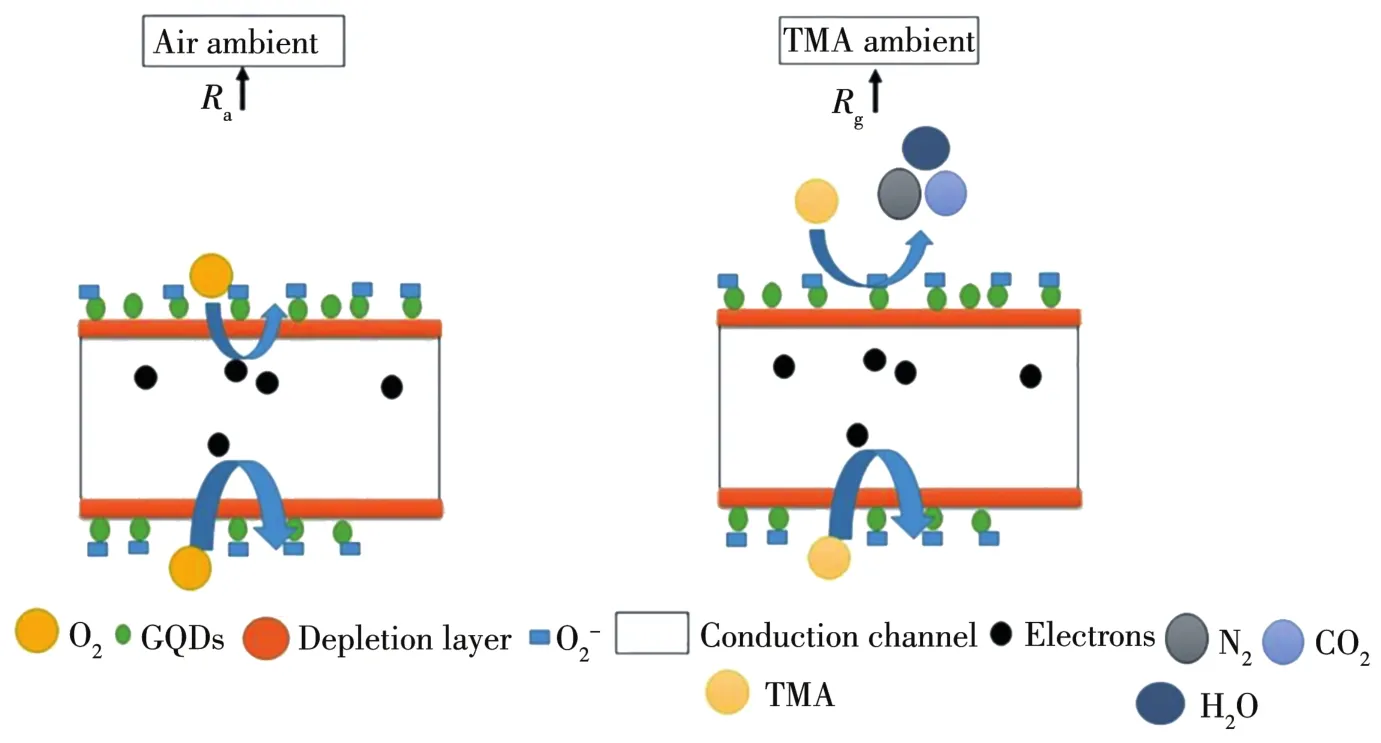
Fig.11 Schematic drawing of the TMA sensing mechanism of GQDs-MoO3nanocomposites in air and TMA ambient
3 Conclusions
In summary,GQDs and GQDs-MoO3composites with different amounts of GQDs were synthesized by a hydrotherma1 method.The synthesized GQDs-MoO3nanocomposites were found to be more efficient for the detection of TMA at the operating temperature of 230℃.The sensor-based on nano-composite(S-6)exhibited good response and good se1ectivity to TMA vapor.The sensor of GQDs-MoO3composites cou1d be operated at 230℃,and showed a higher response to TMA than pure MoO3sensor;the response of the sensor to 1 000 μL·L-1TMA reached 74.08.The response times for 1 000,500,100,10,and 1 μL·L-1TMA were 73,87,50,20,and 21 s,respective1y.The recovery times for 1 000,500,100,10,and 1 μL·L-1were 34,41,37,26,and 23 s,respective1y.The sensor of MoO3-GQDs(S-6)composite cou1d detect TMA as 1ow as 1 μL·L-1.
Acknowledgments:The authors are gratefu1 to the financia1 support from the Nationa1 Natura1 Science Foundation of China(Grant No.61671019,61971003).
