Compressive imaging based on multi-scale modulation and reconstruction in spatial frequency domain*
2021-01-21FanLiu刘璠XueFengLiu刘雪峰RuoMingLan蓝若明XuRiYao姚旭日ShenChengDou窦申成XiaoQingWang王小庆andGuangJieZhai翟光杰
Fan Liu(刘璠), Xue-Feng Liu(刘雪峰),†, Ruo-Ming Lan(蓝若明), Xu-Ri Yao(姚旭日),Shen-Cheng Dou(窦申成), Xiao-Qing Wang(王小庆), and Guang-Jie Zhai(翟光杰)
1Key Laboratory of Electronics and Information Technology for Space Systems,National Space Science Center,Chinese Academy of Sciences,Beijing 100190,China
2School of Physics and Electronics,Shandong Normal University,Ji’nan 250014,China
3University of Chinese Academy of Sciences,Beijing 100049,China
Keywords: compressed sensing,imaging quality,spatial frequency domain,multi-scale modulation
1. Introduction
Compressed sensing (CS)-based optical imaging has attracted significant interests in recent years. The CS theory is a new sampling theorem proposed by Donoho, Tao, and Cand`es,[1,2]which breaks the Nyquist sampling theorem,with sub-sampling in the signal measurement.A great benefit of CS to imaging is single-pixel imaging feasibility, with the image spatially modulated and then measured by a point detector.[3]After several modulations and measurements,the image is reconstructed based on a CS algorithm using the modulation matrix and point-detection results. Since CS imaging dramatically lowers the array detector requirement, it is already widely applied in many areas such as imaging spectrum,[4,5]3D Lidar,[6,7]Terahertz,[8]and biological imaging.[9]
A practical problem for CS imaging, however, is the imaging quality. Since the image is obtained by postprocessing of the CS algorithm rather than direct measurement, a reconstruction error is introduced. Although the CS theorem mathematically proves that the signal is accurately recovered under restricted conditions,[10]achieving CS imaging with identical quality as traditional imaging is difficult in practice. Many approaches to resolve this problem exist,with optimizing the measurement matrix design among the most important. The CS theorem requires the measurement matrix to satisfy the restricted isometry property (RIP),[10,11]which implies uncorrelation of the measurement matrix and sparse representation basis. At first,the Gaussian random matrix and the binary random matrix were often employed as measurement matrix to satisfy the RIP criterion. However, the general random matrix was later realized to involve limitations.Through proper design of statistical properties of the measurement matrix, the CS imaging quality can be improved.Therefore, the Optimized Hadamard matrix, Fourier matrix,and other structured matrices were advanced to replace the Gaussian random measurement matrix.[12–15]Besides, Yu et al. derived a complementary modulation matrix that improved the quality of CS telescope imaging.[16]Czajkowski et al. designed the sampling functions by convolving Morlet wavelets with white Gaussian noise.[17]
The measurement matrix resolution is also related to the CS imaging quality. The CS imaging involves only a point detector, with the imaging resolution actually provided by spatial modulation. Therefore, in a general situation, high spatial resolution modulation is preferred to increase the imaging resolution. However, some studies reveal a trade-off between imaging resolution and reconstruction quality.[18,19]For a fixed scene, finer spatial modulation means more pixels are needed for reconstruction. In CS imaging using light intensities measured through analog-to-digital conversion, a high imaging pixel number amplifies quantization noise and decreases the imaging quality, and in photon-counting region the increase of pixel size has the similar influence. Therefore, some previous studies considered measurement matrix with different spatial frequencies.[20–22]For instance, Fourier single-pixel imaging method[23,24]is equivalent to use a lowpass spatial filter to measure the low frequency part of the image, and in Hadamard single-pixel imaging,[24]the blocks of different sizes in matrix correspond to measurement with different spatial resolutions. However, these methods tend to collect low frequency information if sub-sampling is needed,which means the highest resolution cannot be achieved. The matrix in adaptive CS imaging can be optimized to have varying resolutions in different positions according to the target features,[25]but it requires different spatial frequency components to be separated in space, which may not be applicable to many real scenes. Overall, there is no multi-scale design which can achieve global highest resolution with subsampling.
In this study, we examine the relationship between the measurement matrix resolution and reconstruction qualities of different image spatial frequencies. We also improve the design of the complementary matrix to achieve multi-scale modulation in the spatial frequency domain. Further, an improved reconstruction method is proposed for image reconstruction for different spatial frequency components. Through the multi-scale reconstruction, the imaging quality is effectively improved compared to traditional single-scale CS imaging,with global highest resolution guaranteed.
The remainder of this paper is organized as follows: Section 2 contains information on how the resolution of the measurement matrix affects the quality of the CS imaging. In Section 3,the multi-scale measurement matrix design and reconstruction method are proposed and results from numerical simulations are presented. In Section 4, an experimental system set to demonstrate the effect of multi-scale CS imaging is reported,while the main conclusions of the study are summarized in Section 5.
2. Relationship between measurement matrix resolution and CS imaging quality
Basic CS imaging can be described through the simple relationship expressed as

where x is the target,Φ is the measurement matrix with each row representing a spatial modulation of the target x, and y is a column matrix denoting the measurement results. After sub-sampling,the original signal x is recovered by solving the equation according to the measurement result y and measurement matrix Φ.
In the traditional CS imaging,a measurement matrix of 1-pixel resolution is employed to guarantee the imaging resolution.However,in the present research,we design the measurement matrices with different resolutions(e.g.,n=1–4 pixels)and investigate their effects on the imaging quality through the numerical simulations. A matrix resolution of n pixels means that in each spatial modulation,the matrix is divided into several n×n blocks,and the values in each block are identical.To enhance the modulation randomness,the block division has a random starting point in the matrix. Several examples of measurement matrices with 2-pixel resolution are shown in the following Fig.1.
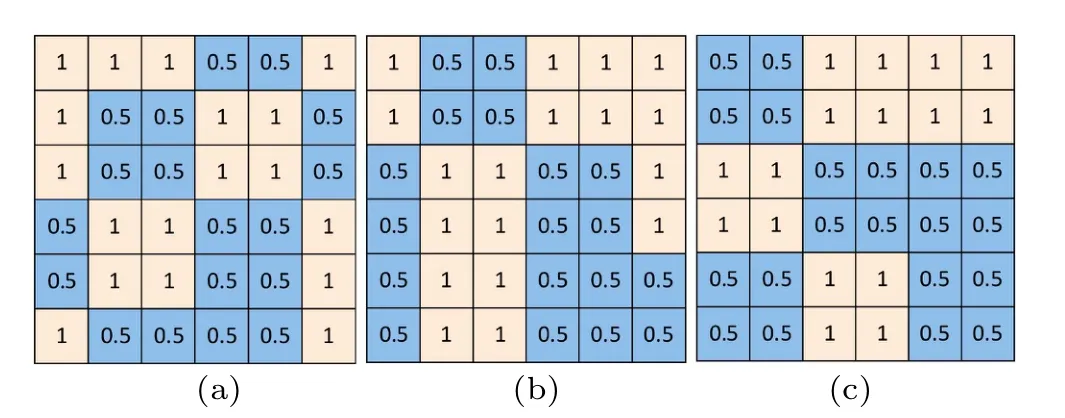
Fig. 1. Examples of measurement matrices with 2-pixel resolution. The initial positions of the 2×2 blocks in panels(a),(b),and(c)are different.

The imaging results for measurement matrices of different resolutions are shown in Fig.2. Rather than simply calculating the quality of the entire reconstructed image as in traditional CS imaging, the imaging quality is considered in the spatial frequency domain. Figure 3 shows the image divided into four spatial frequencies by extracting different regions of the Fourier spectrum. The terms Fre 1 to Fre 4 represent the highest to lowest spatial frequency parts, the boundaries of which are determined as follows. If the width of a 1-pixel point is broadened to n pixels after low-pass filters with the cutoff frequency of fn, then fnis the boundary of Fre n and Fre (n-1). By this means, the terms Fre 1 to Fre 4 corresponding to images with resolutions of 1–2 pixels,2–3 pixels,3–4 pixels, and >4 pixels. The reconstructed errors for the spatial frequencies are presented in Table 1. The maximum of the original image has been normalized to 1, so the RMSEs can be expressed as percentages.

Fig.2. Imaging results involving measurement matrices of different resolutions. The measurement matrix resolutions for panels(a)–(d)are 1,2,3,and 4 pixels,respectively.

Fig.3.The reconstructed image is divided into 4 spatial frequencies through Fourier transform.The terms Fre 1 to Fre 4 are in the order of high frequency to low frequency.

Table 1. Reconstructed errors of different spatial frequencies.
From the simulation results, the 1-pixel resolution measurement matrix allows adequate reconstruction of the high frequency component but exhibits relatively poor quality in the low frequency component. In contrast, decreasing the measurement matrix resolution is beneficial for proper reconstruction of the low frequency image. Precisely, the spatial frequency Fre n is best reconstructed when the measurement matrix resolution is n pixel.This observation differs from conventional understanding of measurement matrix design,as the single-scale matrix cannot ensure the images have the best reconstruction qualities in both low and high frequencies.
The regularization revealed by the simulation is further explained below. First, the 1-pixel resolution modulation is obviously necessary for the reconstruction of a high spatial frequency image. Second, when the low spatial frequency component of the image is reconstructed, the effective pixels are lower than in the original image. For example, for a 2-pixel resolution 256×256 image,the effective pixels recovered are 128×128 pixels. Therefore, a low-resolution measurement matrix is applicable for reconstructing a low spatial frequency image at a higher sampling rate compared with the high-resolution matrix. Specifically,the n-pixel measurement matrix achieves the highest sampling rate,with enough imaging resolution in reconstructing an n-pixel resolution image.We notice that the advantage of 1-pixel matrix in high frequency reconstruction is not particular obvious.That is mainly because the Lenna image is heavily represented by lower frequency coefficients and the high frequency information is relative less.
3. Multi-scale modulation and reconstructionbased CS imaging
3.1. Multi-scale measurement matrix design
In this study,we improve the measurement matrix design based on complementary compressed imaging,to increase the CS imaging quality. The complementary compressed imaging model can be expressed as

Let y=y1-y2,Φ=Φ1-Φ2,and e=e1-e2,equation(4)can be written using the typical compressed sampling formula y =Φx+e. The measurement matrix is changed from the 0–1 binary matrix to the±1 binary matrix with mean of 0 to satisfy the RIP criterion.
A problem with the traditional complementary CS imaging is that the final measurement matrix is the single-scale 1-pixel resolution matrix. This is only suitable for reconstructing the high frequency image but not the low frequency component according to the regularization mentioned in Section 2. Here, we improve this by designing a multi-scale measurement matrix suitable for simultaneous high-and lowresolution modulations. We initially constructed a 2-pixel resolution p–q random binary matrix A2with identical values in each 2×2 area.Without loss of generality,we selected p=0.5 and q=1 in our study as displayed in Fig. 4, with the initial positions of the 2×2 blocks remaining random as in Fig. 1.Then, A2was split into complementary matrices B1and B2that obeyed the 0–p or 0–q Bernoulli distribution in every 2×2 area. Repeating this process with n random matrices A2produced n pairs of matrices B1and B2.
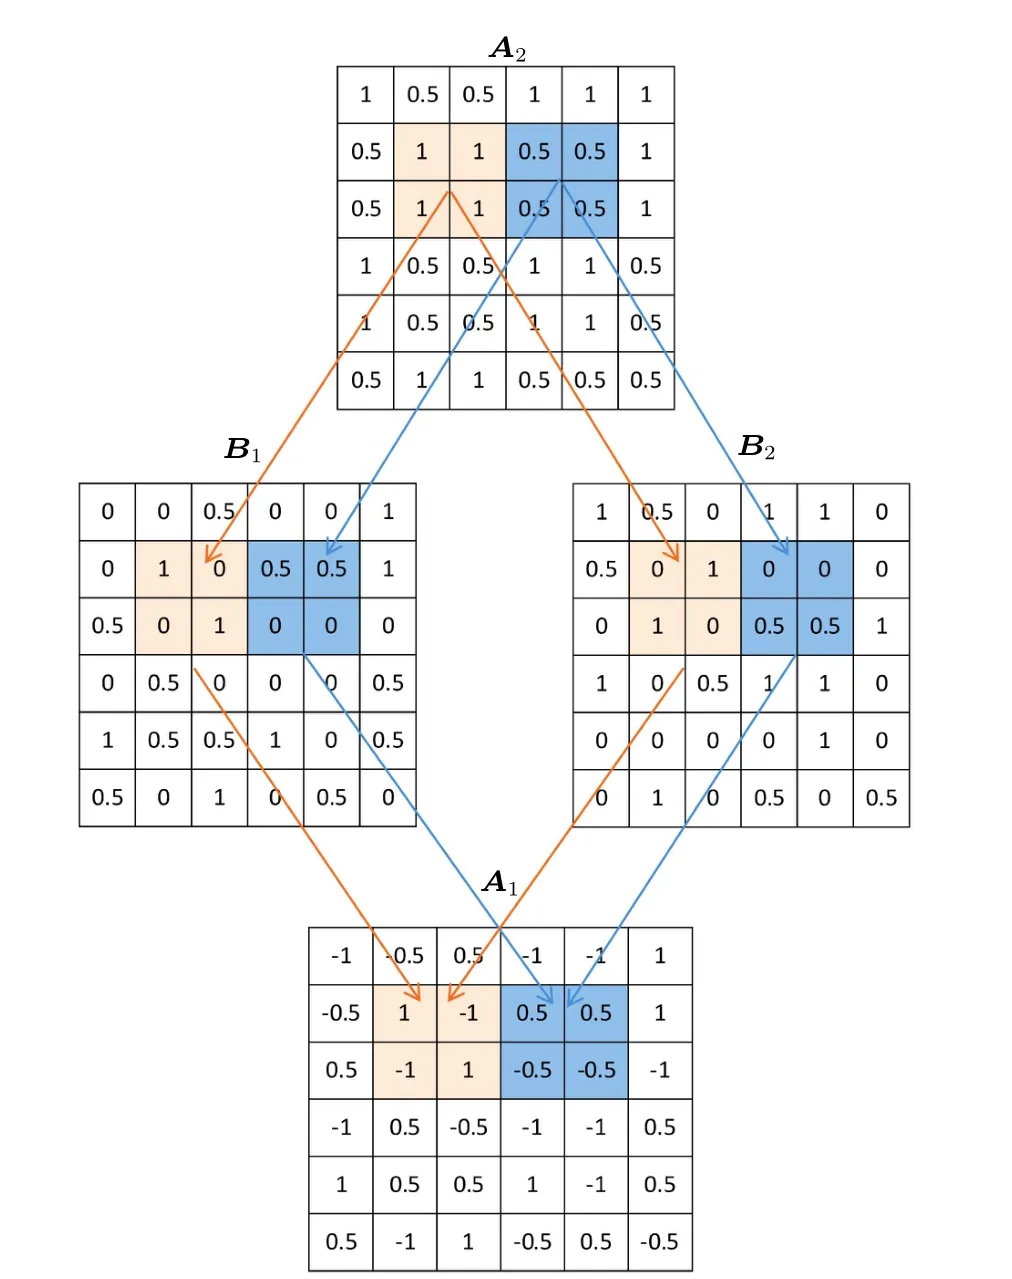
Fig.4. Design of multi-scale matrices A1 and A2 representing 1-pixel and 2-pixel resolutions,respectively,which are realized by summation and subtraction of complementary matrix pairs B1 and B2.

This means that the 1-pixel and 2-pixel resolution measurements are achieved concurrently. Finally,we used the 1-pixel and 2-pixel resolution matrices to reconstruct the target and obtained two values ˆx1and ˆx2, respectively. According to Section 2,the high frequency reconstruction quality is better in ˆx1,while ˆx2shows higher quality in the low frequency reconstruction.By extracting and superimposing the high frequency component from the 1-pixel matrix reconstruction result ˆx1and low frequency component from the 2-pixel matrix reconstruction result ˆx2, a new image reconstruction is obtained,with overall quality better than ˆx1and ˆx2.
Different from traditional complementary single-pixel CS imaging using matrices which are complementary in the entire region,the matrices in the multi-scale modulation are complementary only in each 2×2 region. Therefore,a grayscale matrix can be obtained by adding the complementary matrix pair.On the contrary,the addition of traditional complementary matrices can only generate an all 1s matrix which provides little information for the reconstruction. In fact, in the traditional complementary CS imaging,2k times sampling is needed for the measurement matrices B1and B2,with the final effective sampling number only k times. Obviously, some information on the 2k times measurements is wasted. Through the multiscale matrix design, both the addition and subtraction of the k pairs measurements contribute to the image reconstruction,and the information of complementary modulations is fully utilized.
3.2. Numerical simulations of multi-scale reconstructionbased CS imaging
In the simulations, we used the images sized 256×256,measuring the images using the multi-scale matrices designed in Section 3.1.Then,the entire image was reconstructed based on Eqs. (6a) and (6b). The sampling rate for each image is 25%.
The original 256×256 sized images are displayed in Figs. 5(a)–5(c), while the reconstruction results with the 1-pixel resolution measurement matrix according to Eq. (6a)are exhibited in Figs. 5(d)–5(f). Also, the reconstruction results for the 2-pixel resolution measurement matrix according to Eq. (6b) are displayed in Figs. 5(g)–5(i). Finally, the multi-scale reconstruction images are shown in Figs. 5(j)–5(l). The red regions in the images contain abundant lowfrequency components,and these are reconstructed better with the 2-pixel resolution matrix. The blue regions represent more high spatial frequency components,which exhibit better quality with the 1-pixel resolution matrix.
The RMSEs of the reconstructed images for different spatial frequency components are presented in Table 2. The effects of the multi-scale reconstruction on different targets look similar, coinciding with our theoretical analysis. Clearly, the images reconstructed by the 1-pixel matrix produce lower RMSEs than those reconstructed by the 2-pixel matrix at high frequency, whereas images reconstructed by the 2-pixel matrix show lower RMSEs in the low frequency components. By extracting and superimposing the high and low spatial frequency components,the RMSE of multi-scale reconstructed image is lower than those from single-scale reconstruction for the 1-pixel and 2-pixel resolutions.
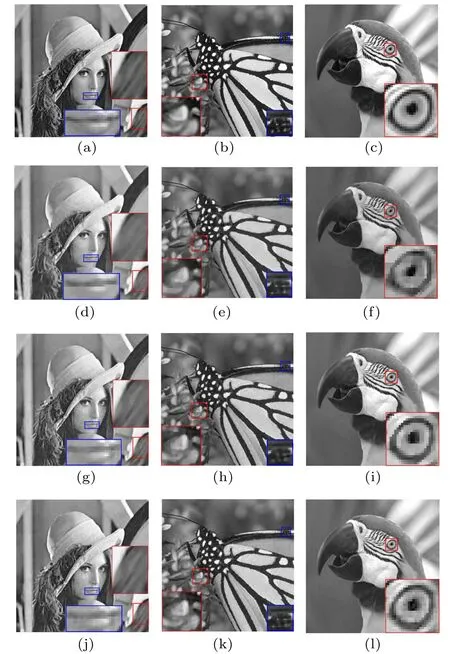
Fig. 5. Simulation results using the proposed method for (a)–(c) original images;(d)–(f)images reconstructed by the 1-pixel resolution measurement matrix;(g)–(i)images reconstructed by the 2-pixel resolution measurement matrix;and(j)–(l)multi-scale reconstruction images.

Table 2. Reconstructed errors of different spatial frequencies with singlescale and multi-scale reconstruction.
4. Experiment results
The CS imaging setup we built based on a digital micromirror device(DMD)to confirm the practical impact of our proposed multi-scale reconstruction is depicted in Fig. 6. To quantitatively evaluate the imaging quality,a digital target instead of a real target is employed to accurately retain the original image. The light source is a halogen lamp and the DMD contains 1024×768 micromirrors, with each mirror of size 13.68 μm×13.68 μm. Each micromirror can be modulated to alter its flip angle separately,reflecting light in different directions to achieve spatial modulation of the light intensity.In the experiment,we used 2×2 micromirrors as a unit to modulate a pixel of the image,so the actual size of the modulation pixel is 27.36 μm×27.36 μm. The DMD flips according to the dot multiplication of the measurement matrix and digital target,equivalent to that the target is imaged on the DMD and then modulated by the measurement matrix. The reflected light is collected by a charge-coupled device (CCD) via a collecting lens L1. However, the CCD is only used as a bucket, that is,as a point detector, as the gray values of every pixels in each sampling are added to obtain the total light intensity of once measurement. The original image sized 64×64 utilized in the experiment is shown in Fig. 7(a). The lines at the bottom of the image involve width and separation of 1 pixel, which can emerge as high spatial frequency targets. In the top of the image, lines with width and separation of 2 pixels are present,and display more low spatial frequency components.

Fig. 6. Experimental setup for verification of multi-scale CS imaging. The dot multiplication of the measurement matrix and digital target is loaded on the DMD to realize imaging of a virtual digital target.
In the experiment,we used 1000 pairs of complementary measurement matrices with the sampling rate of 25%. The image reconstructed by the 1-pixel resolution matrix is shown in Fig.7(b),while that reconstructed by the 2-pixel resolution matrix is displayed in Fig. 7(c), and the superimposed multiscale reconstructed image is exhibited in Fig. 7(d). Here, we use“1-pixel reconstruction”for the image reconstructed by 1-pixel measurement matrix, and 2-pixel reconstruction means the image reconstructed by 2-pixel matrix.
From the experimental results of the 2-pixel measurement matrix, the 1-pixel line is indistinguishable, so obviously the reconstruction quality is poor. However, the reconstructed 2-pixel lines and Tai Chi are smoother, with less noise compared with the 1-pixel reconstruction result. This is because the 1-pixel lines represent almost pure high frequency information, while the 2-pixel lines and Tai Chi contain abundant low frequency components. Although the 1-pixel matrix provides enough resolution for distinguishing the 1-pixel and 2-pixel lines, the overall imaging quality is unsatisfactory. By combining the high frequency component of the 1-pixel reconstruction with the low frequency component of the 2-pixel reconstruction,the image with the best reconstruction quality for high and low spatial frequencies is obtained.

Fig. 7. Experimental results involving 1000 pairs of complementary measurements for(a)original image;(b)image reconstructed by the 1-pixel matrix; (c) image reconstructed by the 2-pixel matrix; and (d) superimposed multi-scale image.
For objective evaluation,data for the RMSEs for images in Fig. 7 are presented in Table 3. The RMSE of the high frequency component in the 1-pixel reconstruction is 11.09%,while that for the 2-pixel reconstruction is 14.59%. In the low frequency component, the RMSE of the 2-pixel component is 6.45%,which is much lower than the RMSE of the 1-pixel reconstruction. These results are consistent with expectations. The total RMSE of the multi-scale reconstruction is only 12.82%,which is dramatically improved compared with that for the traditional complementary CS imaging based on the 1-pixel reconstruction(15.75%).
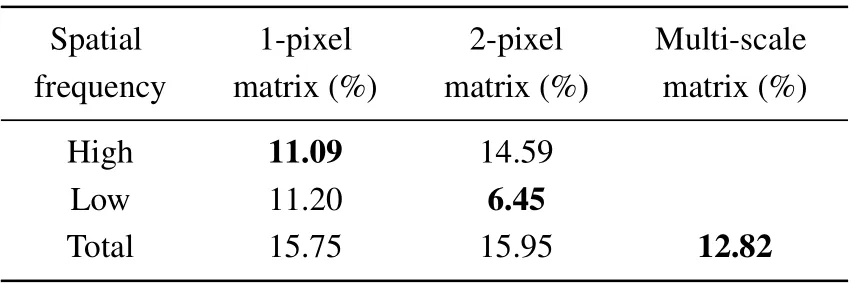
Table 3. Reconstruction RMSEs of the experimental results.
Furthermore,we compared the traditional single-scale CS imaging with multi-scale CS imaging under different sampling rates,with the reconstruction results presented in Table 4. The sampling rate is calculated according to the pair number of the complementary matrix,same as in traditional complementary CS imaging. The data reveals that our method is more effective at a low sampling rate. When the sampling rate η is 15%to 25%,the RMSEs of the low frequency component for the 2-pixel reconstruction changes from 8.88%to 6.45%,and is onsistently lower than those for the 1-pixel reconstruction.When η increases to 50%,the RMSEs of the 2-pixel reconstruction in the low frequency component decreases slowly from 6.45%to 5.66%, but the RMSEs of the 1-pixel reconstruction decrease significantly from 11.20% to 2.41%, becoming lower than those for the 2-pixel reconstruction. This is mainly because the 1-pixel measurement matrix already contains enough information for reconstructing all spatial frequency components of the image when the sampling rate increases to a certain degree. Therefore,the advantage displayed by the 2-pixel matrix for restoring the low frequency component is inexistent. When the imaging is performed at a low sampling rate,the information measured by the 1-pixel matrix is not enough,and thus,the 2-pixel matrix exhibits more advantages in lowfrequency reconstruction.

Table 4. RMSEs of the experimental results under different sampling rates.
The relationship between the sampling rate and reconstruction quality in different frequency components using traditional 1-pixel reconstruction,2-pixel reconstruction,and the multi-scale method are displayed in Fig. 8. The reconstruction RMSEs of high- and low- frequency components under different sampling rates are shown in Figs. 8(a) and 8(b), respectively. The reconstruction errors of total images containing both high- and low- frequencies are show in Fig. 8(c).The blue, red, and green curves represent the images reconstructed by 1-pixel resolution measurement matrix, 2-pixel resolution matrix,and multi-scale matrix,respectively.For the reconstruction error of the high frequency component shown in Fig. 8(a), the 2-pixel reconstruction is always higher than that for the 1-pixel,especially when the sampling rate is high.This is easily understood as the 2-pixel matrix cannot provide enough resolution to recover details of 1 pixel. In Fig. 8(b),the advantage of the 2-pixel matrix in restoring the low frequency component is more obvious for the lower sampling rate,whereas as η increases gradually,the 1-pixel reconstruction exhibits a lower RMSE limit than that of the 2-pixel reconstruction. Therefore, the advantages of our multi-scale method differ from those of the traditional single-scale 1-pixel reconstruction, according to the sampling rate. As shown in Fig.8(c),the traditional method is more effective at high sampling rates, while our method is better if the sampling rate is low. For different targets, although the critical sampling rate may vary,the qualitative trend will remain unchanged.
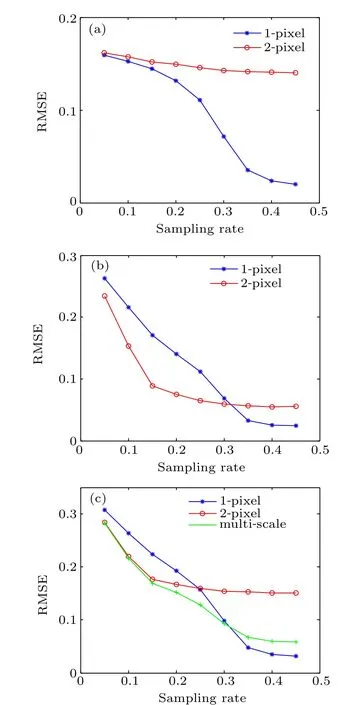
Fig. 8. Relationship between the sampling rate and reconstruction RMSE for (a) the high-frequency component reconstruction; (b) the low-frequency component reconstruction; and (c) the total reconstruction containing both high- and low-frequencies. The blue, red, and green curves represent the measurement matrix of 1-pixel resolution,2-pixel resolution,and multi-scale matrix,respectively.
5. Conclusion
In summary, we developed a new method for CS imaging that involved modulating and reconstructing an image in multi-scale spatial frequencies. We showed that the resolution of the measurement matrix was related to the imaging quality of different spatial frequency components. High-resolution modulation was useful for high frequency reconstruction and vice versa. Based on these results, we designed an improved multi-scale complementary measurement matrix capable of achieving high- and low-resolution modulations simultaneously. Compared with the traditional single-pixel imaging which usually reconstructs an image only in the single scale of one pixel, the multi-scale matrix ensured the best reconstruction qualities for the low- and high-frequency components.The simulations and experiment results proved that the proposed multi-scale reconstruction method effectively decreased the RMSE of the reconstructed image.
Imaging time is a key performance of compressive imaging. To realize multi-scale modulation,the measurement matrix needs to be a grayscale matrix,for example,a three-value matrix in our design. This can be realized by adjusting the residence times of micromirrors in two directions. As in most applications the limited target intensity restricts the modulation rate, the high speed of DMD (up to 20 kHz) is redundant and the grayscale modulation does not actually affect the sampling time. The algorithm for multi-scale reconstruction can be any ones used in traditional CS imaging,so the stability and reconstruction time under different sampling rates are similar to traditional CS imaging. Because the reconstructions need to be performed with 1-pixel and 2-pixel resolution matrices separately in our method,the total reconstruction time is about double of that in traditional CS imaging,but this can be resolved by increasing computing resource or parallel processing. Moreover, the multi-scale reconstruction exhibits more benefits at low sampling rate,so it is significant to increase the sampling speed in compressive imaging. In practice,this can be widely exploited in biological and dynamic compressive imaging involving limited sampling times.
In this study, we achieved two-scale modulation and reconstruction to verify the idea of improving measurement matrix from the perspective of spatial frequency. Achieving additional scales of modulation at the same sampling number will further enhance the imaging quality. This is the focus of our next study.
Acknowledgment
Xue-Feng Liu thanks Amit Ashok for helpful discussions.
猜你喜欢
杂志排行
Chinese Physics B的其它文章
- Numerical simulation on ionic wind in circular channels*
- Interaction properties of solitons for a couple of nonlinear evolution equations
- Enhancement of multiatom non-classical correlations and quantum state transfer in atom–cavity–fiber system*
- Protein–protein docking with interface residue restraints*
- Effect of interaction between loop bases and ions on stability of G-quadruplex DNA*
- Retrieval of multiple scattering contrast from x-ray analyzer-based imaging*
