Use of subcutaneous tocilizumab to prepare intravenous solutions for COVID-19 emergency shortage:Comparative analytical study of physicochemical quality attributes
2021-01-21NtliNvsJesHermosillAnelTorrentepezJosHernndezJimnezJoseCezRquelrezRolesAntonioSlmerGrc
Ntli Nvs,Jesús Hermosill,Anel Torrente-López,José Hernández-Jiménez,Jose Cez,Rquel Pérez-Roles,Antonio Slmerón-Grcí
aDepartment of Analytical Chemistry,Science Faculty/Biomedical Research Institute ibs.Granada,University of Granada,Granada,E-18071,Spain
bUGC Farmacia Hospitalaria,Biomedical Research Institute ibs.Granada.Hospital Universitario San Cecilio de Granada,Granada,E-18012,Spain
ABSTRACT
Keywords:
COVID-19
Tocilizumab
Critical quality attributes
IV and SC medicines
1.Introduction
In humans,infection by the new severe acute respiratory syndrome coronavirus 2(SARS-CoV-2)causes coronavirus disease 2019(COVID-19),as named by the World Health Organization(WHO)[1].COVID-19 has spread worldwide,becoming a pandemic and causing a global public health crisis.As of April 22,2020,the disease had caused more than 2.5 million infections worldwide,with a fatality rate of 6.9%(more than 180,000)and a recovery rate of 27%(704,647 cases),although the data are constantly changing[2].
The SARS-CoV-2 virus affects different people in different ways.COVID-19 is a respiratory disease and most infected people have only mild symptoms which are not life-threatening,but the number of deaths is still high due to the large population base.People who have underlying medical conditions and those over 60 years old have a higher risk of developing severe symptoms and of dying.COVID-19 has different symptoms including in most cases fever,tiredness and a dry cough.Other symptoms such as shortness of breath,pains,sore throat,diarrhoea,nausea and a runny nose may also appear[3].
Several studies suggest that cytokine storms(interleukins)may play an important role in severe cases of COVID-19,which means that neutralizing key inflammatory factors in the cytokine release syndrome(CRS)could be of great value in reducing the mortality rate in severe cases[4,5].The virus binds to alveolar epithelial cells,thus activating the innate immune system and adaptive immune system,resulting in the release of a large number of cytokines,including interleukin-6(IL-6)[6].IL-6 can be produced by almost all stromal cells and immune system cells,such as B lymphocytes,T lymphocytes,macrophages,monocytes,dendritic cells,mast cells and other non-lymphocytes such as fibroblasts,endothelial cells,keratinocytes,glomerular mesangial cells and tumour cells[7].The classic IL-6 signal is limited to the cells(macrophages,neutrophils,T cells,etc.)that express IL-6R,and plays a leading role in the low level of IL-6.The combination of IL-6 and IL-6R leads to the gp130 co-receptor(CD130)initiating the inflammatory process[8].
Experimental research findings indicate that an excessive immune response and a strong CRS,which may include high levels of granulocyte-macrophage colony stimulating factor and IL-6,are activated in severe COVID-19[9].The monoclonal antibody(mAb)tocilizumab(TCZ)has been found to be effective in the treatment of severe CRS patients[10].TCZ is the active ingredient of the medicinal product for intravenous(IV)administration RoActemra®20 mg/mL(Roche Registration GmbH,Germany),which is indicated for the treatment of chimeric antigen receptor(CAR)Tcell-induced severe or life-threatening CRS in adults and paediatric patients of 2 years of age and older[11].On this basis,this medicine has been used to treat severe COVID-19 patients and several recent studies have already proposed the efficacy of TCZ in the treatment of COVID-19[4-6,12-14].Exploratory studies detected high IL-6 levels in complicated cases of COVID-19 and suggested that the anti-IL-6 TCZ could have beneficial effects in complicated cases.Based on this last one,a systematic review and meta-analysis to assess this evidence was performed[15].This work concluded that inhibition of IL-6 with TCZ appears to be efficacious and safe in preliminary investigation,although the results of several ongoing clinical trials should be awaited to better define the role of TCZ in COVID-19.Due to the sudden,unexpected health emergency produced by the COVID-19,there has recently been a huge increase in demand for the IV form of TCZ based on its indication for treating CRS.This high demand has produced shortages of the IV TCZ medicine for treating severe COVID-19 patients in some hospitals,for example in Spain,one of the countries most affected by this new coronavirus.
TCZ is a humanized anti-interleukin-6 receptor(IL-6R)mAb(IgG1).It binds to both soluble and membrane-bound IL-6 receptors and inhibits signalling mediated by the IL-6/IL-6R complex formation[16].It is frequently used in the treatment of different autoimmune diseases[17]i.e.,for the treatment of rheumatoid arthritis[18]and systemic juvenile idiopathic arthritis[19].It has also been found to play a role in Castleman disease[20]and Crohn's disease[21].A biosimilar called HS628 has also been proposed,and its physicochemical and biological similarity to that of the TCZ originator has been demonstrated[22].
TCZ is currently marketed in two different formulations based on the route of administration:IV(medicinal product named RoActemra®20 mg/mL concentrate for solution for infusion)or subcutaneous(SC)(medicinal product named RoActemra®162 mg solution for injection in pre-filled syringe)[11].RoActemra®IV medicine was licensed in Europe for the management of patients with rheumatoid arthritis in 2009 and the SC formulation was approved in 2014[23].Although these two different routes of TCZ administration do not have identical clinical indications,several studies have already demonstrated that TCZ in SC form has similar levels of effectiveness to the IV form in terms of its clinical aspects[24,25].SC TCZ is therefore an alternative for the treatment of several indications in which the clinical equivalence of the two formulations has been demonstrated.
SC formulations of mAbs medicine are generally perceived as more economical than IV ones mainly because of the limited drug preparation time,but also because only minimal skills are required for administration and it is less invasive,thus enabling patients to self-administer in a home setting[26-28].These reasons may lead to the administration of SC medicines.Nevertheless,regardless of the route of administration,the mAb active ingredient in both formulations must have previously been proved comparable in terms of the functionality and quality of their critical physicochemical attributes,taking into account that these drugs have a degree of inherent variability due to their biotechnological nature.This means that the TCZ drug product in the two forms of administration must be similar;in other words,the manufacturing process for SC TCZ must not affect quality attributes such as potency,aggregates order size or charge variant or the levels of processrelated impurities[29].This means that if the excipients present in the SC form are compatible for IV delivery,the SC form could be used for IV administration,once the stability of the TCZ after dilution(to prepare the solution for infusion)has been proved.In this case,it could be used to treat severe COVID-19 patients,even though the SC medicinal product,i.e.,RoActemra®162 mg,is not specifically indicated for the treatment of the CRS produced by treatment with CAR-T immunotherapy.
To this end,in this paper we have conducted a comparability study assessing the main critical physicochemical attributes of the TCZ clinical solutions used for infusion,i.e.,6 mg/mL and 4 mg/mL,prepared from RoActemra®20 mg/mL(IV form)and from RoActemra®162 mg(SC form),in order to evaluate the use of the latter for preparing the 6 mg/mL and 4 mg/mL clinical solutions required for IV administration.If this is viable,in a hospital shortage situation of the medicine for IV administration(20 mg/mL),the SC form(162 mg in 0.9 mL solution pre-filled syringe)could be used to prepare the IV delivery of TCZ.It is important to bear in mind that during the current pandemic all the medicines are being used offlabel,as none of them has yet been approved for the treatment of COVID-19.
2.Experimental
2.1.Materials
2.1.1.Chemicals
The 100 mL sodium chloride(0.9%)infusion bags were from Fresenius Kiabi Espa~na S.A.U.(Marina 16-18,08005 Barcelona,Spain;Bach 13NLS041,Ex.10/2021).Omnifix®Luer Lock Solo 3 mL syringes(Bach 19M18C8,Ex.11/2024)were obtained from B.Braun Melsungen AG(34209 Melsungen,Germany).Sodium chloride,sodium hydroxide,hydrochloric acid,disodium phosphate monohydrate and potassium phosphate monobasic were supplied by Panreac(Barcelona,Spain).A reconstituted solution of infliximab(IFX)(Remicade®100 mg vial,Janssen Biotech,Horsham,U.S.A.)was used as quality control to assess the estimated molecular weight in size exclusion chromatography(SEC).Reverse-osmosisquality water purified(≥18 M/cm)with a Milli-RO plus Milli-Q station from Millipore Corp.(Madrid,Spain)was used throughout the study.
2.1.2.Tocilizumab medicines
Two vials each from different batches(B2084H09,Ex.04/2022 and B2084H09,Ex.10/2021-named throughout IV-Batch1 and IVBatch 2 respectively)of the medicine RoActemra®20 mg/mL concentrate for solution for infusion,containing 200 mg/10 mL of TCZ and two pre-filled syringes each from different batches(B1120,Ex.05/2021 and B1126,Ex.09/2021-named throughout SC-Batch1 and SC-Batch 2 respectively)of the medicine RoActemra®162 mg solution for injection with a content of 162 mg of TCZ in 0.9 mL(Roche Registration GmbH,Emil-Barrell-Strasse 1,79639 Grenzach-Wyhlen,Germany)were used in this study.They were supplied by our Pharmacy Service at the University Hospital San Cecilio(Granada,Spain).
RoActemra®20 mg/mL is supplied in a vial(type I glass)with a stopper(butyl rubber);the excipients are sucrose,polysorbate 80,disodium phosphate dodecahydrate,sodium dihydrogen phosphate dehydrate,and water for injections;each 200 mg vial contains 0.20 mmol(4.43 mg)sodium[11].RoActemra®162 mg is supplied in 0.9 mL solution in a pre-filled syringe(type I glass)with a staked-in needle containing 162 mg TCZ assembled into a prefilled pen;the syringe is closed by a rigid needle shield(elastomer seal with a polypropylene shell)and a plunger stopper(butyl rubber with a fluororesin coating).The excipients in RoActemra®162 mg areL-histidine,L-histidine monohydrochloride monohydrate,L-arginine,L-arginine hydrochloride,L-methionine,polysorbate 80 and water for injections[11].
2.1.3.Tocilizumab solutions of 6 mg/mL and 4 mg/mL in 0.9% NaCl prepared from IV and SC medicines
Solutions of 6 mg/mL and 4 mg/mL of TCZ for infusion were prepared from RoActemra®20 mg/mL in polyolefin infusion bags of 100 mL(Baxter,BN:18A23E4Z)by appropriate dilution in isotonic 0.9% NaCl under sterile conditions in a laminar flow cabinet as indicated in the summary of the product characteristics[11].2 mL of these IV TCZ solutions were taken directly from the bags and placed in lab amber glass vials for immediate analysis.Throughout this work,these samples were referred to as“IV”clinical solution samples.
Similarly,2 mL of TCZ solutions at the same concentration as the IV clinical solutions,i.e.,6 mg/mL and 4 mg/mL,were prepared using the medicine for SC administration,i.e.,RoActemra®162 mg instead of RoActemra®20 mg/mL,by appropriate dilutions in an isotonic aqueous medium 0.9% NaCl under sterile conditions in a laminar flow cabinet.These diluted solutions were placed in lab amber glass vials for immediate analysis.Throughout this work,these samples were referred to as“SC”clinical solution samples,so as to indicate that they were prepared from the medicine for SC administration even though they were not intended for SC use.
2.2.Methods
2.2.1.Visual inspection
A quick visual inspection was carried out daily prior to experimentation in order to check for evidence of large aggregate formation,turbidity,suspended particles,color changes and gas formation.To this end,samples were visually inspected with the naked eye.
2.2.2.Dynamic light scattering(DLS)
Soluble particulates were assessed by DLS using a Zetasizer Nano-ZS90 Malvern(UK).Particle size distribution was determined on 0.5 mL of sample volume using 10 mm spectrophotometry disposable cuvettes.Each sample record was the cumulative result of 100 reads,acquired at a thermostatically controlled temperature of 20°C and with a time acquisition of 10 s per read.The average hydrodynamic diameter(HD),polydispersity index(PDI),volume size distribution and intensity size distribution of all the samples analyzed were compared and discussed.
2.2.3.Size exclusion high performance liquid chromatographic method with diode array detection((SE)HPLC-DAD)
Aggregates were analyzed using an Agilent 110 HPLC system equipped with a quaternary pump,a degasser,an autosampler,a column oven and a photodiode array detector(Agilent Technologies,Madrid,Spain).The instrument was connected to a personal computer fitted with an HPLC ChemStation workstation for LC 3D systems(rev.A.0903,Agilent Technologies).The chromatographic analyses were carried out in a 300 mm×4.6 mm i.d.,5μm particle size,wide pore 300 Å size exclusion analytical column(300Bio SEC-5,Agilent Technologies,USA).All samples were eluted at an isocratic flow rate of 0.38 mL/min for 15 min with a mobile phase composition of buffer phosphate(150 mM,pH 7.00)prepared with anhydrous Na2HPO4and adjusted with 0.1 M HCl.The temperature of the column was maintained at 25°C,and the injection volume was 1μL.UV-visible spectra were recorded between 190 nm and 500 nm,with a data point every 0.5 nm.Chromatograms were registered atλ=214±5 nm and atλ=280±5 nm,using λ=360±20 nm signal as a reference.Samples were not filtered before being injected into the chromatograph to avoid aggregate loss in the filter.Similarity tests available in the HPLC ChemStation were used to evaluate the spectral peak purities to assess the monomers and aggregates[30].
2.2.4.Strong cation exchange ultra-high performance liquid chromatographic method with diode array detection((CEX)UHPLCDAD)
Charge variant profiles were obtained using a strong cation exchange column(MAbPac™ SCX-10 RS,2.1 mm × 50 mm,5μm,Thermo Scientific,P/N 082675)connected to a Dionex Ultimate 3000 UHPLC system.Mobile phase A consisted of 10 mM sodium phosphate(pH 7.5),and mobile phase B consisted of 10 mM sodium phosphate and 100 mM sodium chloride(pH 7.5).The separation gradient was set as follows:0-3 min,holding at 15% B;3-6 min,15%-30% B;6-20 min,30%-55% B;and 20-22 min,55%-100% B.The column was then washed with 100% B for 5 min,followed by equilibration using 15% B for 15 min.The mobile phase flow rate was 0.4 mL/min and the injection volume was 2μL.The column temperature was set at 30°C and chromatograms were registered at different wavelengths,i.e.,λ=214 nm,λ=220 nm and λ=280 nm,usingλ=350±10 nm as the reference wavelength in all cases.At least duplicated analysis of the samples was made.
2.2.5.Intrinsic tryptophan fluorescence(IT-F)
Conformational tridimensional structure was assessed by IT-F and measurements were carried out on a Cary Eclipse spectrofluorometer(Agilent,Santa Clara,CA,USA).Emission spectra were recorded from 305 to 400 nm with the excitation wavelength set to 298 nm.The temperature of the samples was kept at room temperature.A total of 10 spectral accumulations were performed for all measurements.For all the samples,the excitation and emission slits were set to 5 nm.Raw spectra for each sample were visually checked,looking initially for either shifts in the maximum peaks or a decrease in fluorescence intensity.The spectral center of mass(C.M.)was considered as a mathematical representation of each spectrum and was determined as such foreach sample tested,using the following equation:

in which λi is the wavelength and fi the fluorescence intensity.
2.3.Controlled degradation studies
Different ways of degradation were assessed by subjecting samples of TCZ solutions of 6 mg/mL prepared from both medicines,for IV and SC administration,to several stress conditions.These included(i)exposure to heat stress by keeping solutions at 40°C for 24 h;(ii)exposure to light irradiation(250 W/m2)in an ageing chamber(Solarbox 3000e RH,Cofomegra,Milan,Italy)for 24 h following the guidelines laid down by the International Conference for Harmonization(ICH Q1B)for photostability testing[31],(iii)exposure to 1% acidic medium with analysis immediately after preparation and after 24 h of storage,and(iv)exposure to 1% basic medium with analysis immediately after preparation and after storage for 24 h.
2.4.Methodology applied to compare the IV and SC TCZ samples
Table 1 shows the methodology applied to compare the IV and SC TCZ samples studied in this research.An assessment was made of the critical quality attributes of the medicines for SC and IV TCZ administration and of the diluted clinical solutions at 6 mg/mL and 4 mg/mL of TCZ prepared with both SC and IV medicines.Two different batches were considered for the analysis.One batch of each medicine,SC and IV,was used to prepare the 4 mg/mL and 6 mg/mL TCZ clinical solution samples in order to assess similarity by comparing the results of the analysis of the critical quality attributes.A different batch of the medicines was used to corroborate the previously obtained results,in order to evaluate batch-to-batch differences.
The stability-indicating nature of all the methods used in this study was corroborated by accelerated degradation studies.These experiments were also useful for evaluating comparability between the IV and SC TCZ clinical solutions,assuming that similar molecular entities had similar degradation behavior and pathways.They were also useful for comparing the stability of TCZ against degradation.Table 1 also indicates the analytical technique used to evaluate each of the critical quality attributes of the biotechnological drug TCZ in all these solutions,IV and SC medicinal products and IV and SC clinical solutions.
Analyses of the clinical solutions of 6 mg/mL and 4 mg/mL prepared by appropriate dilutions of the SC and IV medicine,as indicated above,were performed immediately after preparation(D0).The solutions were stored refrigerated at 4°C and the analyses were repeated 24 h after preparation(D1).Results were then compared as discussed next.
3.Results
3.1.Visual particulates
Visual inspection by the human eye can detect particulates of~100μm or larger[32].The IV and SC TCZ clinical solution samples of 6 mg/mL and 4 mg/mL remained clear for the 24 h duration of the study with no precipitates or particulate matter detected with the naked eye.No changes in color or turbidity were observed over the test period.
3.2.DLS:soluble particulates
Soluble particulates up to 10μm were assessed by DLS.The results are presented in Fig.1 and Tables 2 and 3,and are discussed next.
3.2.1.Comparability study of 6 mg/mL and 4 mg/mL IV and SC TCZ clinical solutions
Particulate size distributions by volume in the IV and SC TCZ clinical solutions at D0 and D1 are shown in Figs.1A and B.This distribution was very similar in all the solutions,regardless of the concentration(4 mg/mL or 6 mg/mL)or the storage time(analysis conducted immediately after preparation(D0)or after storage for 24 h(D1)).The results also indicated the detection of a single population of particulates with similar hydrodynamic volume measured as HD(Table 2),in all the solutions analyzed and attributed to the monomers of TCZ.The graphs showing the particulate size distributions by intensity are shown in Fig.S1,and also indicate that this single population is almost exclusively responsible for the dispersion of light(99.9%).
When the 6 mg/mL IV and SC TCZ solutions were compared,they displayed practically identical values for the HD at D0,i.e.,8.5±3.3 nm and 8.7±2.6 nm,respectively,and there were no significant differences between the values at D0 and the values at D1.Similar results were found for the 4 mg/mL TCZ solutions,with HD values practically identical at D0,i.e.,9.0±2.1 nm and 9.1±2.8 nm for the IV and SC,respectively,and no significant differences at D1.When the solutions at different concentrations were compared,no significant differences were detected between them either in the HD values or in the particulate size volume distributions.Our previous studies on other therapeutic IgG1 such as infliximab,rituximab and bevacizumab in 0.9% NaCl solutions at 1 mg/mL displayed HD values of around 12.7 nm,9.7 nm and 8.4 nm,which means that TCZ has similar HD values to those of rituximab and bevacizumab[33-35].
In addition,in order to corroborate the single particulate population in all the TCZ solutions(assigned to the TCZ monomers),the PDI was obtained.This parameter is dimensionless ranging from 0 to 1 and scaled such that values of less than 0.05 are rarely seen other than with highly monodisperse standards.Values greater than 0.7 indicate that the sample has a very broad size distributionand that it is probably not suitable for study using the DLS technique.The PDI for all the samples was around 0.2,which confirmed that the solutions were mainly monodisperse(Table 2).Furthermore,the values were similar for both preparations,IV and SC,and were unchanged after storage for 24 h.

Table 1Methodology for comparing IV and SC TCZ samples:medicines and 6 mg/mL and 4 mg/mL.
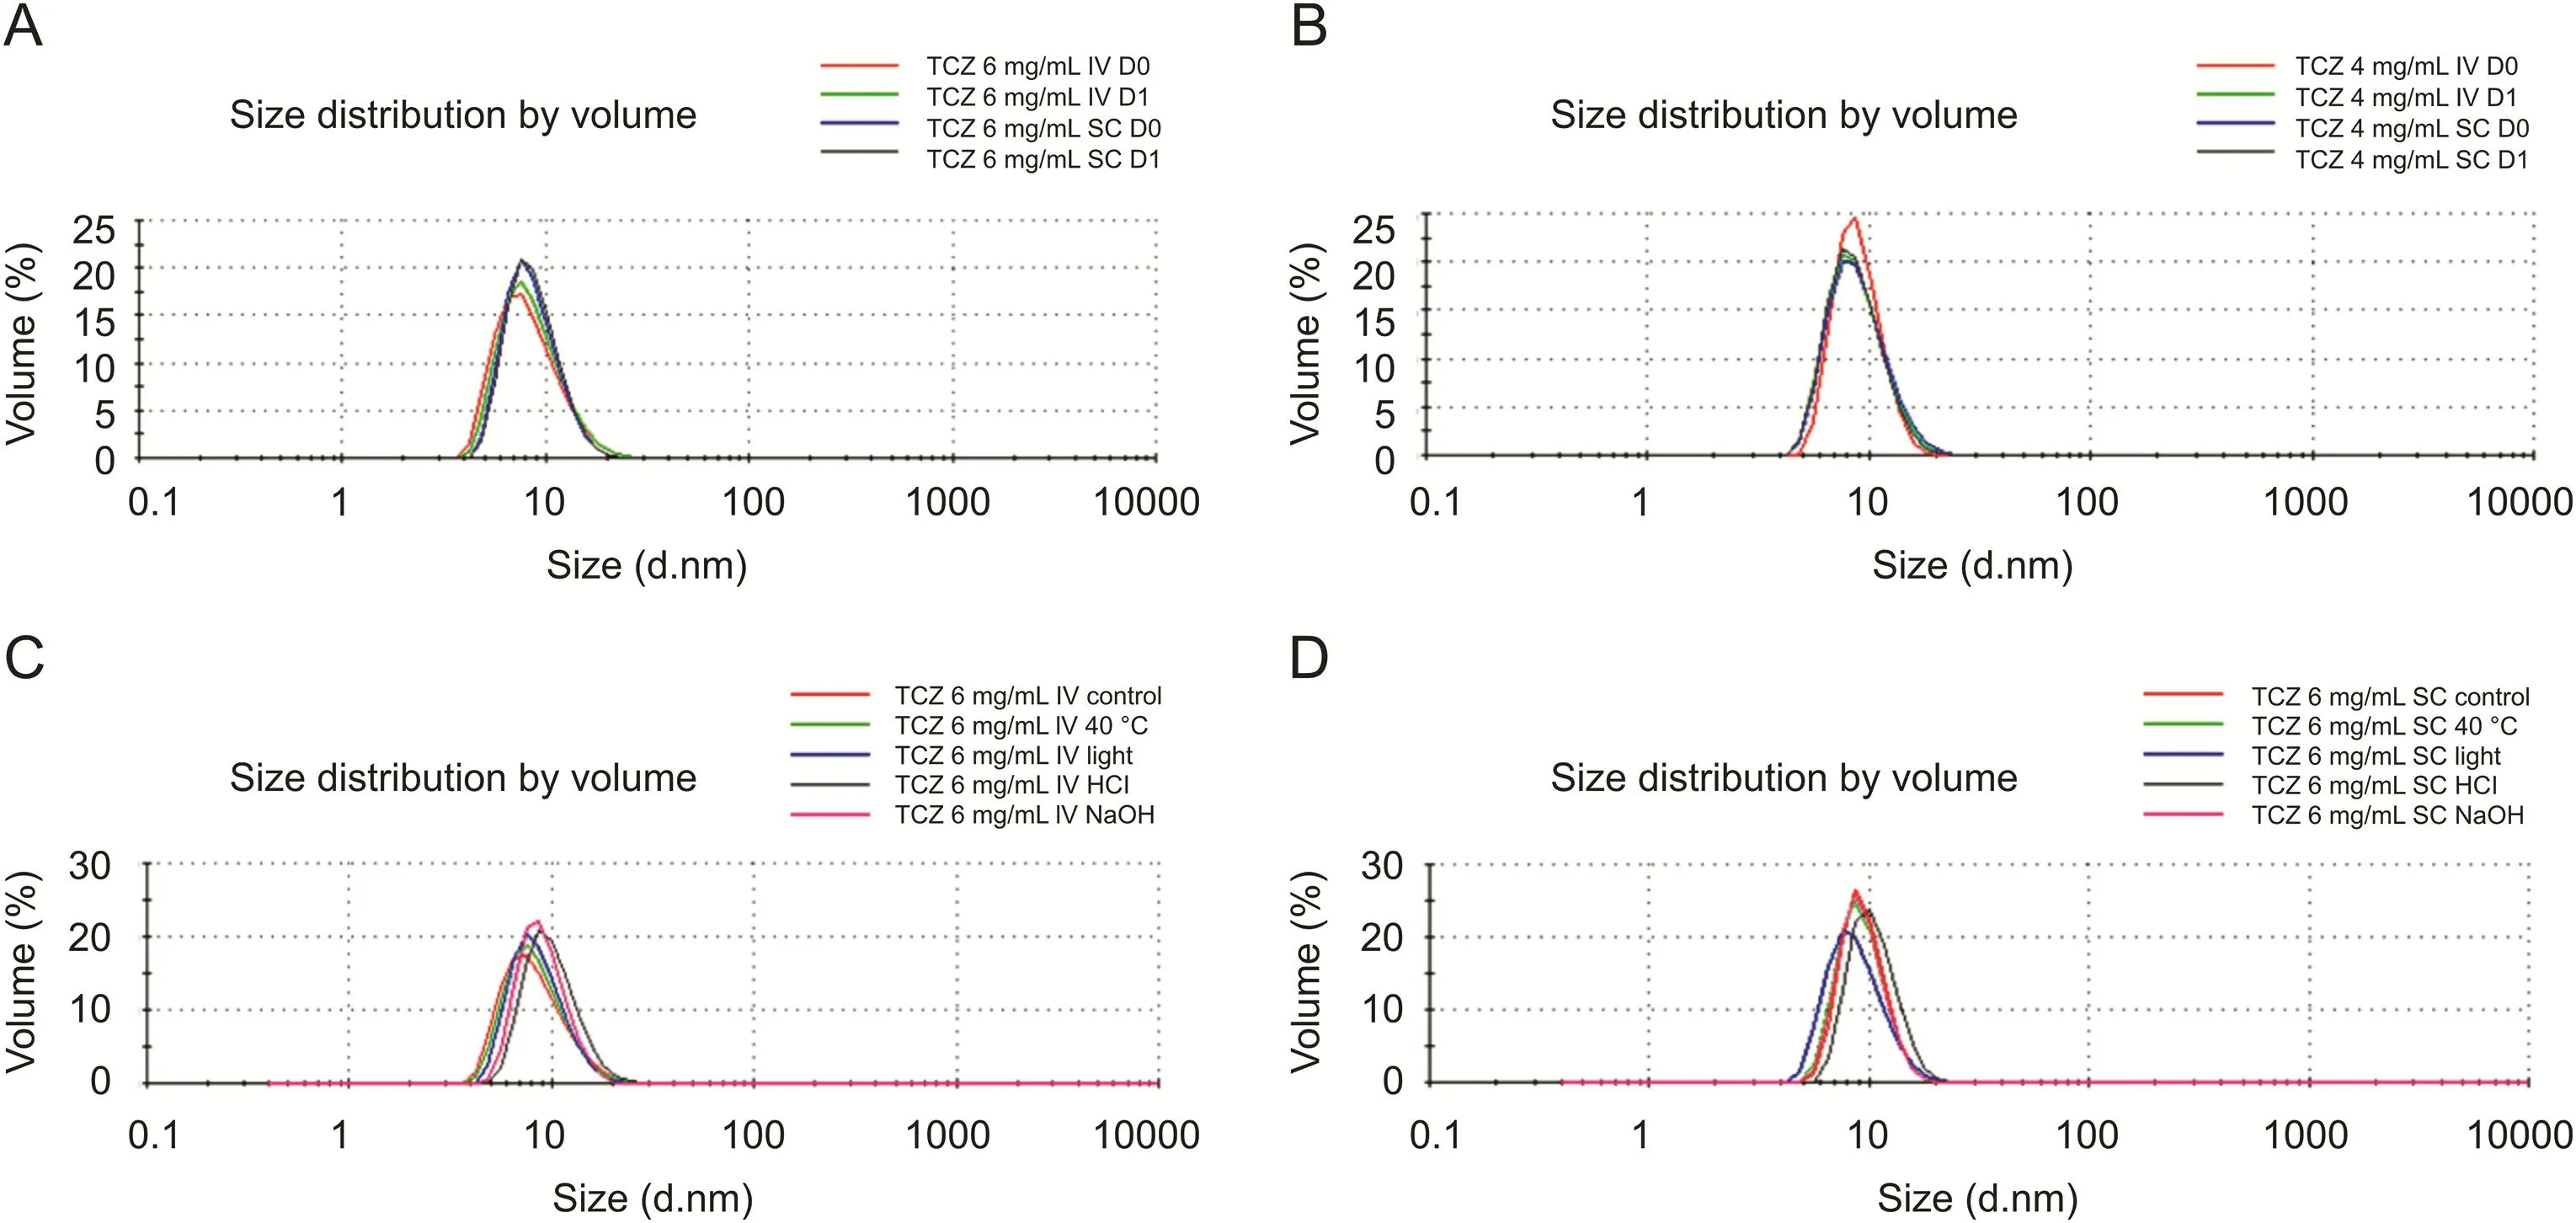
Fig.1.Size distribution volume(DLS)comparability study of(A)6 mg/mL IV and SC TCZ clinical solutions,and(B)4 mg/mL IV and SC TCZ clinical solutions;all samples were prepared from IV-batch-1 and SC-batch-1.Stress study of(C)6 mg/mL IV TCZ clinical solutions(IV-batch-1),and(D)6 mg/mL SC TCZ clinical solutions(SC-batch-2).

Table 2Hydrodynamic diameter(HD)and polydispersity index(PDI)comparability study of IV and SC clinical solutions:6 mg/mL and 4 mg/mL TCZ.
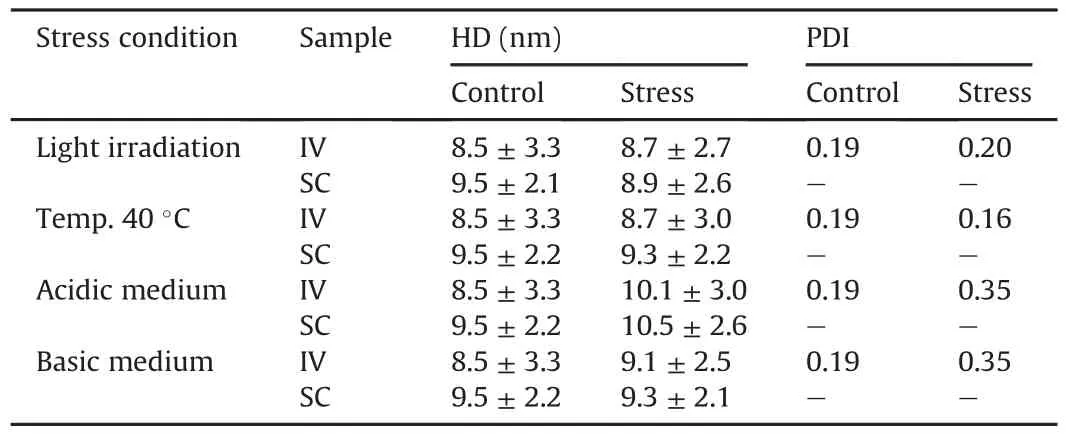
Table 3Hydrodynamic diameter(HD)and polydispersity index(PDI)comparability stress study of IV and SC clinical solutions:6 mg/mL TCZ.
In addition to all these,the polydispersity(%,Pd)of the single population corresponding to the TCZ was calculated as follows:

in which St.Dev is the standard deviation(SD)of the population in nm and Size is the mean size of the population,also in nm.The Pd(%)measures the width of the assumed distribution.In terms of protein analysis,a Pd of 20% or less indicates that the sample is monodisperse.In the 6 mg/mL solution,this value was 16% and 5% for the IV and SC solutions at D0 and 14% and 8.3% for IV and SC,respectively at D1.For the 4 mg/mL solutions,the Pd(%)was 4.7%(IV)and 9.6%(SC)at D0 and 8.4%(IV)and 7.5%(SC)at D1.The PDI therefore corroborated again that all the solutions are characterized by a single particulate population,which on the basis of its size is assigned to the monomers of TCZ.
All these results confirm high levels of similarity between the soluble particulate in 6 mg/mL and 4 mg/mL IV and SC solutions.
3.2.2.Comparability study of the stress tests on the 6 mg/mL IV and SC TCZ clinical solutions
TCZ degraded similarly in IV and SC solutions at 6 mg/mL when submitted to several controlled degradation or stress conditions,as can be deduced from the results set out in Figs.1C and D and Table 3.
The graph displaying the particulate size distributions by volume(Figs.1C and D)shows no new populations of particulate with higher or smaller volume,and no significant changes regarding the original particulate population in the TCZ control solution sample.Although the intensity distribution graph indicated the detection of a new particulate population of larger size(Figs.S1C and D),the contribution made by these larger size populations to the total volume in the solutions was close to 0.1% in all cases;it was therefore not clear whether these particle populations could be attributed to possible degradation of TCZ by aggregation or to particles of dust.These populations were only detected in IV samples subjected to acidic and basic media,scattering at 500 nm and 300 nm respectively.In the case of the SC solutions samples,these populations were also detected scattering at 500 nm but only when subjected to light stress and at 300 nm in all the stressed samples and in the control,contributing 50%-70% of the total intensity registered,but representing only 0.1% of the total volume.This particle population was not detected in any of the solutions analyzed in the comparability study;therefore,given its small contribution to the total volume(0.1%),it was probably due to the inclusion of dust when preparing the 6 mg/mL TCZ solution for the stress study.
In the IV and SC TCZ solution samples,the HD values for the stressed solution samples were similar to those of their respective control samples and similar to those of each other(Table 3).The PDI was close to 0.2 for all the IV stressed solution samples except for those subjected to acidic and basic media,in which this value increased to 0.35 due to the detection of the particle population at 300 and 500 nm.For the SC samples,PDI was not calculated because of the distortion in intensity caused by the particles thought to be dust.
3.3.(SE)HPLC-DAD method:chromatographic aggregates profile
The TCZ solution samples(both clinical solutions at 6 and 4 mg/mL)and the IV and SC medicinal products were analyzed by SEC in order to obtain their chromatographic aggregate profile.
3.3.1.Comparability study of 6 mg/mL and 4 mg/mL IV and SC TCZ clinical solutions
The chromatographic aggregates profiles were invariant in all the samples and no modifications were observed either in shape or in the areas under the peaks,as can be seen in Fig.2 for the two control days(D0 and D1).When the IV and SC samples were compared,the profile was also very similar.The only difference between them was the peak detected at the highest retention time at around 10.4 min in the IV samples and at 12.1 min in the SC,which is discussed next.In all the samples,the peak of the TCZ monomers was detected at 7.1-7.8 min IFX solutions of 10 mg were used as a control to test the retention time of the TCZ monomers,as both therapeutic mAbs belong to the IgG1 class and share a similar molecular weight at around 150 kDa(Fig.S2).The spectral peak purity factor calculated for the peaks for the TCZ monomers was greater than 98.7% in all the analyzed samples.The TCZ spectra for the monomers were the same regardless of their provenance,i.e.,IV or SC medicines or dilutions(Figs.3A2 and C2).
As regards to the peak at the shortest retention time at around 6.1 min,this was assigned to TCZ dimers(natural aggregates).This was also done by comparison with IFX,which we had studied in great depth in previous work on IgG1 SEC studies[36,37].The percentage of these natural aggregates of TCZ with respect to the monomers was around 0.6%,and this value was maintained in all the samples,i.e.,no differences were detected between IV and SC clinical solution samples either at 6 mg/mL or at 4 mg/mL and between IV or SC samples over the 24 h,i.e.,D0 and D1 results.As regards to the UV spectra,these show similar patterns to those of the TCZ monomers,and are the same for IV and SC TCZ samples(Figs.3A1 and C1).
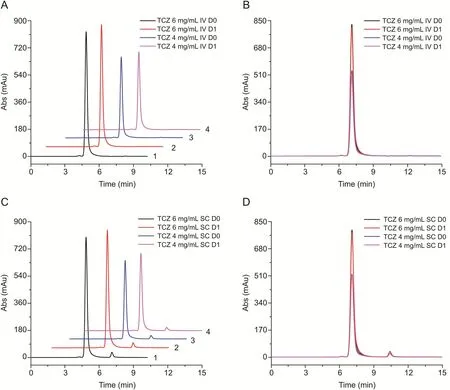
Fig.2.TCZ SEC comparability study of 6 mg/mL and 4 mg/mL IV and SC clinical solutions.(A)SEC profile of the IV samples:(1)6 mg/mL D0,(2)6 mg/mL D1,(3)4 mg/mL D0 and(4)4 mg/mL D1;(B)overlaid profile of all the previous IV samples;(C)SEC profile of the SC samples:(1)6 mg/mL D0,(2)6 mg/mL D1,(3)4 mg/mL D0 and(4)4 mg/mL D1;(D)overlaid profile of all the previous SC samples.All samples were prepared from IV-batch-1 and SC-batch-1.
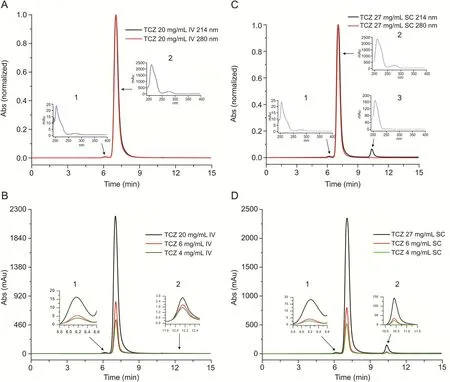
Fig.3.TCZ SEC profiles comparability study including IV and SC medicinal products.(A)RoActemra®20 mg/mL(IV-batch-2)at 214 nm and 280 nm:(1)UV dimers spectrum and(2)UV monomers spectrum;(B)RoActemra®20 mg/mL(IV-batch-2)and the IV clinical solutions 6 mg/mL and 4 mg/mL at 214 nm(IV-batch-1):(1)zoom of dimers and(2)zoom of peak at around 12 min;(C)RoActemra®162 mg(SC-batch-2)diluted to 27 mg/mL at 214 nm and 280 nm(SC-batch-1):(1)UV dimers spectrum,(2)UV monomers spectrum and(3)unknown compound spectrum;(D)RoActemra®162 mg(SC-batch-2)diluted to 27 mg/mL and the SC clinical solutions 6 mg/mL and 4 mg/mL(SC-batch-1)at 214 nm:(1)zoom of dimers,(2)zoom of monomers and(3)zoom of unknown compound.
As regards to the differences between IV and SC clinical solution samples detected in the peak at the largest retention time,these were noted in terms of both elution time and area under the peak.In the case of IV,the peak was detected at around 12.1 min with an almost negligible percentage of the total area(around 0.1%).In all the SC SEC profiles,the peak was detected at 10.4 min,representing 3.4% of the total area,and this proportion was maintained independently of the dilution applied to the SC medicine to achieve the appropriate clinical concentration for intravenous administration.We then looked at the composition of the excipients used in the SC medicine RoActemra®162 mg(see 2.1 Materials),but none of them could justify this peak,which had an estimated molecular weight of around 15-17 kDa(based on data from a previous calibration of our SEC column).Therefore,the source of this unknown compound was further investigated to find out whether it was already in the SC medicine RoActemra®162 mg,or whether it had resulted from the dilution to prepare the concentration at 6 mg/mL and 4 mg/mL required for intravenous administration,or whether it was batch dependent.Fig.3 shows the results of the analysis of a different batch of the IV(RoActemra®20 mg/mL)and SC(RoActemra®162 mg)medicines.The SC medicine had to be diluted to 27 mg/mL in order to avoid instrument saturation in both the chromatographic column and the UV detector.As can be seen in Fig.3,the peak of this unknown compound was already detected maintaining the same percentage of total area.It could therefore be inferred that this unknown compound was already in the medicine(in both batches studied)and did not result from the dilution of the medicine to prepare the concentration required for intravenous administration in 0.9% NaCl.Also,the fact that this peak was not detected in the chromatogram recorded at 280 nm suggests that this unknown compound is not a protein.Fig.3C3 also shows the UV spectrum for this compound,which is different from the identical spectra for the TCZ monomers and natural aggregates.Fig.3A also shows that this unknown compound was not detected in either of the two IV samples,or in the clinical solutions(6 mg/mL and 4 mg/mL from Batch 1)or in the medicine(20 mg/mL,Batch 2).We also carried out a test to make sure that this peak did not correspond to HCl,as suggested in a previous publication on TCZ analysis by 2D chromatography[38].The high spectral peak purity factor(over 98%)also suggested that only one compound had been detected in this chromatographic peak.
3.3.2.Comparability study of the stress tests on the 6 mg/mL IV and SC TCZ clinical solutions
The IV and SC TCZ clinical solutions degraded in similar ways as can be seen in the results set out in Fig.4.SEC profiles were very similar except in the peak assigned to the unknown compound of non-protein nature detected in the SC solution samples,which remained un-degraded and was not affected by the stress to which the TCZ samples were subjected.Table 4 shows the percentage of higher order aggregates and the associated percentage of monomers,according to the type of stress to which the samples were subjected.The main degradation pattern was the increase of the peak at 6.1 min and no other chromatographic peaks were detected.As happened with other therapeutic proteins that we had studied in previous research[35,36,39]exposure to light induced TCZ aggregation.This was slightly higher in the case of IV samples(1.54% compared to 0.98%).When the samples were kept in an acidic medium(pH=1.7)for 48 h,aggregation increased to 11%(IV)and 14%(SC).This was the stress factor that caused most decay,with the corresponding important decrease in the percentage of monomers.By contrast,the TCZ samples seem to be robust against heat degradation when placed at 40°C for 24 h with no exposure to light,as practically no changes were observed in the percentage of aggregates/monomers.It is also important to highlight that the degradation caused by exposure to a basic medium(pH=11.0)decreased the percentage of aggregation.
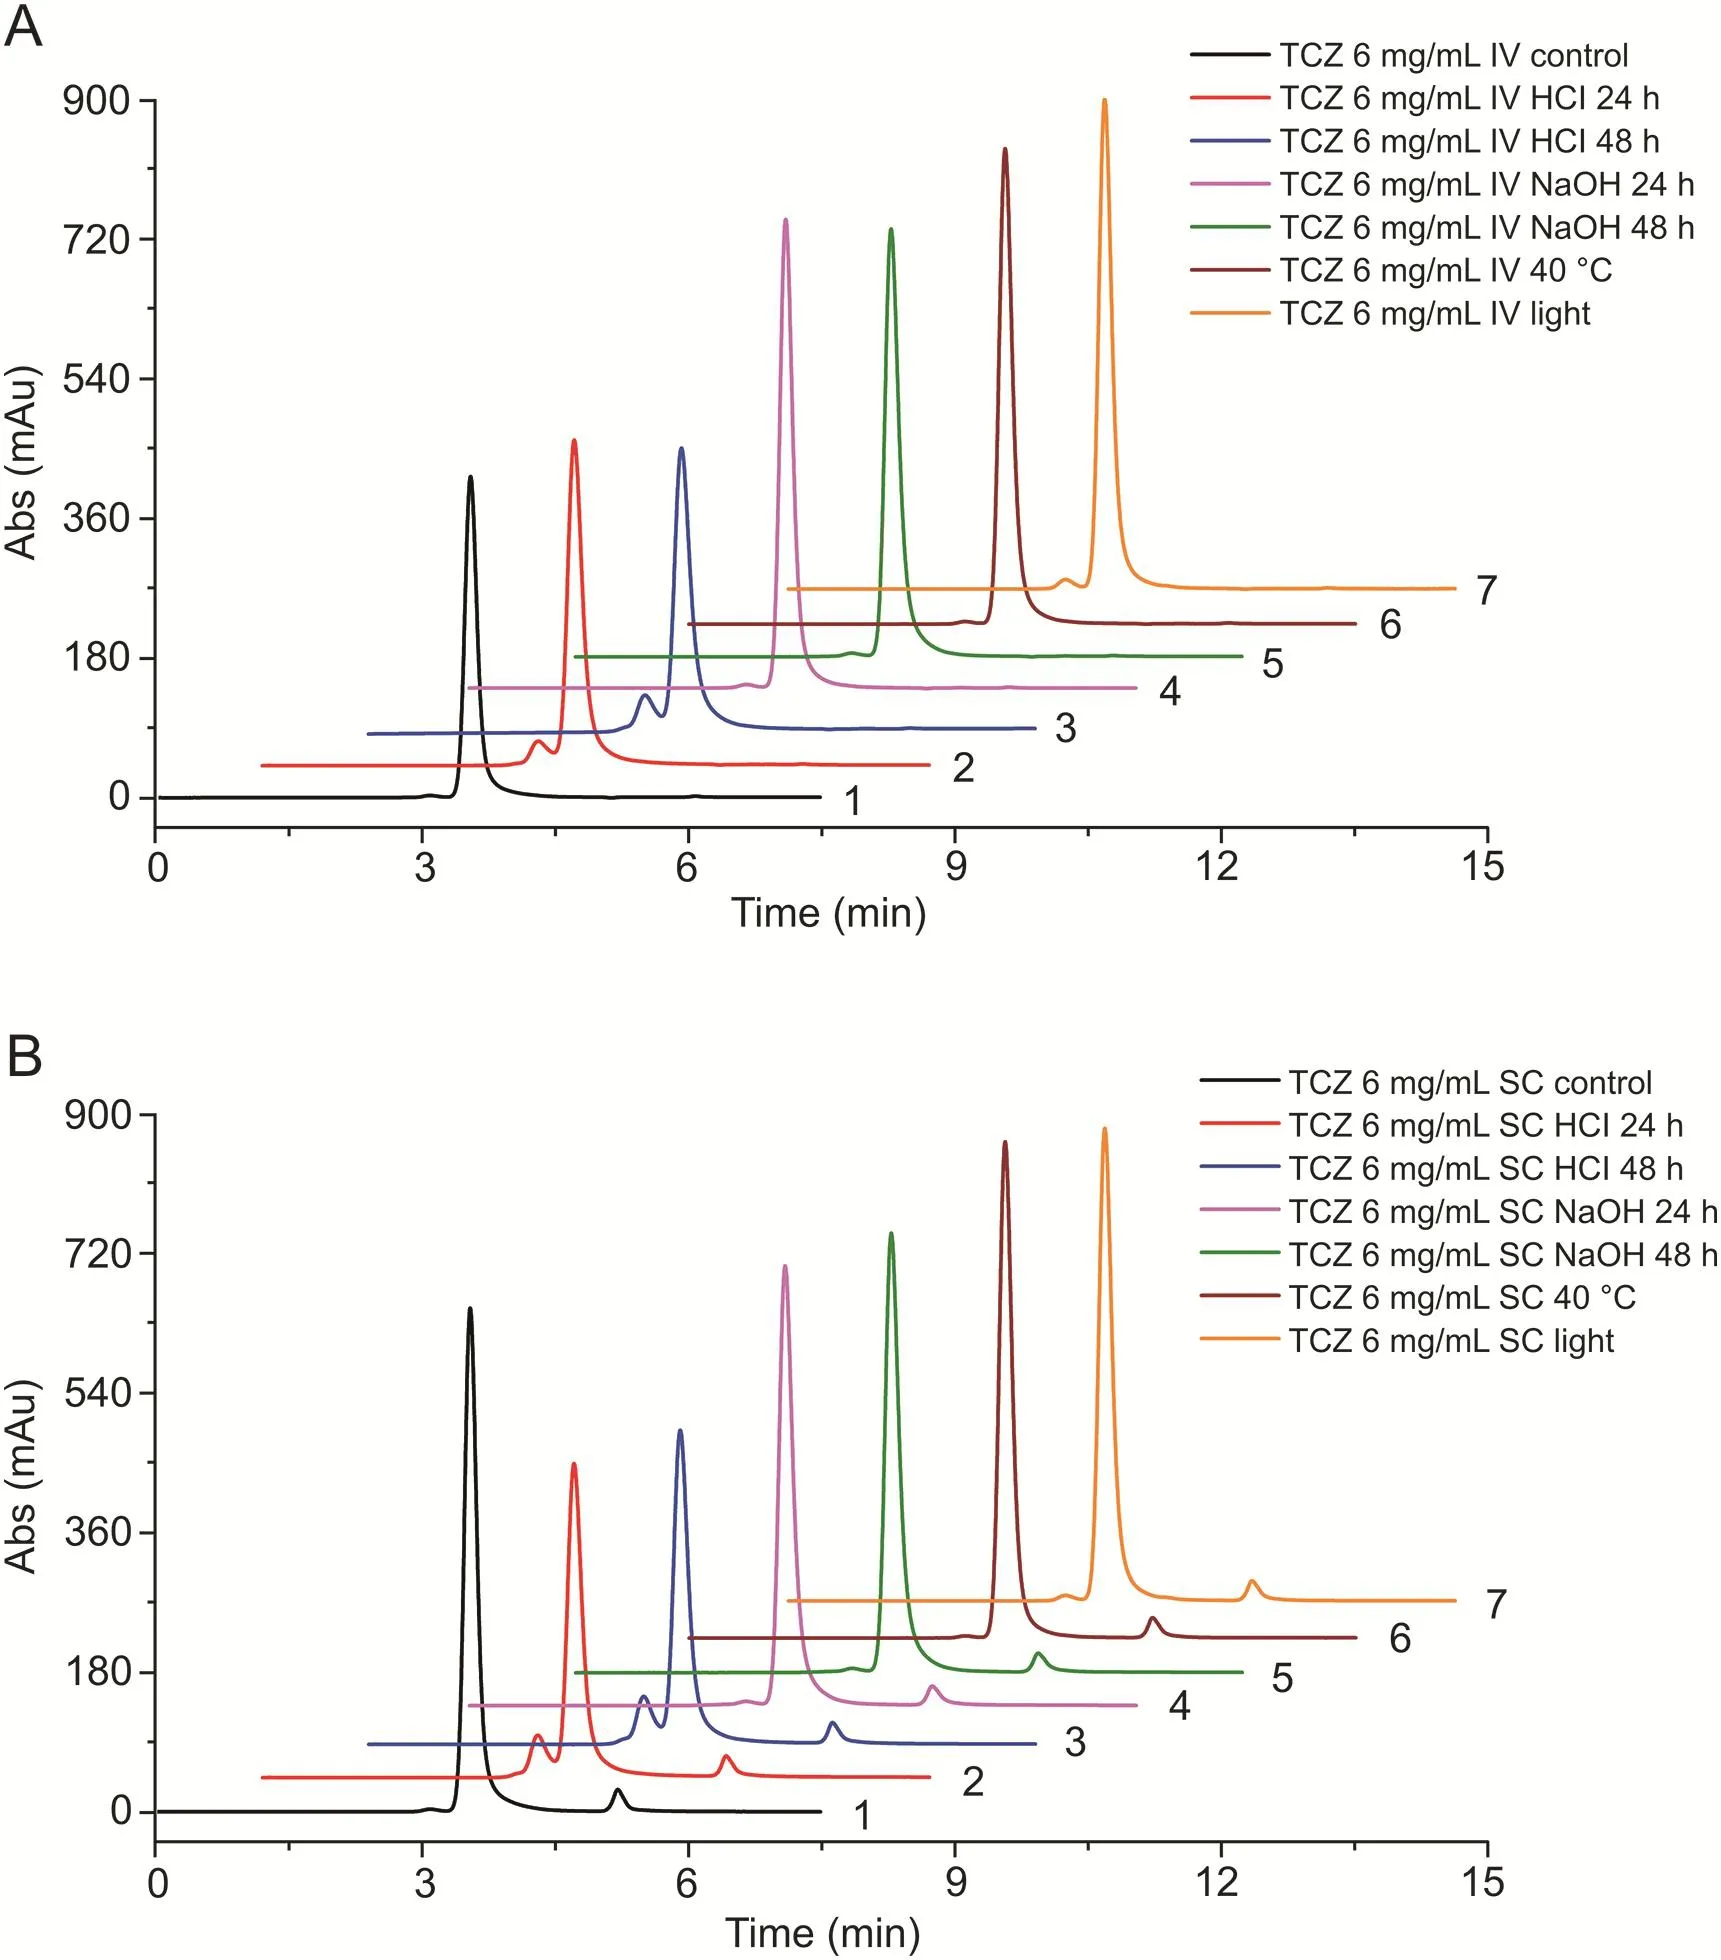
Fig.4.TCZ stress study by SEC.(A)SEC profiles of samples of 6 mg/mL IV clinical solutions:(1)non-stressed sample,(2)acidic medium,24 h,(3)acidic medium,48 h,(4)basic medium,24 h,(5)basic medium,48 h,(6)temperature 40°C and(7)light stress;(B)SEC profiles of samples of 6 mg/mL SC clinical solutions:(1)non-stressed sample,(2)acidic medium,24 h,(3)acidic medium,48 h,(4)basic medium,24 h,(5)basic medium,48 h,(6)temperature 40°C and(7)light stress.Samples shown are from IV-batch-1 and SC-batch-1 and SC-batch-2.
3.4.(CEX)UHPLC-UV method:chromatographic charge variant profile
Chemical and enzymatic modifications can lead to charge variants in mAbs[40].Charge heterogeneity can affect the stability,biological activity and pharmacokinetics of antibodies[41].Therefore,cation exchange chromatography(CEXC)was used to evaluate the TCZ charge variants profile in IV and SC clinical solutions.
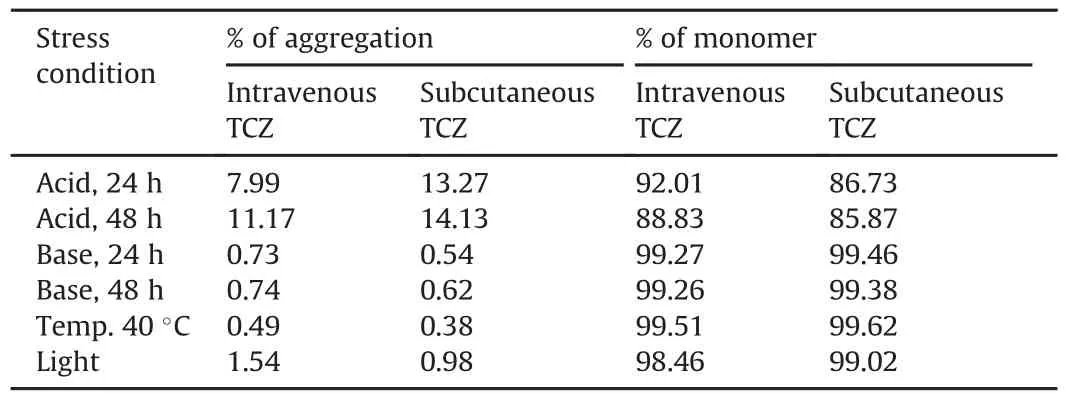
Table 4Percentages of aggregation according to type of stress.
The(CEX)UHPLC-UV method used here was adapted from Ref.[24],which presented a detailed physicochemical and biological characterization of the TCZ innovator.Here,the CEX method was optimized by using a strong cation exchange column instead of a weak one.In addition,the chromatograph used was an ultra-high performance model instead of a high-performance one.All of these enabled us to modify the gradient,shortening the analysis time while obtaining a very similar TCZ charge variant profile as in Ref.[22],as will be discussed next.
3.4.1.Comparability study of 6 mg/mL and 4 mg/mL IV and SC TCZ clinical solutions
As in the SEC method,chromatograms were recorded at different characteristic λ values for proteins(214 nm,220 nm and the very specific to proteins,280 nm),although the results shown here were mainly obtained at λ=214 nm,the most sensitive point.
Comparability results for the IV and SC TCZ clinical solutions are shown in Fig.5 and Table 5.Although the chromatographic charge variant profiles for the IV and SC solutions were very similar,there were some small differences.The most important difference was the increase in the basic variant detected at 12.35 min in the SC clinical solution(Fig.5).Consequently,when the abundance of the acidic,neutral and basic variants was analyzed,a slightly different composition could be observed in the basic variants(Table 5),in that the percentage of total basic variant in the SC solutions was four percentage points higher than in the IV solutions.There is no clear relationship between this increase and a corresponding decrease in the acidic or neutral variant,as this increase is not particularly important in terms of net quantity.In addition,when the charge variant profiles of the same solution were compared for the different storage times,i.e.,comparing D0 with D1 for the same IV or SC solution,no changes were detected in any of the chromatograms(Fig.6)either in shape or in chromatographic areas.
In order to investigate the reason for these differences between the chromatographic variant profiles of TCZ from IV and SC,medicines from different batches were analyzed(IV solution 20 mg/mL and SC solution 180 mg/mL).The injection volumes were adjusted to make results comparable as the concentrations of the medicines(0.4 μL for the IV medicine and 0.1 μL for the SC medicine)were higher than in the diluted solutions.Thus,the amount(inμg)of TCZ injected was in the same order of magnitude as in the diluted samples at 6 mg/mL and 4 mg/mL.Fig.7 shows the results of these experiments,which also appear in Table 5.Fig.7A presents the profiles for the IV TCZ clinical solutions at 6 mg/mL and 4 mg/mL and the profile for the medicine(IV TCZ 20 mg/mL).The solutions were prepared from a different batch(Batch 1)to the medicine(Batch 2).The similarity between all the profiles for IV TCZ solutions is evident.For its part,Fig.7B highlights the similarity between all the profiles for the SC TCZ solutions,regardless of the dilution applied to the medicine or the particular batch.The charge variant profile was also found to be unaffected by the batch of the SC medicine(Batch 1 or 2)used to prepare the clinical solutions(Fig.S3).The average abundance of the acidic,neutral and basic variants of TCZ in the IV medicines was practically the same as that in the IV TCZ clinical solutions.The same pattern was also observed in SC medicines and SC clinical solutions(Table 5).
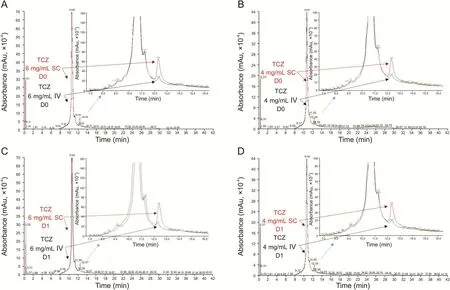
Fig.5.CEX comparability study of 6 mg/mL and 4 mg/mL TCZ IV and SC clinical solutions.Charge variant profile:(A)6 mg/mL D0,(B)4 mg/mL D0,(C)6 mg/mL D1 and(D)4 mg/mL D1 of IV and SC samples shown as overlapping chromatograms and their corresponding expansion.Samples were from IV-batch-1 and SC-batch-1.
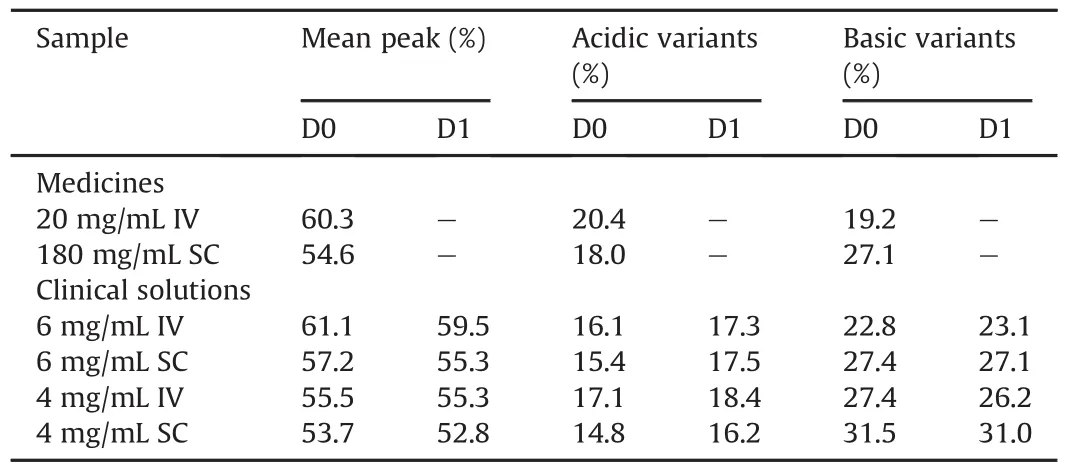
Table 5Average abundances of the main peak,acidic variants and basic variants for different TCZ samples on two different days.
Therefore,taking all these results together,it is clear that the small differences detected between the charge variant profiles for the IV and SC solutions are not due to differences between batches of the same medicine(IV or SC)or to instability promoted by the dilution of the SC medicine to prepare the clinical solutions at 6 mg/mL and 4 mg/mL for intravenous administration.According to the literature[22],these differences,detected above all in the basic variants,are probably due to the use of different clones of the Chinese Hamster Ovary(CHO)cell lines used to produce IV or SC TCZ.Miao et al.[22]recorded very similar chromatographic profiles of TCZ to those recorded in our research,which demonstrates that the differences were due to the fact that the different formulations of TCZ were manufactured using different CHO clones.
The CEX chromatograms for all the SC TCZ solutions produced another interesting result.A high peak was detected in the front at 0.31 min for the medicines from the two different batches and the clinical solutions at 6 mg/mL and 4 mg/mL.This must therefore correspond to a non-retained compound.It was confirmed that this peak was in proportion to the TCZ charge variant(by measuring the areas under the unknown peak and the TCZ variants peak,Table S1)in all the samples analyzed,including the two medicines from the two different batches.This means that this unknown compound is already present in the SC medicines and dilutes in the same proportion as the sample does.It was not detected in any of the IV TCZ samples.It was also confirmed that this compound is not of a protein nature since it was not detected in the chromatogram registered at 280 nm,the typical and specific UV absorbance maximum for protein(Fig.S4).
3.4.2.Comparability study of the stress tests on the 6 mg/mL IV and SC TCZ clinical solutions
The degradation of TCZ was very similar in both 6 mg/mL clinical solutions prepared from IV or SC medicines with small variations with respect to the control(unstressed)samples,except for the solution subjected to acidic stress in which the stress caused a large change in the chromatographic profile,increasing the basic variants as shown in Fig.8.Nevertheless,this could also be due to an experimental or similar error since the degraded basic variant had the same charge variant profile,but with different intensities,in both chromatograms for the solutions prepared from the IV or SC medicines.It is also important to highlight that the basic variant at 12.31 min,characteristic of the samples prepared from the SC medicines,was practically unaffected by the various types of stress applied(except for the acidic stress).
3.5.IT-F:tertiary structure or conformational structure
3.5.1.Comparative study of 6 mg/mL and 4 mg/mL IV and SC TCZ clinical solutions
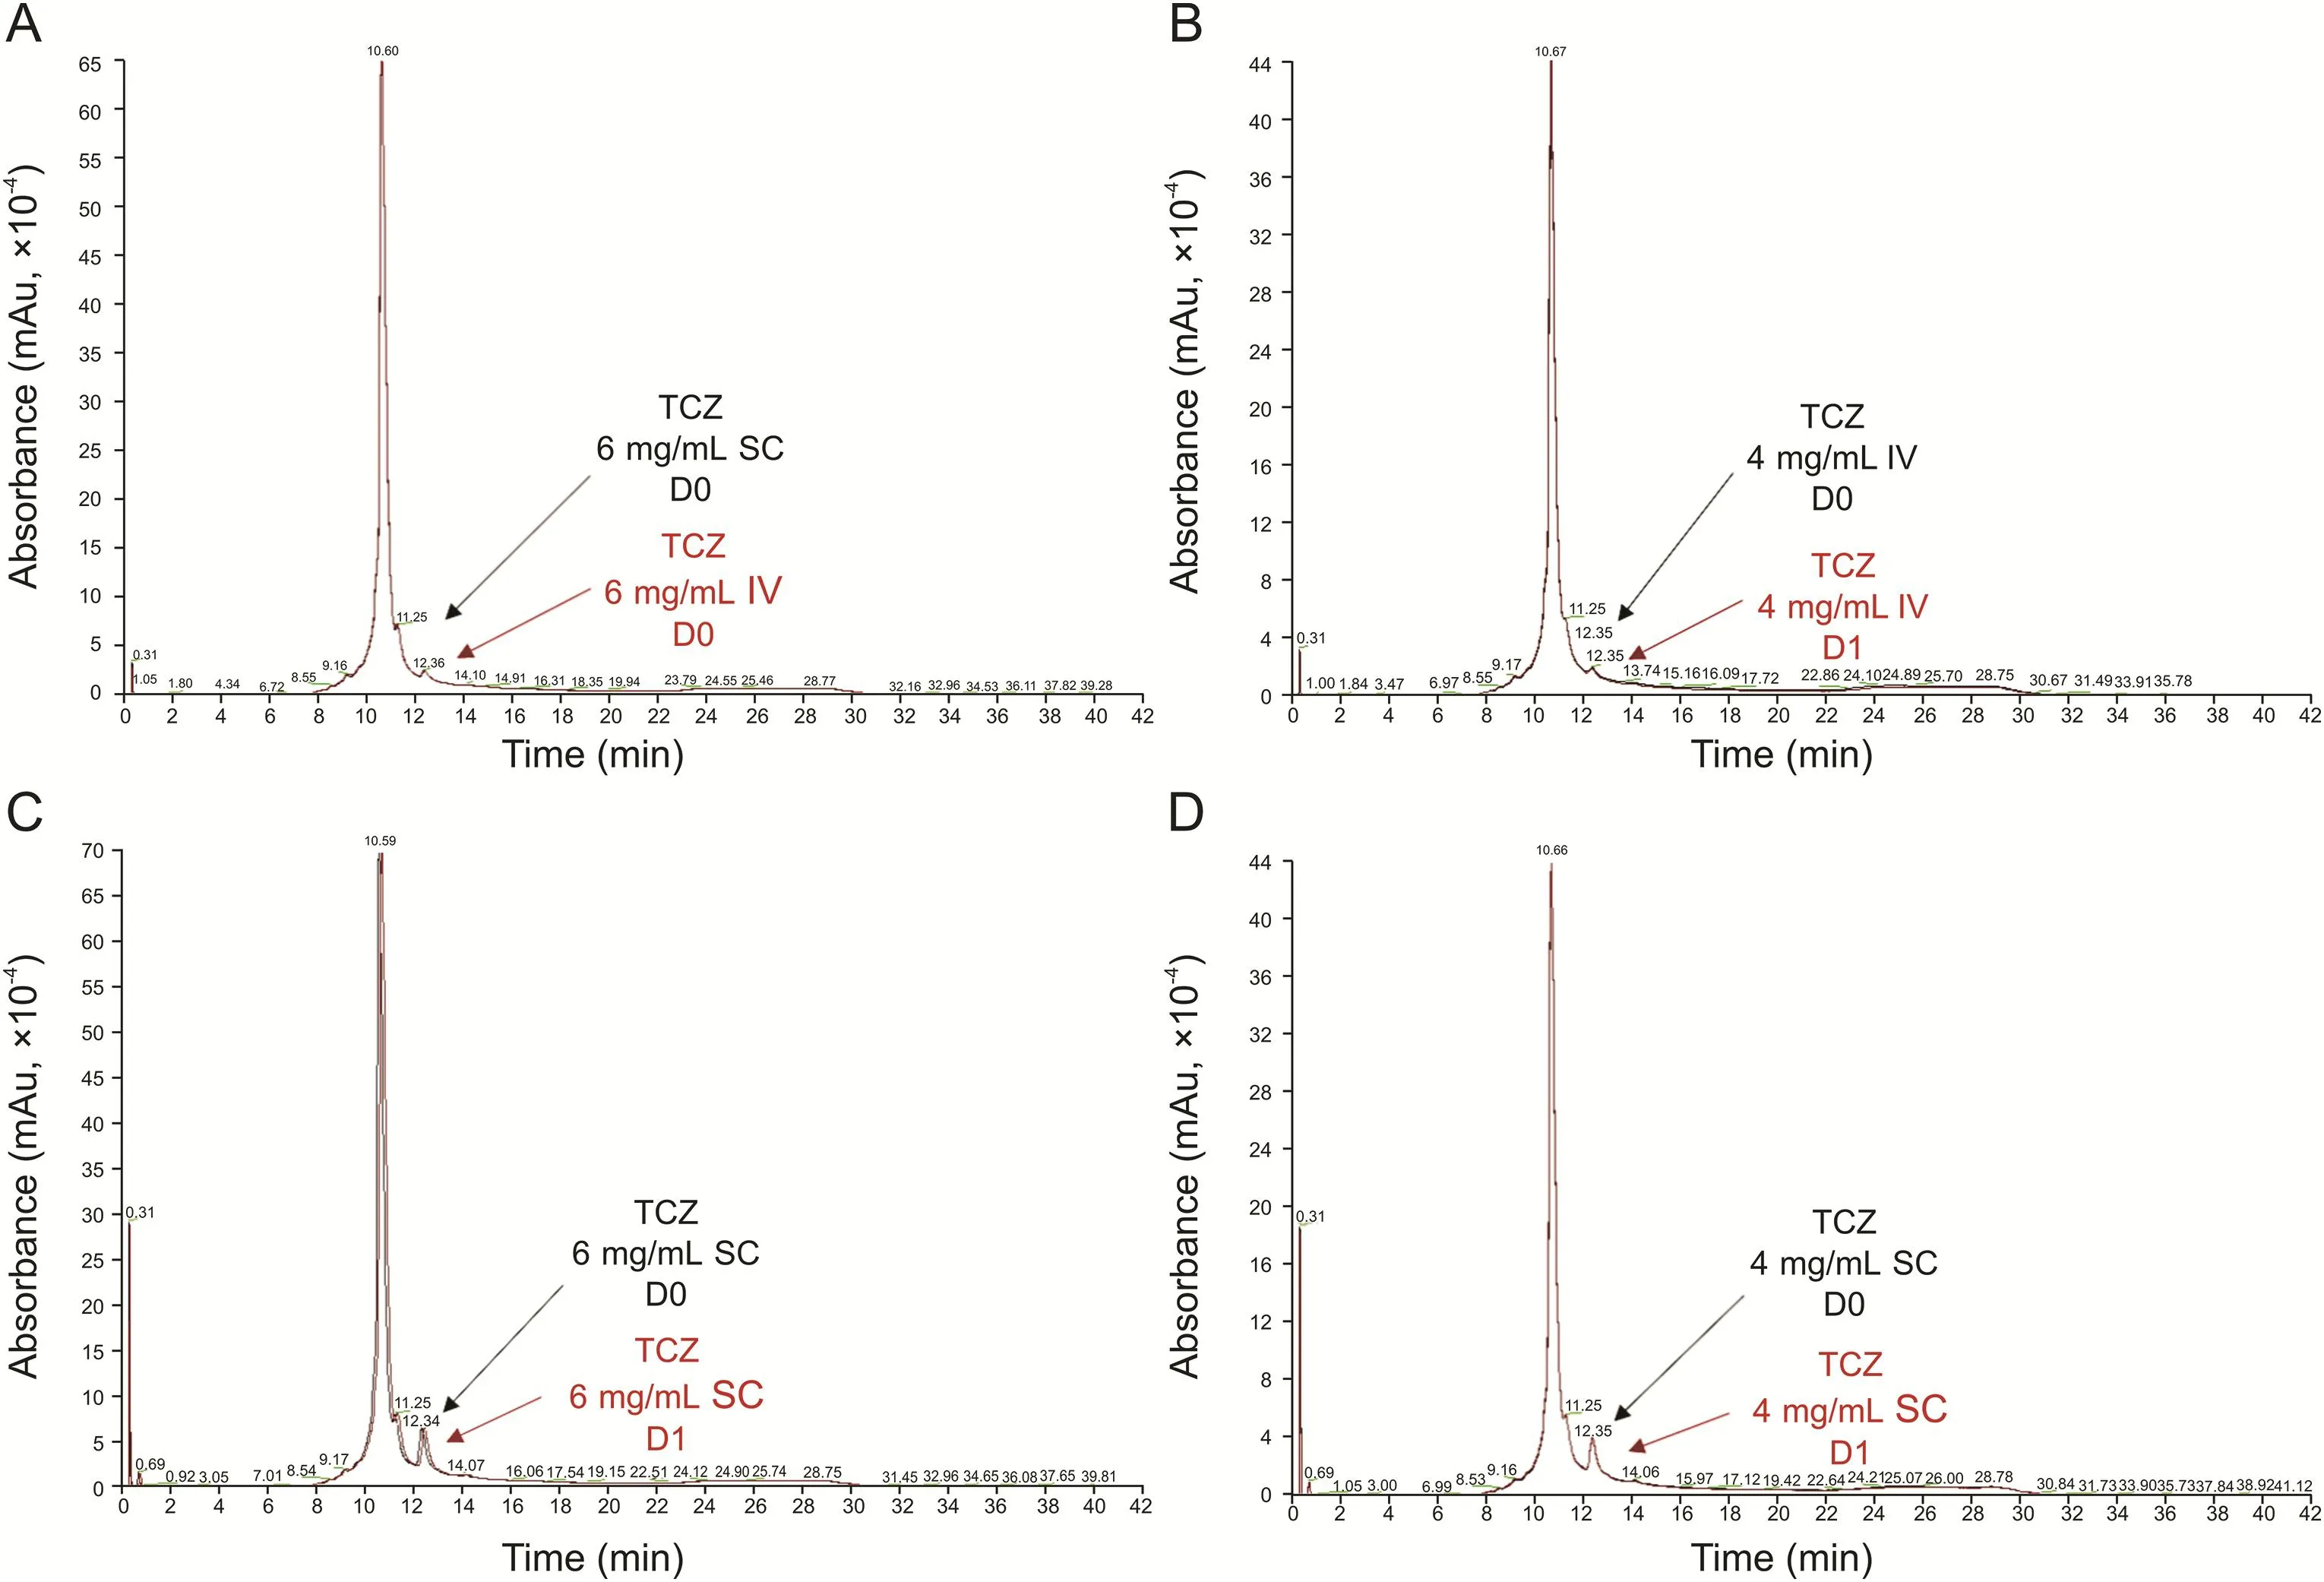
Fig.6.TCZ charge variant profiles:(A)6 mg/mL IV,(B)4 mg/mL IV,(C)6 mg/mL SC and(D)4 mg/mL SC on the D0 and D1 shown as overlapping chromatograms to test comparability stability between IV and SC clinical solutions.Samples were from IV-batch-1 and SC-batch-1.
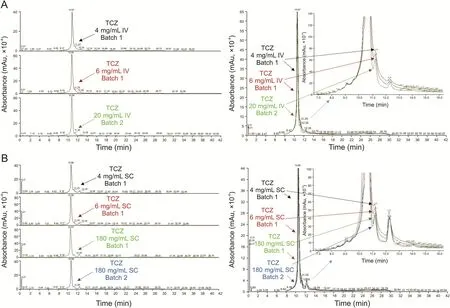
Fig.7.TCZ charge variant profile comparability study.IV and SC medicinal products and 6 mg/mL and 4 mg/mL clinical solutions:(A)IV and(B)SC shown as separate chromatograms(left)and overlapping chromatograms with their corresponding expansion(right).Samples shown are from IV-batch-1 and SC-batch-1 and SC-batch-2.
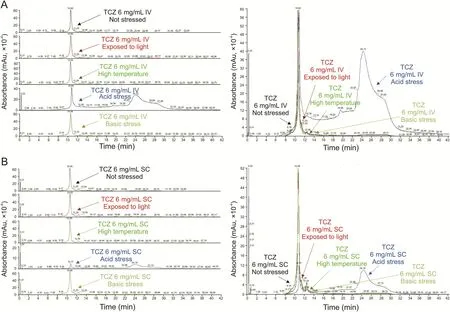
Fig.8.TCZ stress study by CEX.Chromatograms:(A)6 mg/mL IV and(B)SC stressed samples including the non-stressed sample,shown as separate chromatograms(left)and overlapping chromatograms(right).Samples shown are from IV-batch-1 and SC-batch-1 and SC-batch-2.
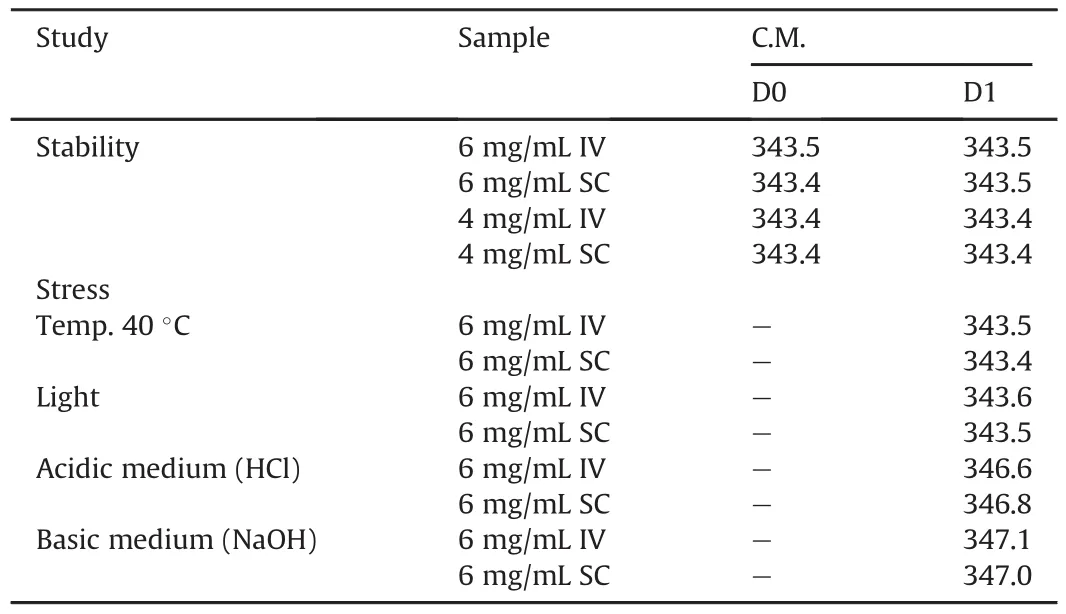
Table 6Spectra center of mass(C.M.)of samples from the stability and stress studies.
Figs.9A and B show the fluorescence spectra for the TCZ solutions.No differences can be observed in these spectra.Nevertheless,in order to conduct a more in-depth analysis,the spectral C.M.was calculated for each recorded spectrum(see Table 6).This parameter is a mathematical representation of each spectrum,in which the spectrum is condensed into a scale.Slight modifications in these spectral C.M.values therefore indicate conformational changes occurring on the protein.The spectral C.M.increases are related to the structural modification on the protein in which tryptophan amino acids are more exposed to the solvent(a modification caused by the denaturation of the protein).The decrease in spectral C.M.is associated with a conformational modification in which tryptophan amino acids are buried inside the protein,in a more hydrophobic environment.
Both fluorescence spectra and calculated spectral C.M.were practically identical in all the TCZ solution samples,therefore indicating that TCZ has the same conformation in all the solutions regardless of the medicine used to prepare them,i.e.,IV or SC.Nor is it affected by the concentration,i.e.,6 mg/mL or 4 mg/mL,the only difference being in the intensity,due to the different concentrations.
3.5.2.Comparability study of the stress tests on the 6 mg/mL IV and SC TCZ clinical solutions
The changes in the conformation of TCZ in the IV and SC solution samples subjected to stress and assessed by IT-F,clearly indicated identical behavior in response to stress(Figs.9C and D,and Table 6).The least affected samples were those subjected to light and to temperature of 40°C;both fluorescence intensity and C.M.remained unaltered in these solutions and similar to those of the control solution.By contrast,significant C.M.increases were observed in the solution samples subjected to an acidic or basic medium.These indicate conformational changes,in both cases,inducing a red shift on the TCZ fluorescence spectra,which indicates that tryptophan amino acids were exposed to the solvent probably due to partial denaturation of the protein.It is important to highlight that when the acidic medium(HCl)was added,the quantum yield increased,but the opposite occurred when the basic medium(NaOH)was added,in that the quantum yield decreased notably.This might be due to quenching events related to the ions that were added.
4.Discussion
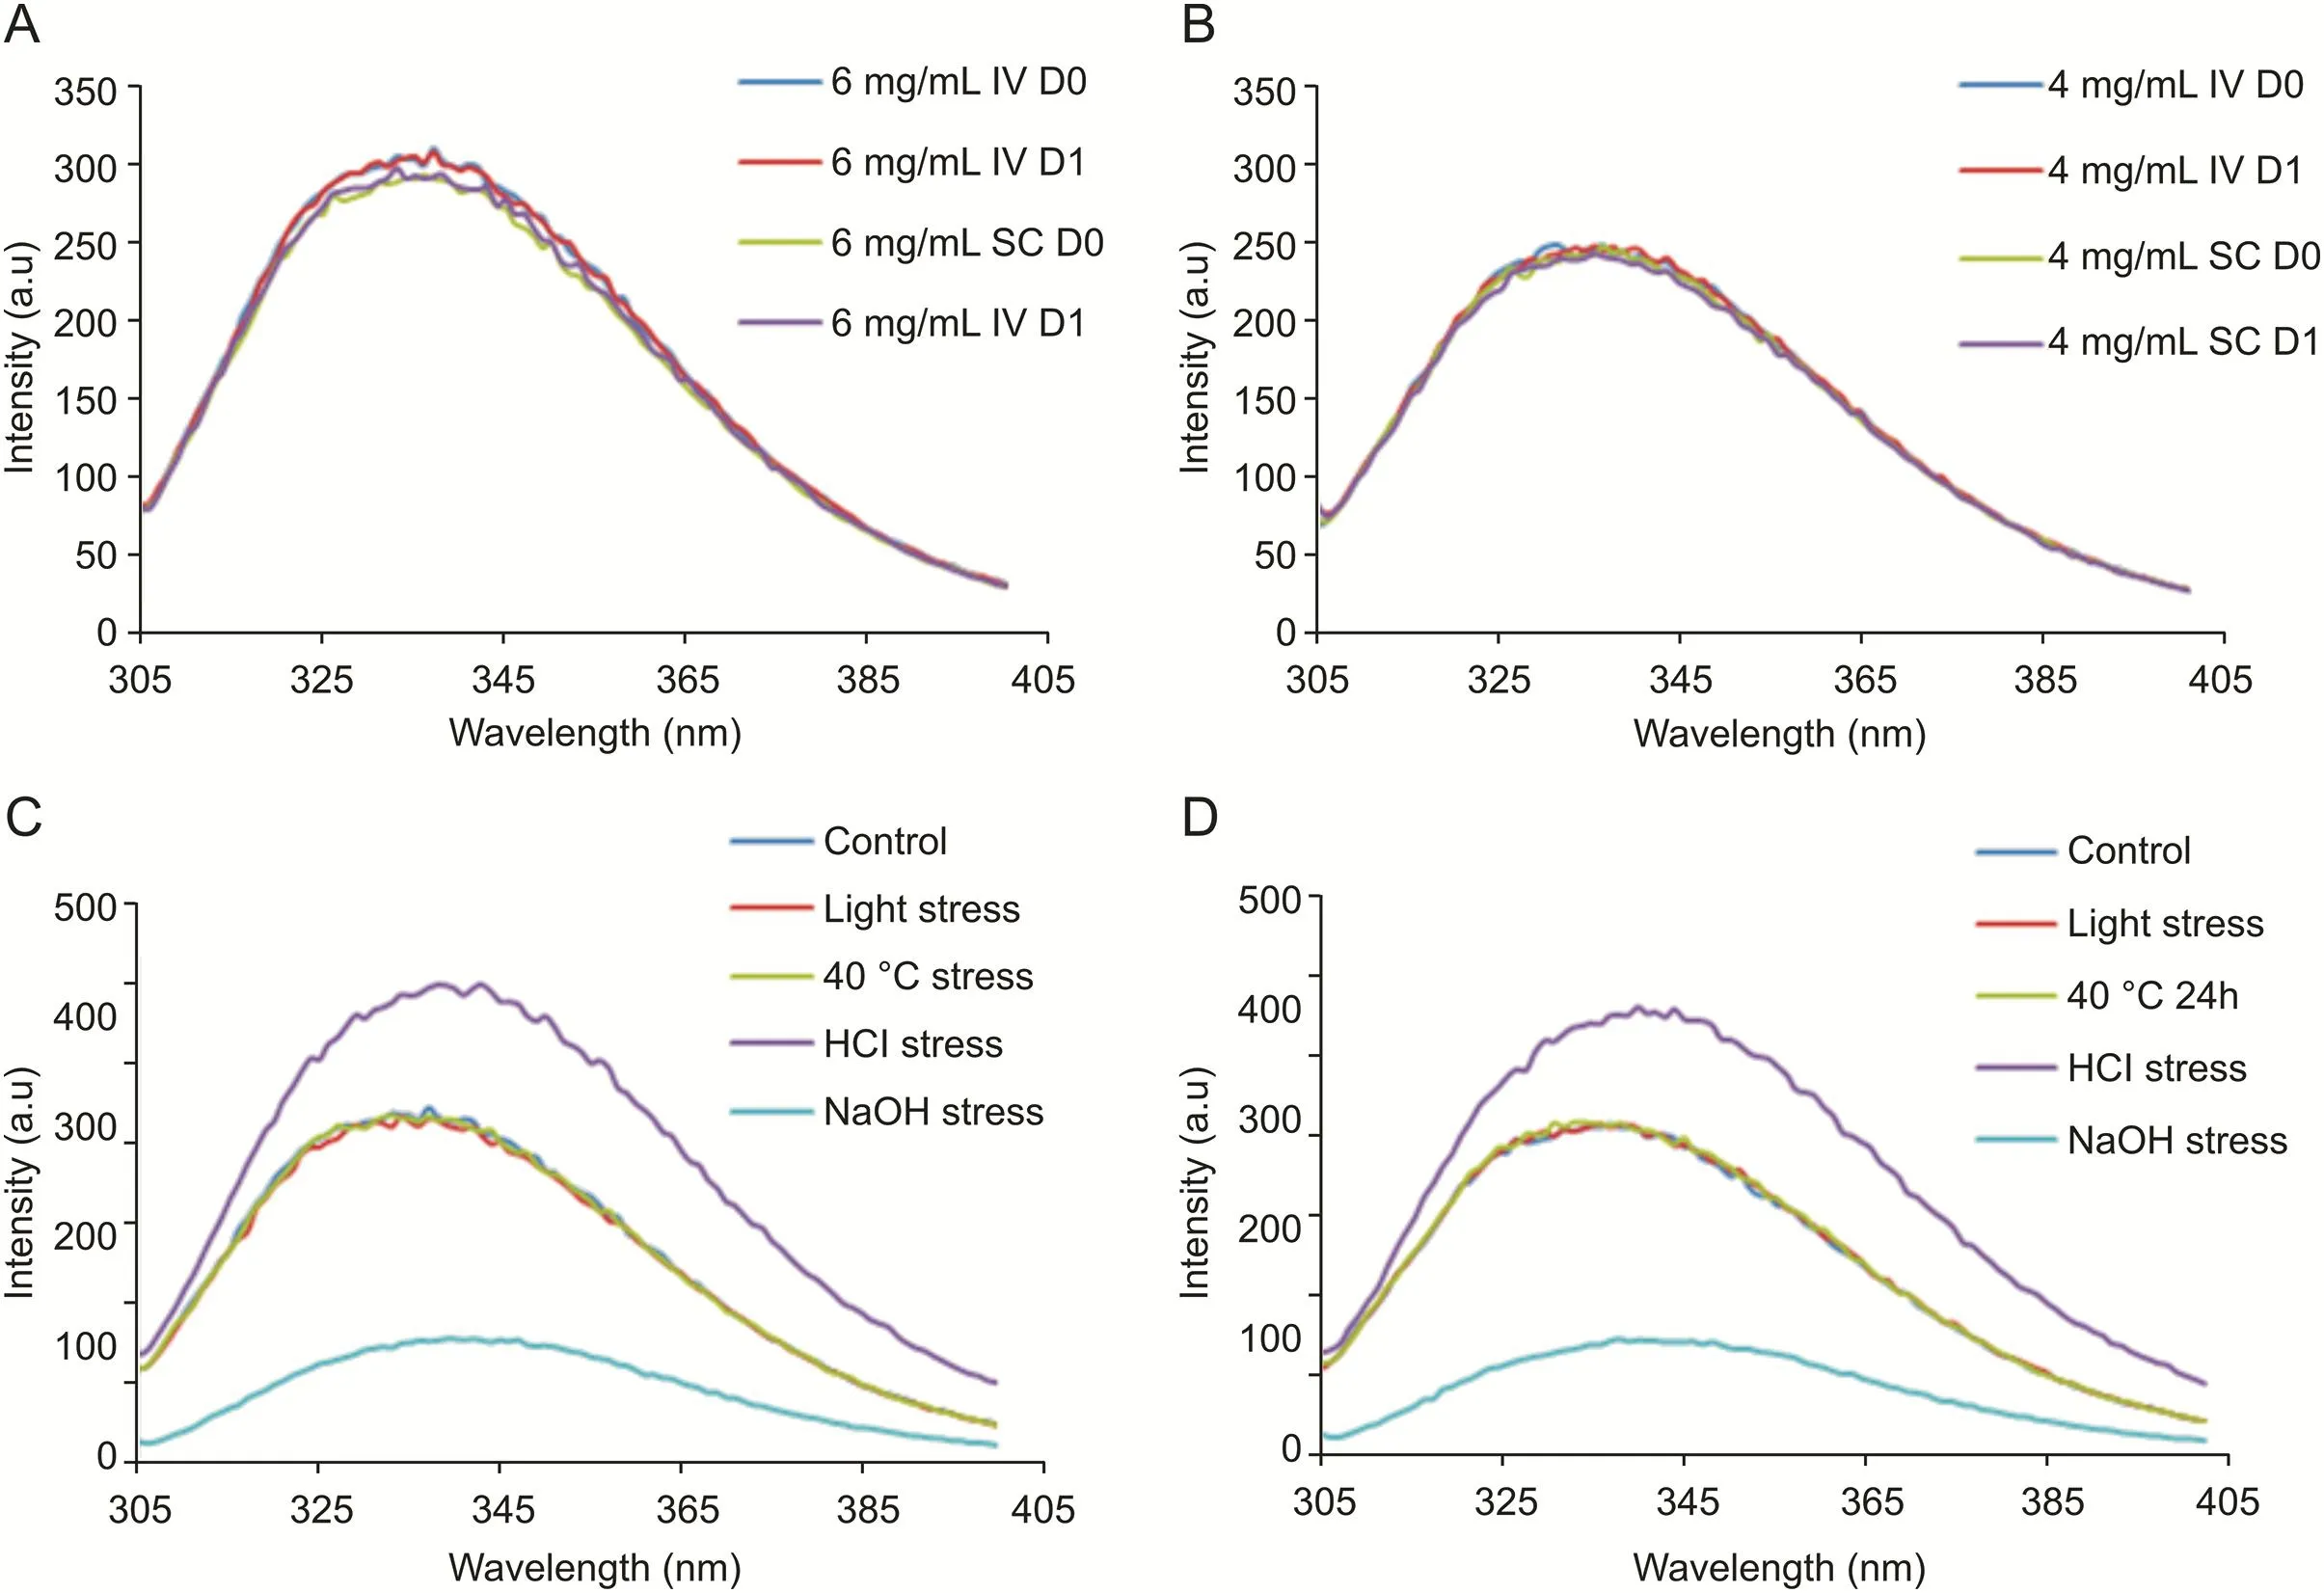
Fig.9.Conformational study by IT-F.Comparative study of the IV and SC clinical solutions(IV-batch-1 and SC-batch-1)fluorescence spectra:(A)6 mg/mL samples at D0 and D1 and(B)4 mg/mL samples at D0 and D1.Stress study.Fluorescence spectra:(C)6 mg/mL IV stressed samples and(D)SC stressed samples.Samples shown are from IV-batch-1 and SC-batch-1 and SC-batch-2.
The active ingredient of the medicinal product RoActemra®in both routes of administration,IV and SC,is TCZ.The TCZ solution for SC administration is supplied as a sterile,colorless to yellowish,preservative-free,liquid solution with a pH of around 6.0(between 5.5 and 6.5).This solution is supplied in a 1 mL ready-to-use,singleuse,prefilled syringe with a needle safety device.Each device delivers 0.9 mL of TCZ solution(162 mg),in a histidine buffered solution composed of TCZ(180 mg/mL),polysorbate 80,L-histidine and L-histidine monohydrochloride monohydrate,L-arginine and L-arginine hydrochloride,L-methionine and water for injections[11].On the basis of the available information in the FDA reviews on the original biologics license applications,the subcutaneous TCZ drug product is manufactured with a process change[27]that does not affect quality attributes such as potency,aggregates order size or charge variants,or the levels of process-related impurities[42]compared to the IV TCZ drug product.The TCZ solution for IV administration[11]has a lower concentration(20 mg/mL)and different excipients(sucrose,polysorbate 80,disodium phosphate dodecahydrate,sodium dihydrogen phosphate dehydrate and water for injections),with a pH of between 6.2 and 6.8.Therefore,in order to assess the possible use of the SC medicine(180 mg/mL)for preparing clinical solutions of TCZ at 6 mg/mL and 4 mg/mL for IV administration,we focused our study on the impact of the dilution required in 0.9% NaCl on critical physicochemical attributes such as aggregates order size(by measuring visual and soluble particulates,and obtaining SEC profiles),charge variants(by obtaining chromatographic cation exchange variant profiles)and structural conformation(by specific fluorescence measures)by comparing results on the solution for infusion prepared from IV and SC medicines.Also,two different batches of the IV and SC medicinal products(RoActemra®)were used to prepare the clinical solutions for infusion,so as to test the inherent variability of TCZ as a biotechnological drug.Our study also examined the stability of the SC clinical solutions stored refrigerated at 4°C and protected from daylight for 24 h,so as to compare their stability with that of IV clinical solutions,which is accepted as 24 h[11].In order to gather more information about the similarity between these IV and SC clinical solutions,a stress study was performed on the 6 mg/mL solution.This study has also proved suitable for testing the stability of TCZ samples as it detected all the changes that took place.
As regards to aggregates order size,over the 24 h period the solution for infusion prepared using the SC RoActemra®proved to be very similar in terms of product quality and stability to the solution prepared with IV RoActemra®.No visible particulates were detected in any of the solutions for infusion,nor did we observe aggregates(assessed by DLS and SEC)that were larger than the natural soluble aggregates.In addition,these natural soluble aggregates were detected(by SEC)in the same proportion(natural aggregates/monomers)in the clinical solutions as in their respective medicinal products,IV and SC.The particle population was mainly TCZ monomers with comparable hydrodynamic volume.No differences were detected in the solution prepared for infusion when samples at the same concentration were compared.The only difference was the detection of an unknown compound of nonprotein nature in all the SC solutions(not detected at 280 nm in either SEC or CEXC),with an estimated molecular weight of around 15 kDa(by SEC)and a non-basic nature(not retained in CEXC).This unknown compound was also detected in the two batches analyzed of SC RoActemra®,always in proportion with the TCZ concentration,and this proportion was maintained after dilutions.The latter was corroborated by SEC and CEXC results.The unknown compound was not detected in any of the IV solutions.
No major differences were detected in the chromatographic charge variant profile of the solution prepared for infusion using the SC RoActemra®compared to that for the solutions prepared with the IV medicinal product.An increase in one of the minor basic variants was observed in all the SC samples analyzed,always in the same proportion;this difference in the charge variants is probably due to the use of different CHO clones in the manufacture of TCZ,as indicated in Ref.[38]where a very similar charge variant profile to that found in our solutions of SC TCZ is shown.In previous research[22]it was proposed that the deamidations detected for the TCZ originator occur at various asparagine positions,in both heavy and light chains,and the levels of this process were observed to be comparable in the TCZ originator and the HS628 biosimilar.In this case,both TCZ and HS628 showed similar charge variant profiles to those obtained here for all the IV solutions.Regardless of this difference in the charge variants,all solutions demonstrated great stability over the 24 h period.
The fluorescence technique was used to compare the tertiary structure of TCZ in the solution prepared for infusion from IV and SC medicines,providing a reliable assessment of higher order structure integrity,which was shown to be comparable in both solutions,also proving their stability.It was therefore not necessary to analyze the medicinal products themselves,since all the solutions provided high levels of comparability both in terms of the fluorescence spectra obtained and in terms of stability,with no differences detected that require further investigation in the medicinal products or batch to batch.
As regards to the stress study conducted on the 6 mg/mL clinical solution prepared from IV and SC TCZ medicines,the results indicated high levels of comparability between the two solutions in terms of degradation patterns.All the solutions were resistant to degradation when submitted to 40°C for 24 h.Light induced aggregation was detected by SEC,but not by DLS.As expected,acidic(pH=1.87)or basic(pH=11.04)media promoted the highest degradation on TCZ;both media increased the aggregates detected by SEC,but the acidic medium degraded TCZ more,in that an important decrease in the monomers was detected by SEC,and a great disruption in the charge variant profile was obtained by CEXC.The tertiary structure was also disrupted at these pH values.The TCZ charge variant profile in the basic medium promoted some degradation,although not as much as expected and less extensive than observed in the acidic medium.The samples prepared with IV medicinal products experienced similar degradation to those prepared with SC in all the stress tests to which the TCZ samples were subjected.An interesting additional finding was the resistance to degradation of the unknown compound detected in the SC samples,which was detected by both SEC and CEXC in unaltered condition.
5.Conclusion
The research presented here revealed high levels of similarity between the critical physicochemical quality attributes of the clinical solutions of TCZ at 6 mg/mL and 4 mg/mL prepared for infusion using the SC medicinal product(RoActemra®162 mg)and those of the clinical solutions of TCZ at 6 mg/mL and 4 mg/mL prepared for infusion using the IV medical product(RoActemra®20 mg/mL).The SC clinical solutions also demonstrated high comparability with the IV clinical solutions in terms of stability over 24 h and degradation patterns when subjected to controlled degradation studies.
The minor differences detected between the IV and SC TCZ clinical solutions were already present in the medicinal products used to prepare these solutions,and were not related to the dilutions;they are not batch-to-batch related and instead are directly related to the medicinal product,i.e.,IV or SC used.TCZ in its SC form(RoActemra®162 mg)does not therefore suffer any degradation as a consequence of its dilution in 0.9% NaCl to prepare the clinical solutions diluted at 6 and 4 mg/mL for infusion.The dilutions of the excipients did not affect the stability of the diluted solutions over 24 h,when stored refrigerated at 24°C protected from daylight.
In view of all the above,we can conclude that in our study we found no evidence that would advise against the recommendation of using TCZ in its SC form RoActemra®162 mg to prepare diluted solutions in 0.9% NaCl at 6 and 4 mg/mL to be used for intravenous administration.This means that in the event of a shortage of IV RoActemra®20 mg/mL,as happened during the COVID-19 emergency,the solution contained(0.9 mL)in the prefilled syringes of SC RoActemra®162mg can be used to prepare the solutions diluted in 0.9% NaCl required for intravenous infusion.
Declaration of competing interest
The authors declare that there are no conflicts of interest.
Acknowledgments
This study was partially funded by Project FIS:PI-17/00547(Instituto Carlos III,Ministerio de Economía y Competitividad,Spain),which means that it was also partially supported by European Regional Development Funds(ERDF).Anabel Torrente-López is currently granted a FPU predoctoral grant of reference FPU18/03131 from the Ministry of Universities,Spain.The authors would like to thank the University of Granada(Spain)for the support and for enabling us to use the laboratories at the Department of Analytical Chemistry in the Science Faculty during the hard days of lockdown in Spain.
Appendix A.Supplementary data
Supplementary data to this article can be found online at https://doi.org/10.1016/j.jpha.2020.06.003.
杂志排行
Journal of Pharmaceutical Analysis的其它文章
- Challenges for cysteamine stabilization,quantification,and biological effects improvement
- Offline two-dimensional liquid chromatography coupled with ion mobility-quadrupole time-of-flight mass spectrometry enabling fourdimensional separation and characterization of the multicomponents from white ginseng and red ginseng
- Single-run reversed-phase HPLC method for determining sertraline content,enantiomeric purity,and related substances in drug substance and finished product
- Development of a UHPLC-MS/MS method for the quantification of ilaprazole enantiomers in rat plasma and its pharmacokinetic application
- Discovery of human coronaviruses pan-papain-like protease inhibitors using computational approaches
- Vancomycin pretreatment attenuates acetaminophen-induced liver injury through 2-hydroxybutyric acid
