一种用于活体检测模拟黑色素瘤边界的高度集成化的智能光纤光谱仪
2021-01-09陆兆荣蓝银涛陈天彬傅洪波
李 腾,陆兆荣,李 治,邱 婷,蓝银涛,陈天彬,向 湘,傅洪波,张 建
(广州医科大学基础医学院生物医学工程系,广州 511436)
Melanoma is a malignant tumor originated from melanocytes or their progenitor cells, which has a high degree of malignancy and is more common in the skin[1-3]. Melanoma can also occur in different parts or tissues of the mucosa (including visceral mucosa), uveal membrane and pia mater (the soles of the feet, toes, fingers and under nails)and mucous membranes (nasal cavity, oropharynx, upper and lower digestive tract, etc.)[4-5]. Global cancer statistics in 2018 illustrate that more than 280 000 new skin melanoma cases worldwide, accounting for 1.6% of the total new cancer cases. Global deaths are more than 60 000, accounting for 0.6% of total cancer deaths[6-7]. Although the incidence and mortality of melanoma are not so high, they are increasing year by year at a growth rate of 6% to 7%.Especially in China, the incidence of melanoma is increasing rapidly, with about 20 000 new cases each year[8]. The symptoms of melanoma can be summarized as an ABCDE rule, which is asymmetric, border is irregular, color is uneven, diameter is large (diameter > 6 mm) and elevation[9].Although high-resolution skin confocal microscopy can distinguish the type of skin pigmentation from the microstructural level[10-11]. Nevertheless, the problems of low depth and high cost of skin confocal microscopy remain to be solved[12]. Dermoscopy is the most widely used method to assist the diagnosis of melanoma[13-14]. Modern dermoscope has transitioned to digital imaging modality and improved imaging quality through the use of polarized light imaging[15]. However, dermoscopy-based melanoma diagnosis is still accompanied by a lack of quantitative indicators[16]. It’s well known, optical spectroscopy is a highly sensitive technique for distinguishing colors[17], and it can also re fl ect differences in the composition of substances[18].A large number of studies have shown that there is a significant difference in the spectral information between normal tissue and cancerous tissue[19-21]. Roman spectroscopy, fl uorescence spectroscopy and scattering spectroscopy have been successfully used for distinguishing melanoma[22-24],but most of reports needed to usein vitrosample or even dyed the sample that is inconvenient for clinical diagnosis.
Fiber optic spectrometer (FOS) uses optical fiber for light coupling, which transports light from light source to sample, and collects the scattering light to the spectrometer for spectral analysis[25-26]. With its advantages of ultraaccurate detection, high sensitivity, fast speed, and low cost, it is widely used in industry, agricultural biology, and chemistry[27-29]. However, few studies reportedin vivo,label-free and rapid detection of melanoma with FOS system. An FOS system with highly integrated structure and intelligent software that could automatically determine correlation coef ficient was developed in this study. The possibility of FOS system in the detection of melanoma margin was tested byex vivoandin vivoexperiments.
1 Materials and Methods
1.1 Sample preparation
In this study, two experimental samples were constructed for testing the FOS system. Model 1: Hot agar solution(60 mL, 5%) was prepared and equally put into three containers. Then, red, green and blue ink was separately added to these containers and mixed with the agar solution. Finally,a concentric ring phantom was constructed with the three kinds of colored agar. Model 2: BALB/c mice (n=5, male, 6 weeks old) were selected and anesthetized with 1% pentobarbital sodium via tail vein injection. The hair on the back of these mice was gently removed by using a hair pusher and a hair removal cream. High-temperature sterilized blue ink was injected subcutaneously into the back of each mouse.The injection depth was consistent with the actual skin melanoma formation in mice. After one hour, all mice were awake and can eat normally. Significant pigmented area on the back after the ink-injected bubbles disappear. All animal experiments were carried out in accordance with the guidelines on animal research stipulated by the Animal Care and Use Committee at Guangzhou Medical University.
1.2 Fiber optic spectrometer system
The schematic diagram of the FOS system developed in this research is shown in Fig. 1a. A halogen lamp(14 546, Philips, Holland) with broad spectrum was used as the light source for the FOS system. The excitation light and back scattering light were delivered by a costumermade Y-fiber with a core diameter of 1 mm (PG-620, BOJKE Ltd., Shenzhen, China) that had a large bandwidth and low energy loss for light within the region 250~900 nm.Detection handle consisted of the optical fiber and two lenses. The light from the fiber was collimated and focused on the sample surface. According to the reversible principle of the optical path, the backscattered light of the tissue was collected by the same optical fiber. The self-made spectrometer with Czerny-Turner cross structure was used to analyze the scattered light. The scattered photons were collimated by the collimator. The collimated light was decomposed into a spectrum by the plane reflection grating dispersion, and the spectrum was imaged by the focusing lens onto the linear array CCD (The wavelength response range is 300~1 100 nm, the integration time is 0.1~1.0 ms, TCD1304, Toshiba Japan). The sample was placed on a two-axis linear stage (LX20, Thorlabs, USA)in order to achieve a large-scale spectrum measurement of the sample. Fig. 1b showed the photograph of our FOS system. The Y- fiber was two millimeters in length and protected by a special metal tube that had great bending ability. The detecting handle was manufactured with 3D printing technology, whose port diameter was 2 mm. The light source, spectrometer and mini-computer were housed in an aluminum alloy box with a volume of 300 cm×300 cm×400 cm as shown in Fig. 2.
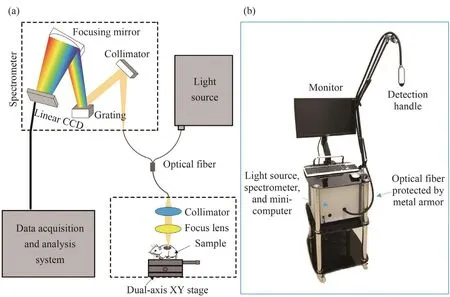
Fig. 1 The schematic diagram (a) and a photograph (b) of the optical fiber spectrometer system
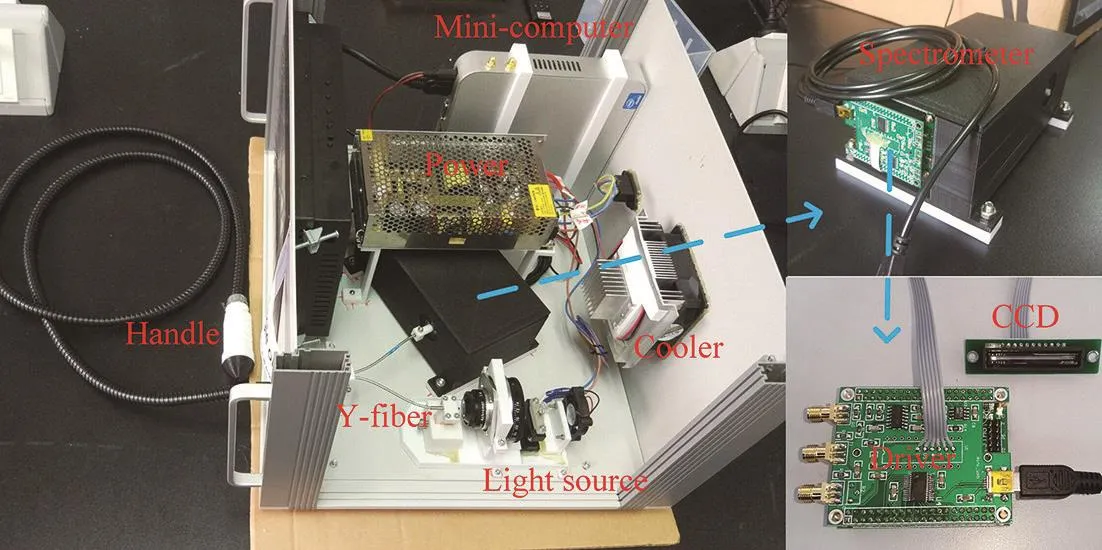
Fig. 2 The internal structure of the FOS system
Fig. 3a showed a low-pressure mercury lamp (HG-1,Wyoptics, Shanghai, China) that was used to calibrate the spectrometer of FOS system. The calibration result was shown in Fig. 3b. The characteristic spectral lines of the low-pressure mercury were 365.01, 404.66, 435.84,546.08, 576.96, 579.07 nm. FOS system could detect all these spectral lines with high sensitive and resolution that veri fied its ability for further application.

Fig. 3 The photograph (a) of the low-pressure mercury lamp used in this study and its spectrum (b) measured by the FOS system
1.3 Data acquiring and analyzing software
Data acquiring and analyzing algorithm was programmed with LabVIEW (Version 2015, National instrument, USA). Fig. 4 showed the interface of the program.The order of the keys from top to bottom was determined by the experimental process of the FOS system. The integration time of the CCD was 70.0 ms by default. It could also be adjusted in real time according to the intensity of the spectrum. The spectrum of the light source was first collected and recorded as a background. Then continuous point-by-point spectrum acquisition at a constant speed until 1 000 spectral data was recorded. The data processing flowchart was shown in Fig. 5. The original spectrum was firstly processed by background subtraction, denoising, smoothing, and normalization. Because of the highest detection sensitivity of the FOS system was in the visible region, only the spectrum of 400~700 nm was used for correlation calculation. Then the correlation between the scanning position spectrum and the reference spectrum could be obtained quickly. The Pearson correlation coefficient was used to match the spectrum of the sample spectrum with the corresponding ink standard spectrum, the greater the absolute value of the correlation coef ficient, the stronger the correlation[30-31]. So the closer the correlation coef ficient was to 1 or -1, the stronger the correlation, and the closer the correlation coef ficient is to 0, the weaker the correlation.
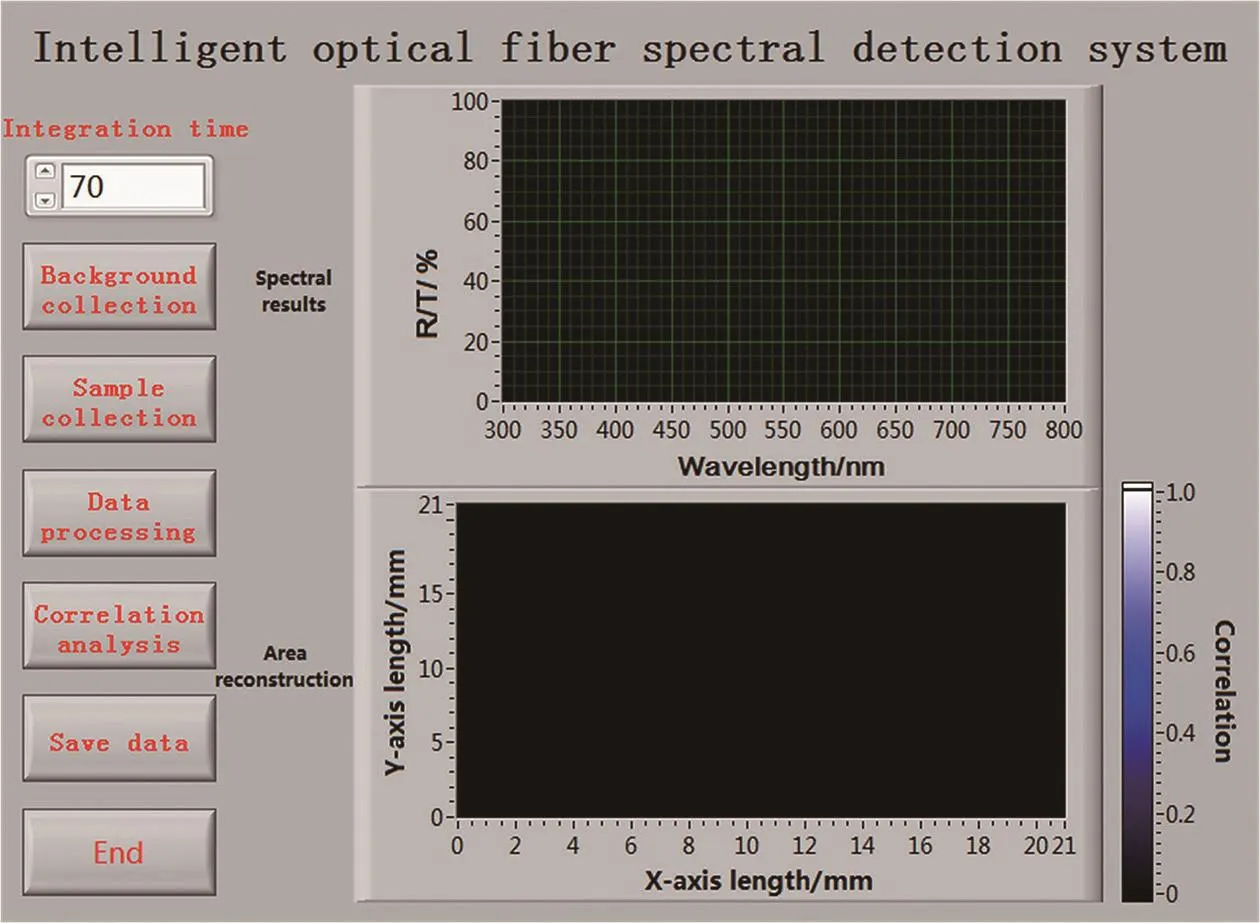
Fig. 4 Software interface of the FOS system
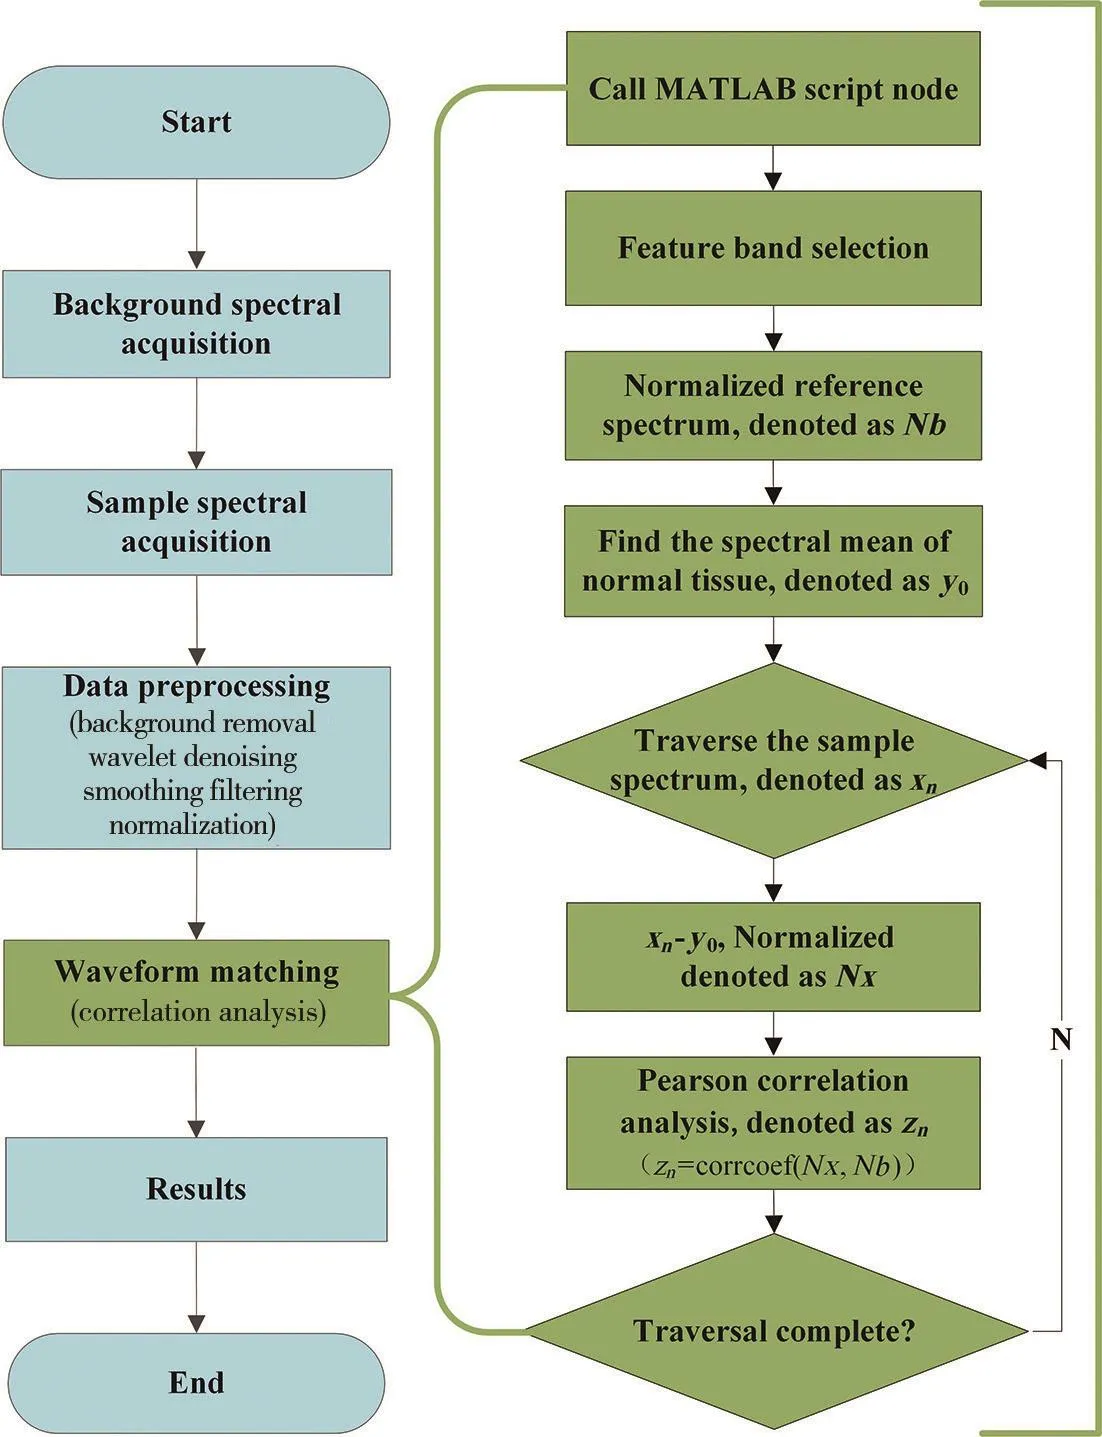
Fig. 5 Data processing flow chart of the FOS system
2 Results and Analysis
2.1 Ex vivo experiment
The key to realize the intelligent detection is to accurately obtain the correlation coefficient between the unknown spectrum and the standard spectrum. Subsequently,the FOS system was examined byex vivoexperiment. A phantom made of agar and stained with three colors (red,green, and blue) was used in this experiment as shown in the top left corner of Fig. 6a. Green agar, red agar, and blue agar were used to simulate normal tissue, tumor core, and tumor boundary, respectively. Then, FOS system scanned longitudinally along the center of the phantom. Three spectrum were obtained from areas labeled with ① , ② and ③as shown in Figs 6b~6d.

Fig. 6 Spectral discrimination test of the FOS system(a) Photograph of the tricolor agar phantom; (b), (c) and (d) are three scattering spectrums extracted from region ① , ② and ③ by the FOS system.
Significant differences could be seen in the shape of three spectrums. Large value in the spectrum means high scattering light intensity. The selective light absorption of agar with different colors leads to different low scattering light region in their spectrum. Furthermore, these three spectrums were called by the data processing algorithm as standard spectrum for color recognition based on correlation coefficient. Another 50 spectrum were extracted randomly from the tricolors agar phantom, and then the spectrums were identified by the correlation algorithm. When the threshold value of correlation coefficient was 0.9, the recognition accuracy was 82%. When the threshold value of correlation coefficient was 0.8, the recognition accuracy could reach 96%. However, when the correlation coefficient threshold was set to 0.7, the accuracy decreased to 84%. Theex vivoexperimental results indicate that the correlation coefficient has an effect on the recognition accuracy. The number of standard spectrum also affects the accuracy of recognition.Ex vivoexperiments verify the feasibility of FOS system for color recognition based on correlation algorithm.
As shown in Fig. 7a, using the system to detect the spectrum of a blue card under different thickness of agar.The phantom materials used consisted of intralipid as scatterer and India ink as absorber with agar powder for solidifying the intralipid and India ink solution. And spectral results of samples at different detection depths were shown in Fig. 7b. The light passed through agar with different thicknesses to measure the backscattering spectrum. The spectral intensity decreased with the increase of the thickness of the agar. When the thickness of the agar was 5 mm, the spectral characteristics of the blue card at the bottom of the agar could still be clearly shown.
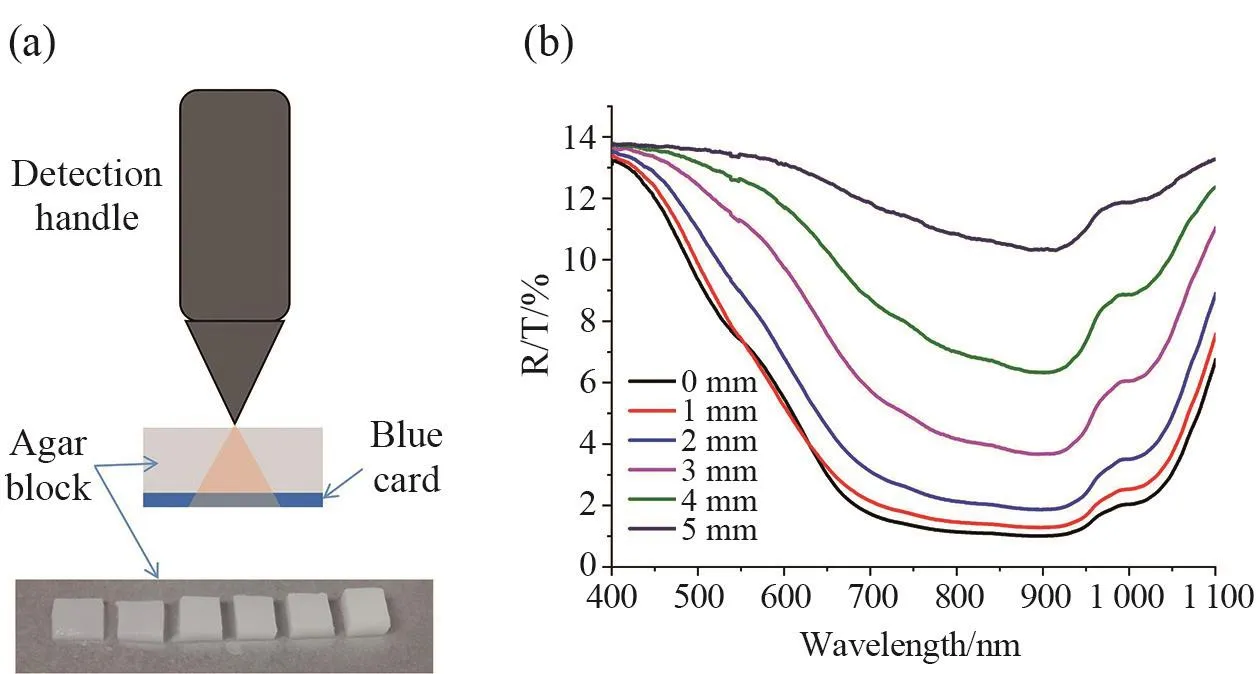
Fig. 7 Detection depth test of the FOS system(a) Schematic diagram of depth detection process; (b) Spectral results of a blue card at different detection depths.
2.2 In vivo experiment
Biological tissue has unique optical characteristics,and its light scattering ability is much stronger than agar.Melanocytes are normal in the skin, and their excessive deposition can cause pigmentation and abnormal reproduction leading to canceration. The FOS system’s ability to detect pigmentation wasin vivotested by using a melanoma mouse model. The result was shown in Fig. 8.
3 Discussion
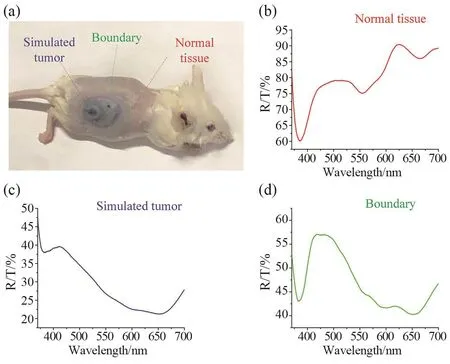
Fig. 8 In vivo experiment based on the FOS system(a) Photograph of mouse with simulated melanoma lesion; Spectrum of normal tissue (b), simulated tumor (c) and bound (d) collected by using FOS system.
A deep staining region could be seen on the back of the mouse clearly as shown in Fig. 8a that was induced by the injection of dark blue ink. In the same way asex vivoexperiment, three spectrums were extracted from the center and the edge of the simulated tumor, as well as normal tissue surrounding the simulated tumor. Fig. 8b showed the scattering spectrum of normal tissue which looks like an upside-down absorption spectrum of the hemoglobin. Because hemoglobin was the main light absorbing substance in biological tissues. Spectrum showed in the Fig. 8c was extracted in the simulated tumor region, which R/T intensity in the 600~700 nm was significantly lower than that of normal tissues due to the strong light absorption of pigmentation within the skin. Spectrum of the boundary (Fig.8d) was a combination of tumor spectrum and normal spectrum that was very consistent with the position of transition region. All spectrums were obtained by using the FOS system with a 70.0 ms integration time. In order to identify areas of pigment deposition, spectrum showed in Fig. 8c was set as standard spectrum in the correlation algorithm.Subsequently, one hundred spectrum were in vivo collected from the melanoma mouse model by step scanning with the two dimensional platform. The scan area was 21 mm×21 mm, each step was 2.1 mm. The obtained spectral data was processed by the correlation algorithm. The correlation coefficient of ten spectrum extracted from tumor region was shown in the Fig. 9a, in which the average was 0.83±0.07. And the correlation coefficient of ten spectrum extracted from normal region was shown in Fig. 9b, in which the average is 0.18±0.05.
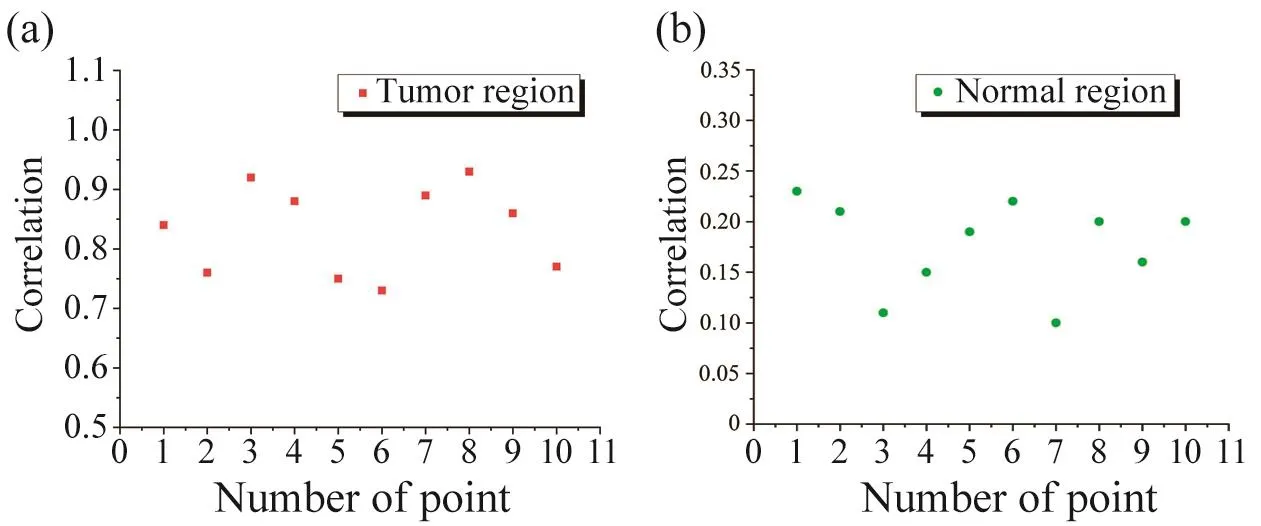
Fig. 9 The correlation coefficient of spectrum extracted from tumor region (a) and normal region (b) with FOS system on the melanoma mouse model
Visualization of tumor boundary is another important capability of FOS system. Since the location of each spectrum was known, a correlation coef ficient map can be constructed as shown in Fig. 10a. A high intensity area with a round boundary could be identi fied clearly, whose diameter was ~14 mm. The diameter of the pigmentation area on the back of the mouse measured with a ruler was ~15.3 mm.The measurement results of FOS system were in good agreement with the actual measurement results. An intensity pro file line was extracted from the black dash line that was shown in Fig. 10b. The reduction of correlation coefficient from tumor region to normal region could be quantitatively evaluated. Because of the large difference in spectrum, the correlation coefficient of some positions in the normal tissue area showed a negative value.

Fig. 10 FOS imaging of the melanoma mouse model(a) Correlation coef ficient map; (b) An image intensity pro file line extracted from the black dash line labeled in the correlation coef ficient map.
FOS system developed in this study has highly integrated structure and intelligent program, and has received comprehensive examination. Ex vivo experiments demonstrated that the intelligent color recognition ability of FOS system can be as high as 96%, and the system can clearly detect the spectrum of the sample under agar thickness of 5 mm, which is a considerable depth of detection. In vivo experiment verified the capability of FOS system for de-tecting melanoma based on simulated mouse tumor. The boundary and size of the pigmentation could be clearly visualized on the correlation coefficient map. In summary,FOS system has great potential to assist the clinical diagnosis of melanoma through quantitative and intelligent recognition of pigmentation.
