快速加热条件下煤和碳酸钙的混合反应动力学研究
2020-11-18朱书骏朱建国李佳容刘敬樟
朱书骏,朱建国,李佳容,刘敬樟
(1.中国科学院 工程热物理研究所,北京 100190;2.中国科学院 力学研究所 高温气体动力学国家重点实验室,北京 100190; 3.中国科学院大学,北京 100049)
0 Introduction
The cement industry is a supporting industry in the construction field. With the rapid economy development,the demand for cement product as an important basic material is being more huge and stable[1]. However,as a high energy consumption and a high pollutant emission industry,the cement industry accounts for a higher proportion of air pollutant emissions,especially the nitrogen oxide(NOx) emissions from the cement industry are second only to the power industry and transportation industry[2]. In order to save energy and achieve low-NOxemissions in the cement production process,the new cement production lines in dry process are mainly adopted in the cement production industries[3]. The new cement production lines in dry process are also known as the pre-decomposition kiln production process[4]. It refers to that an external precalciner is arranged between the suspension preheater and the rotary kiln in the production line. The cement raw material,consisting mainly of limestone,and fuel(approximately 60% of total fuel consumption) flowing out of the suspension preheater are reacted in advance in the precalciner,and the chemical heat released by fuel combustion is used to decompose the cement raw material,which further improve the apparent decomposition rate of cement raw material entering the rotary kiln[5]. At the same time,the heat carried by the high-temperature flue gas flowing out of the rotary kiln is also used to decompose the cement raw material,so the enthalpy of the exhaust gas from the rotary kiln is reused[6].
The main reactant in the precalciner is a mixture of high-concentration limestone and pulverized coal,and the main ingredient of the limestone is calcium carbonate(CaCO3). The decomposition reactions of CaCO3and the combustion reactions of pulverized coal affect the overall combustion and heat transfer characteristics in the precalciner[7]. However,the large-scale experimental research is difficult to obtain the complex reaction characteristics in the precalciner[8]. Therefore,the complicated flow field distribution,the reaction situation and the heat balance in the precalciner are usually studied by means of numerical simulations and theoretical calculations[9-10]. The premise of numerical simulation is the exact experimental data and mathematical models that are suitable for the actual operating conditions,and they are based on the basic data of reaction kinetics. Therefore,the basic decomposition kinetic parameters of CaCO3,especially the mixed kinetic parameters of high-concentration CaCO3and coal,are also needed to acknowledge the heat transfer characteristics and the related heat calculation in the cement precalciner.
Ingraham et al.[11]conducted a CaCO3decomposition experiment at 750 to 900 ℃ on a thermogravimetric analyzer. The results show that the reaction rate of the CaCO3decomposition was controlled by the diffusion rate of carbon dioxide(CO2) through a constant thickness of active calcium oxide(CaO). Gallagher et al.[12]adopted a combination of dynamic and isothermal methods to study the decomposition kinetics of CaCO3in a CO2atmosphere,and the results indicate that the key factor in reaction rate-determining was the heat transport,not the mass transport or chemical process. Hills et al.[13]found that the decomposition reactions of CaCO3occurred on a fixed boundary between the undecomposed carbonate and the porous lime layer formed outside it. The reaction rate was controlled by the heat transfer to the reaction boundary and the transfer of CO. And Rao et al.[14]conducted the CaCO3decomposition experiments at different heating rates on a thermogravimetric analyzer. The results show that the kinetic parameters obtained by the non-isothermal method and the isothermal method were consistent in the temperature range of 680-875 ℃,and the activation energy of the CaCO3decomposition reaction was varied from 169.55 kJ/mol to 126.07 kJ/mol when the heating rate was varied from 10 K/min to 100 K/min,and the reaction activation energy did not change monotonically as the heating rate increased. The above studies have shown that the most probable mechanism of the CaCO3decomposition reaction is the phase boundary model,the random nucleation and subsequent growth model,and its apparent activation energy varies with the reaction conditions.
The current research on the decomposition reaction kinetics in the precalciner is focused on the CaCO3decomposition test on a thermogravimetric analyzer. The experiments conducted in the thermogravimetric analyzer are precise and quantitative[15]. It can obtain complete sample weight-loss curve(TG curve) and weight-loss rate curve(DTG curve) with time,but the heating rate(generally 5-20 K/min) deviates from the actual operating conditions,and the data is unable to directly guide large-scale experiments[16]. When the decomposition experimental research of CaCO3mixed with pulverized coal is carried on a thermogravimetric analyzer,there are two obvious weightlessness stages in the decomposition curve. The CaCO3did not start to decompose until the temperature reached above 600 ℃. However,the pulverized coal in the reaction chamber had partly been burned at this time[17]. Due to the lower heating rate of the thermogravimetric analyzer,the two reactions are performed separately,and the reaction process cannot simulate the actual reactions in the precalciner. While the experiments on the tube furnace platform have the advantages of fast heating rate(above 1×10³K/s) and large sample quality(above 0.5 g)[18-19]. However,it is difficult to track the sample weight-loss curve with time,and visually compare the variations in the decomposition rate with time.
Based on the above discussion,a high-temperature vertical tube furnace experimental system,capable of real-time monitoring the sample quality,is built in this study. When the sample enters the tube furnace,the temperature rises rapidly and the heating rate is in the same order magnitude as the actual precalciner. The combustion reactions of pulverized coal and the decomposition reactions of CaCO3can be performed simultaneously. And the sample weight loss under the mixed reactions of CaCO3and coal can be real-time obtained. The mixed decomposition characteristics can reflect the real situation in the precalciner. In this study,we mainly explore the effects of different mass ratios of pulverized coal to CaCO3on the decomposition reaction rate,and we summarize the mixed decomposition kinetics with different mass ratios,which will enrich the basic data for the design and operation optimization of the precalciner.
1 Experimental
1.1 Test system
The test platform is a fixed-bed reactor system,which is characterized in that the sample is rapidly heated up when it is quickly pushed into the high-temperature tube furnace. The heating process could simulate the heating rate of the sample in the actual production process. And the variations in the weight loss with time under rapid heating conditions could be accorded. The platform has been proven to be able to run stably in the previous study[20].
Figure 1 shows the test system,which is mainly composed of the tube furnace,the temperature control system,the mass measurement system,the gas supply system and the data accord system. The tube furnace is a vertical tube furnace with an inner diameter of 50 mm and a height of 1 000 mm. Four uniformly distributed resistance wires are arranged around the hearth,and the outer side is wrapped with insulation cotton. The furnace temperature can be adjusted from room temperature(approximately 20 ℃) to 1 600 ℃. The temperature control feedback system can accurately keep the operating temperature at the set value. The reaction gas flows into the furnace from the bottom of the vertical tube furnace. After the calculation and the test in the cold and hot states,the volume flow rate of the reaction gas should be set at 0.8 L/min,which can keep the reaction atmosphere constant.
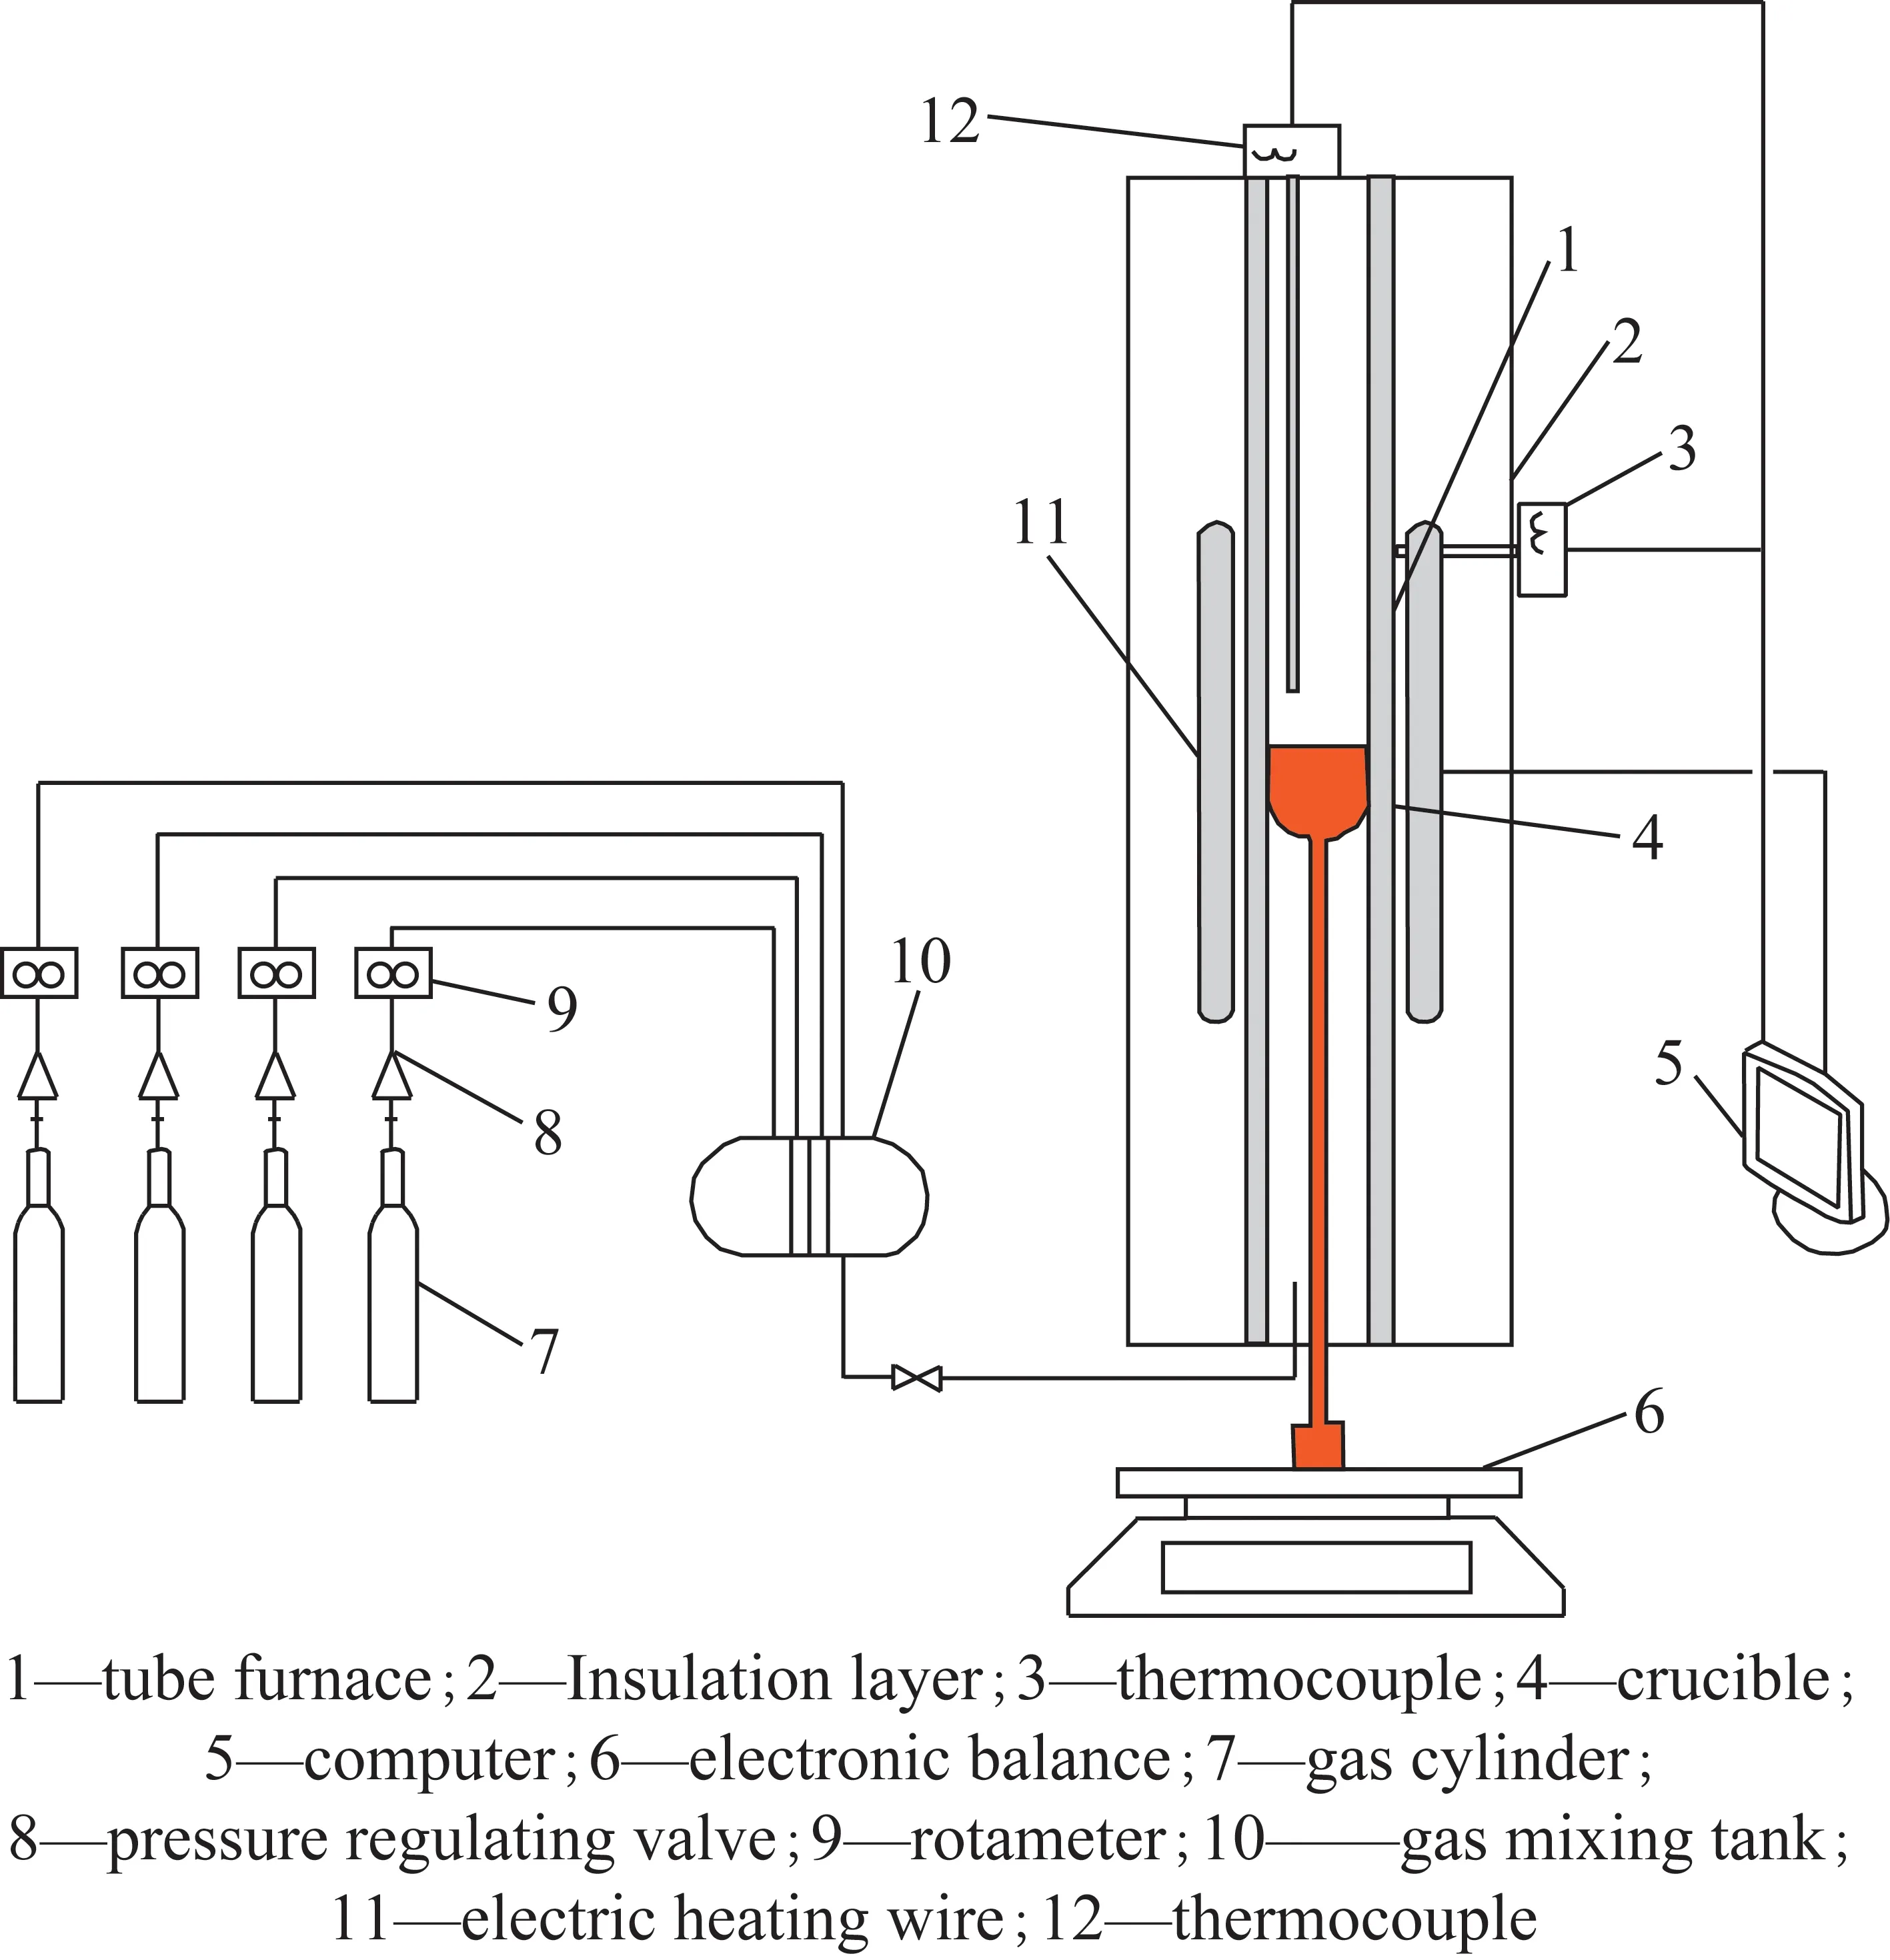
Fig.1 Schematic diagram of test platform
During the test,the sample was put into a small crucible with an inner diameter of 18 mm,and the sample was pushed by the corundum support rod from the bottom of the tube furnace. The support rod is embedded in a cube support,which can stably support the crucible. The crucible-support system is shown in Figure 2. The system is placed on a high-precision online electronic balance with an average response time(s)below 2 seconds,which enables online data collection during the reaction. Because the tube furnace has vibration during operation,the measurement system requires a stable operating environment. Therefore,the measurement system needs to be completely separated from the tube furnace body,and it is constructed on the outside of the tube furnace body. The electronic balance is connected to the computer via an USB to achieve online data collection. After the complete reaction,the crucible was taken out from the bottom of the furnace,and it is quickly cooled in a drying dish for subsequent detection.
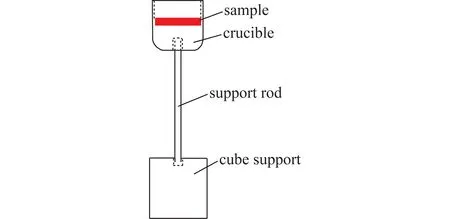
Fig.2 Schematic diagram of crucible-support system
1.2 Experimental conditions
The experimental sample is CaCO3with analytical purity(≥99.0%),which complied with GB/T 15897—1995 standard,and the particle size distribution is 0-0.045 mm. The pulverized coal is Shenmu bituminous coal,and the particle size distribution is 0-0.355 mm. In addition,its proximate and ultimate analyses are summarized in Table 1.
The actual operation temperature range in theprecalciner is between 800 ℃and 1 100 ℃[21]. A qualitative experiment on the CaCO3sample decomposition was conducted during this temperature range before setting the operating conditions. To achieve a higher decomposition rate,the test temperature needs to be around 950 ℃. The test atmosphere is in an air atmosphere(21% O2/79% N2),and the reaction temperatures in tube furnace are 900,950,and 1 000 ℃,respectively. The effects of different mass ratios of pulverized coal to CaCO3on the decomposition reaction rate are carried out under the same atmosphere and temperature. The detailed test conditions are shown in Table 2,and every condition was repeated for three times. Each time the sample quality is controlled at(0.5±0.001) g,and the sample is quickly pushed into the set constant temperature atmosphere,which ensures a faster heating rate of sample.

Table 2 Experimental conditions

Table 1 Proximate and ultimate analyses of coal
In addition,the BET(Brunauer,Emmett and Teller) analysis on the decomposition product was conducted . The basic assumptions are:first,the solid surface is uniform,and multilayer adsorption occurs;secondly,the adsorption heat of each layer except the first layer is equal to the heat of liquefaction of the adsorbate.
2 Results and discussion
2.1 Effect of mass ratio on decomposition reaction
After the sample was put into the tube furnace,two main reactions occurred simultaneously where the coal burned and CaCO3decomposed. The reactions are as follows:
(1)
(2)
Andαis defined as the conversion rate of test sample:
(3)
wheremrefers to the real-time mass of the sample;mfrefers to the final mass of the sample when the reactions are finished;andmirefers to the initial mass of the sample,which is(0.5 ± 0.001) g in this study.
According to the real-time weight-loss data,the conversion rates with time at different temperature and mixing ratio are displayed in Figure 3.
It could be concluded from Figure 3 that the conversion reaction time was shortened with the temperature increasing. It is because the decomposition reaction of CaCO3is endothermic,which means that the high-temperature atmosphere is favorable for the decomposition reactions proceeding in the forward reaction direction. In addition,the variations in temperature had little effects on the coal combustion reaction in this temperature range.
By comparing the conversion trend under different mass ratios,we obtained that the total reaction rate was more sensitive to temperature when the CaCO3mass ratio increased. It could be explained by that the decomposition reaction of CaCO3is more sensitive to temperature than the coal combustion reaction in the temperature range. As a result,the decomposition time was shortened with the CaCO3mass ratio increasing.
The BET theory was adopted to analyze the pore surface area of the decomposition products. The larger the pore surface area,the better the reactivity of decomposition product[22]. In the mixed decomposition process,the specific surface area of the decomposition product was determined by the comprehensive effect of the expansion and collapse of the pore structure of the reaction material. When the quality of pulverized coal was relatively high,the heat release of pulverized coal was higher,which may cause the collapse of the later pore structure. When the quality of pulverized coal was relatively low,the heat released by the pulverized coal was not enough to completely decompose the CaCO3,and the process of releasing gas from the inside during the decomposition of limestone was one of the most important processes for producing a porous structure. Therefore,there is an optimal value for the mass ratio of coal to CaCO3to achieve the largest specific surface area of decomposition product. The results are summarized in Figure 4. It could be found that the pore surface area is largest when the mass ratio of coal to CaCO3is 1∶9,which means that the decomposition product has the highest reaction activity at this ratio.
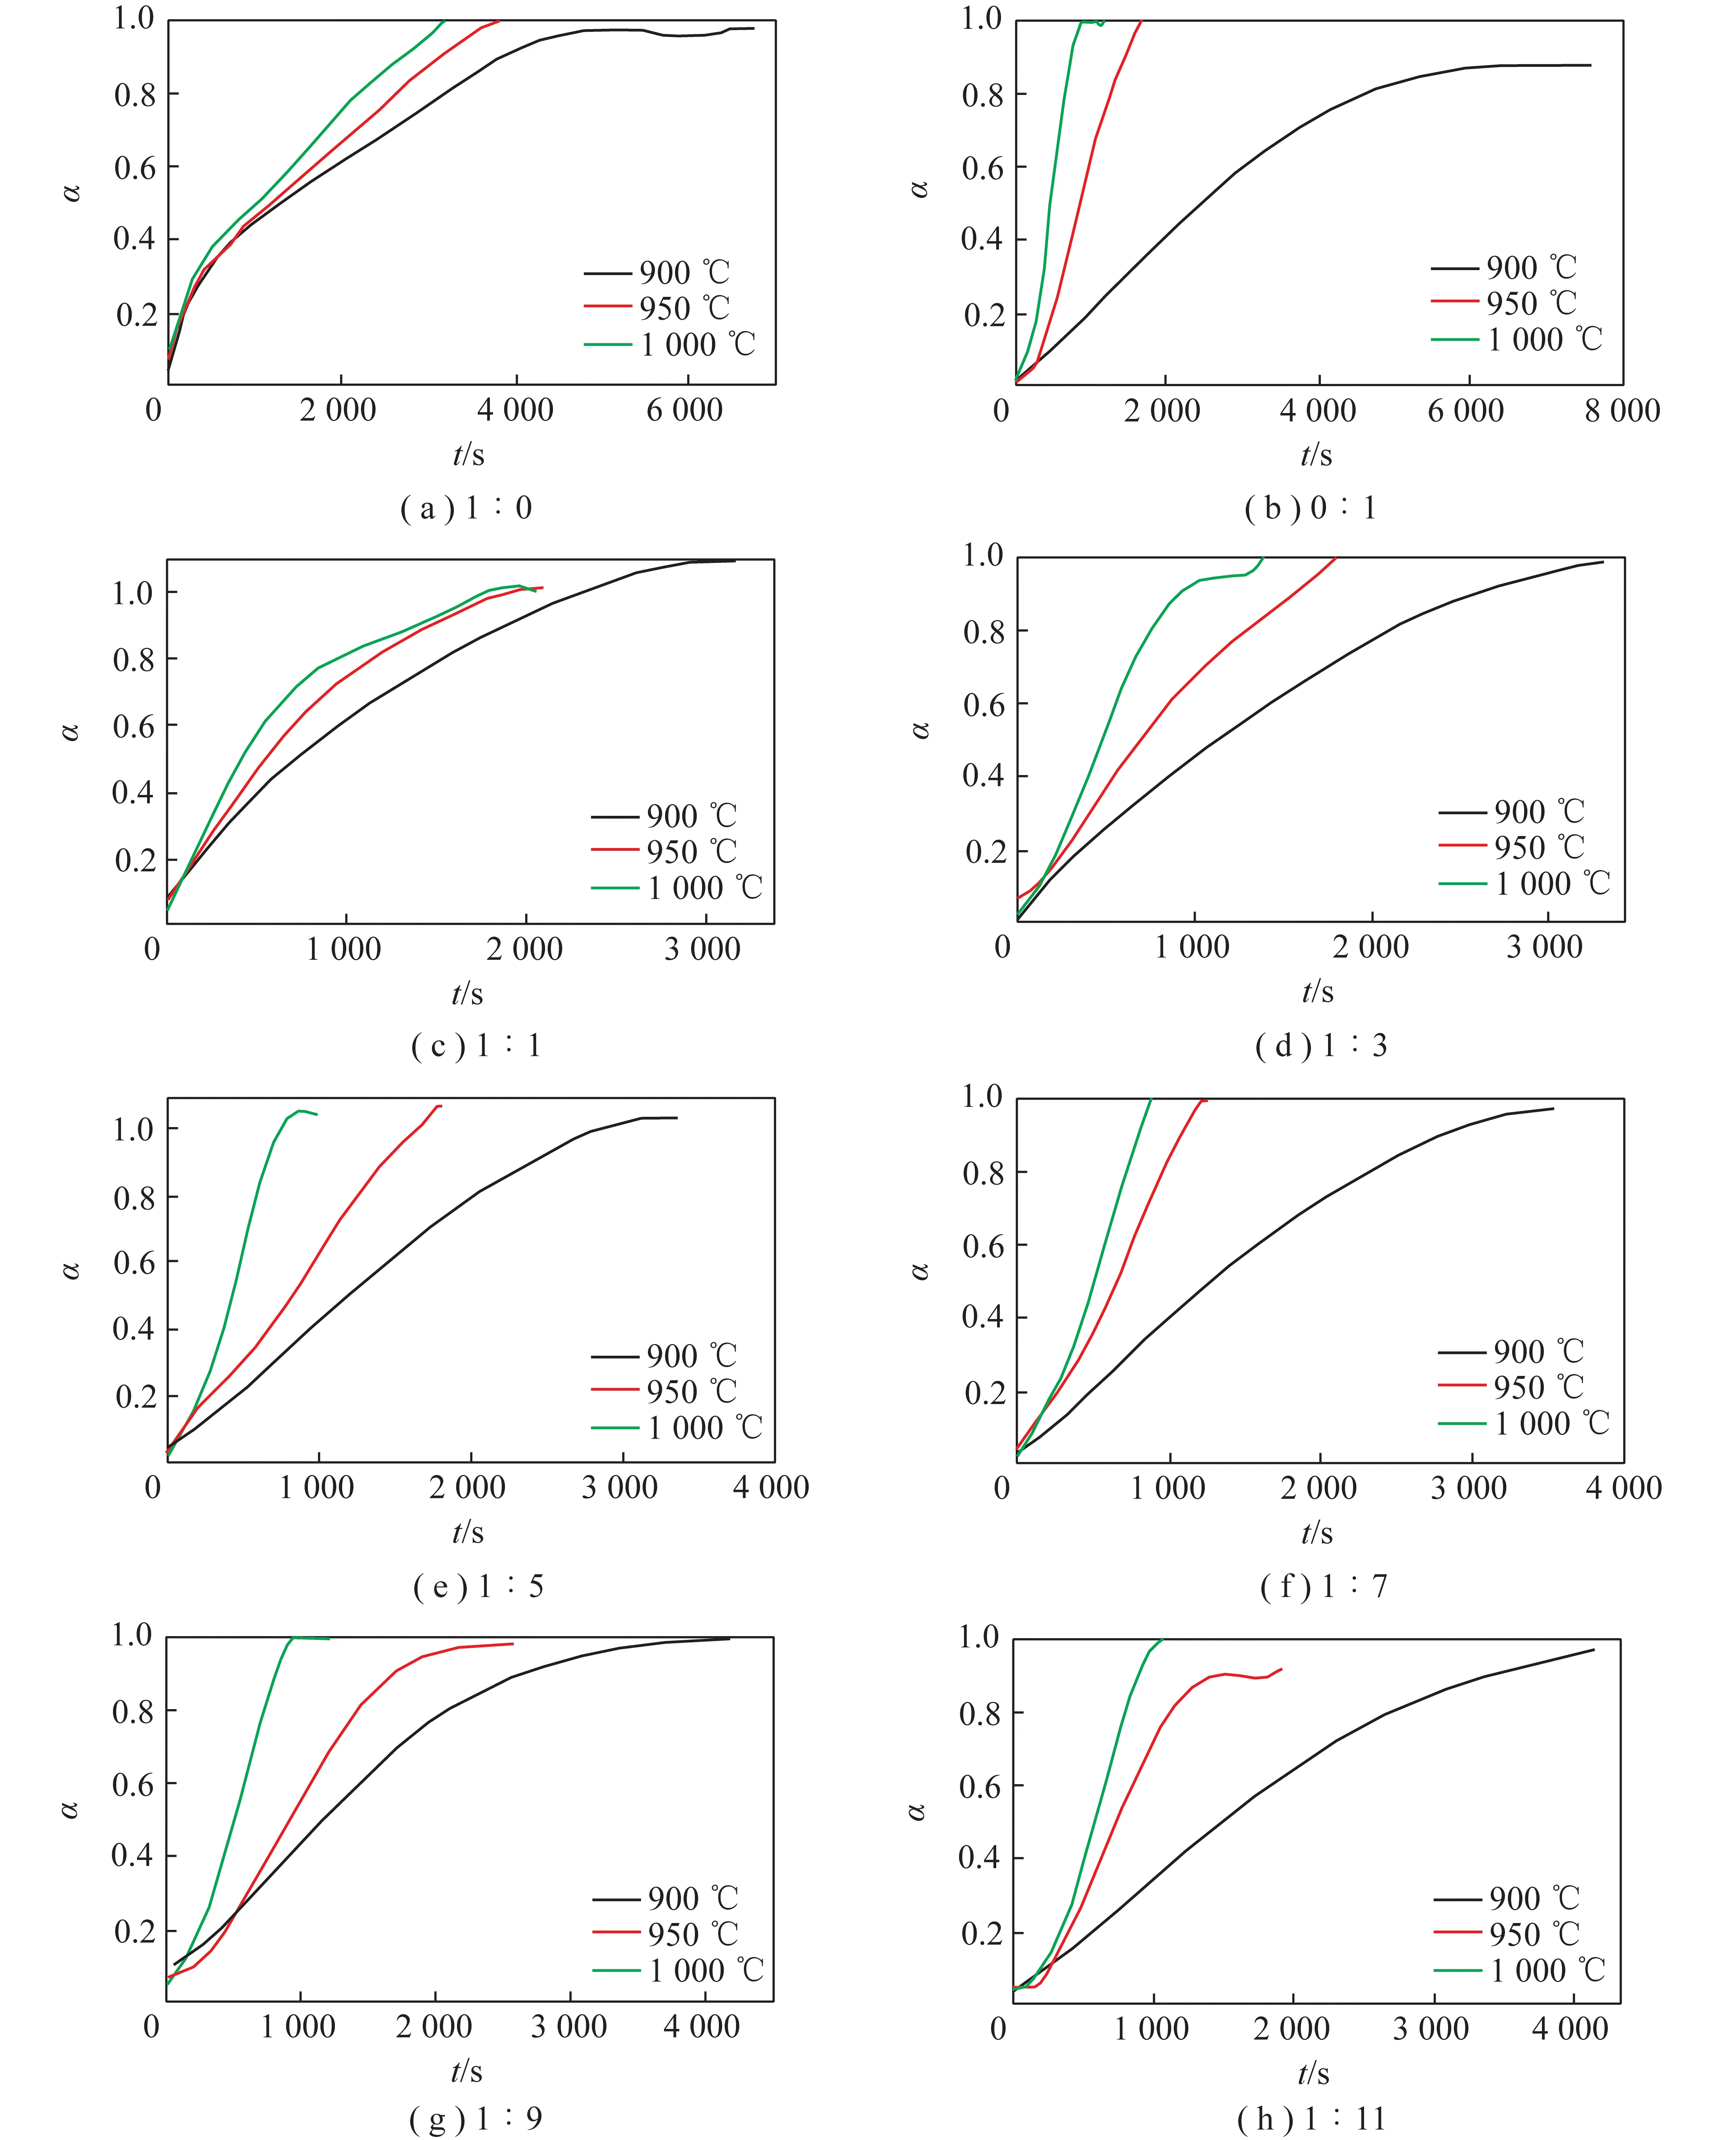
Fig.3 Conversion rates with time at different temperature and mixing ratio
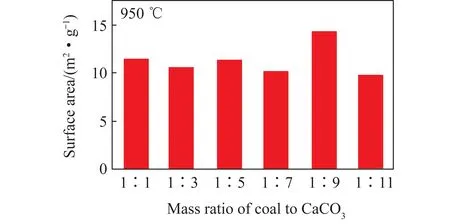
Fig.4 Pore surface area of decomposition products at different mixing ratio
2.2 Apparent activation energy calculation
The weight-loss data was analyzed by the thermal analysis method with constant temperature. The decomposition dynamics function is defined asG(α):
G(α)=kt,
(4)
wherekrefers to the reaction rate,andtrefers to reaction time.
The reduced time graph method is adopted to determine the most probable mechanism function.
(5)
wheret0.5refers to the required time for the conversion to 50%,G(α)α=0.5andG(α)α=1.0refers to the function values when the conversion rate is 50% and 100%,respectively. For typical models,the relation between α andt/t0.5can be derived:
(6)
(7)
(8)
(9)
(10)

(11)
(12)
(13)
(14)
(15)
The experiment data is re-calculated to obtain the actual relation between α andt/t0.5. The results based on the typical models and actual data are displayed together in Figure 5. By comparing each model curve with the test data curve,the model closer to the test result curve is identified as the most appropriate model[23]. In Figure 5,the spot lines refers to the results based on the typical models,and the solid lines refers to the actual data.
Through the comparisons on the different models,the phase boundary reaction model(Rn),the random nucleation and growth model(An),and the random nucleation and rapid growth model(F1) are probable to the actual data. To knowledge the relation betweentandG(α),we plugged the experiment data into the models(F1,A2,A3,R2,R3). Therefore,the reaction rate(k) could be obtained by the linear fitting,whereR2refers to the fitting degree. Figure 6 shows the reaction rates and fitting degrees in different models.

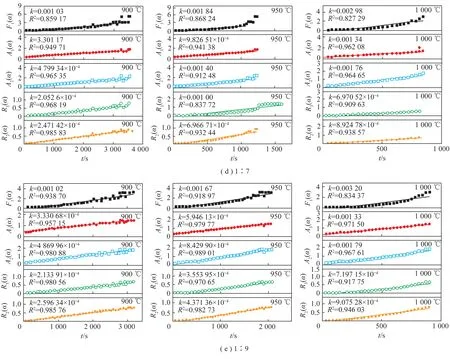
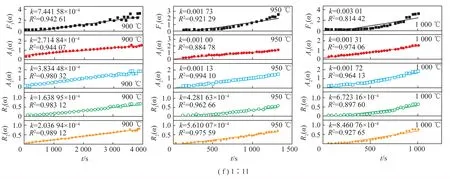
Fig.6 t-G(α) curve of the mixtures at different mixing ratio
The results shows that the most probable kinetic model isR2when the mass ratio of coal to CaCO3is 1∶1 and 1∶3,the most probable kinetic model isR2andA2when the mass ratio of coal to CaCO3is 1∶5 and 1∶7,and the most probable kinetic model isA2when the mass ratio of coal to CaCO3is 1∶9 and 1∶11. Therefore,the reaction rates with the mass ratio of 1∶1 and 1∶3 were calculated by the two dimensional phase boundary reaction model,and the reaction rates with the mass ratio of 1∶5,1∶7,1∶9 and 1∶11 were calculated by the two dimensional random nucleation and growth model. The reaction rate values(k) are summarized in Table 3.
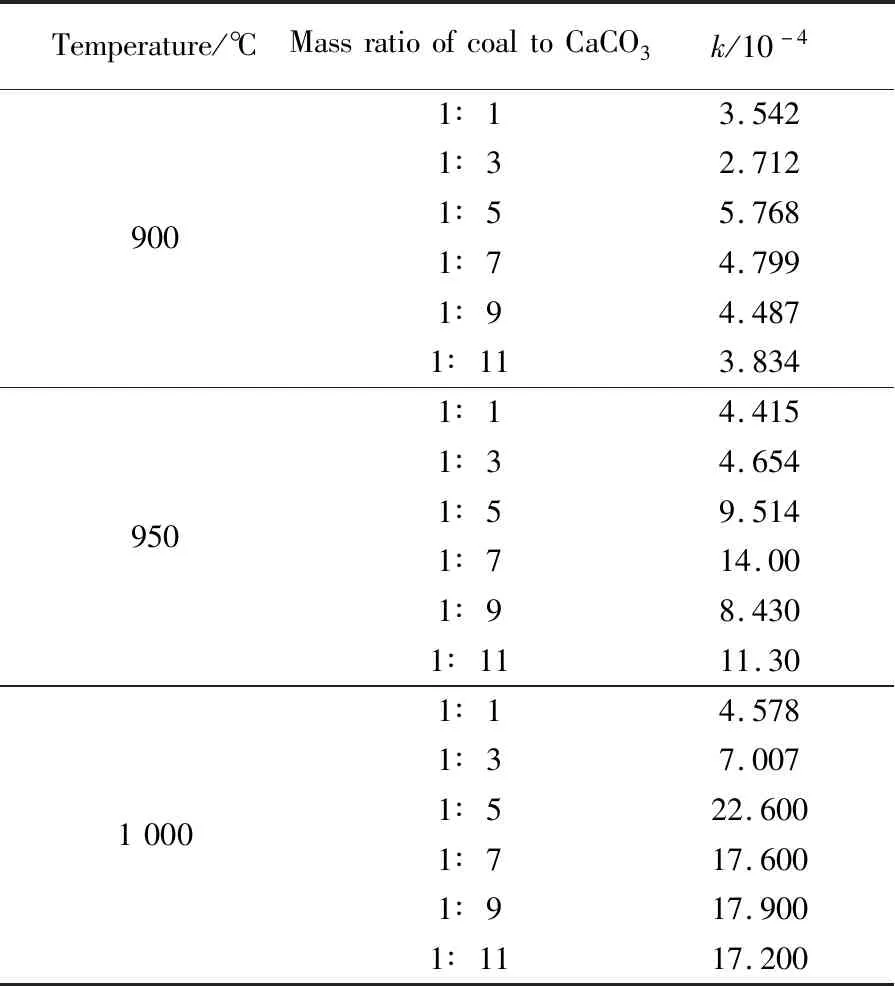
Table 3 Reaction rate values
The Arrhenius formula is suitable for almost all elementary reactions and most complex reactions in homogeneous reaction systems,and it is also frequently used in heterogeneous systems.
(16)
whereAis the Arrhenius constant,Eis the activation energy of the reaction,Ris the universal gas constant(8.31 J/(mol·K),andTis the reaction temperature.
Then,the relation between 1/Tand lnk in different mass ratios and the fitting lines are displayed in Figure 7. Based on the above discussion,the slope is -E/Rand the intercept is lnA. The results of the linear fitting are summarized in Table 4.
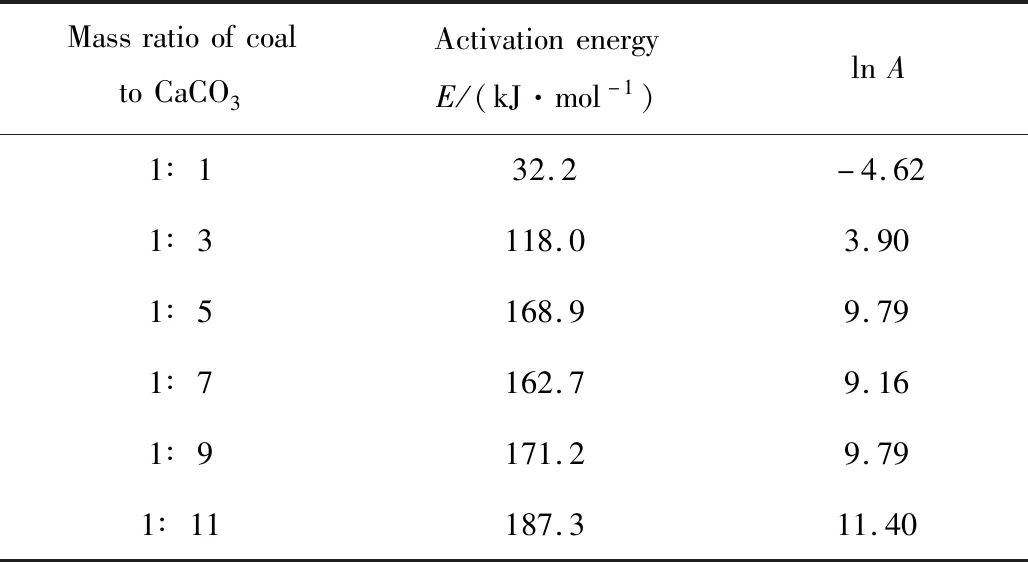
Table 4 Activation energy values and Arrhenius constants
The results show that the activation energy valuedecreased with the increase in the mass ratio of coal to CaCO3,and so did Arrhenius constant. The activation energy value varied little when the mass ratio was changed from 1∶5 to 1∶9. Compared with the above variation,the activation energy value increased sharply when the mass ratio was changed from 1∶9 to 1∶11. Therefore,to ensure the decomposition ratio of CaCO3and the combustion efficiency of coal in the cement precalciner,it is necessary to control the mass ratio of coal to CaCO3being higher than 1∶9.
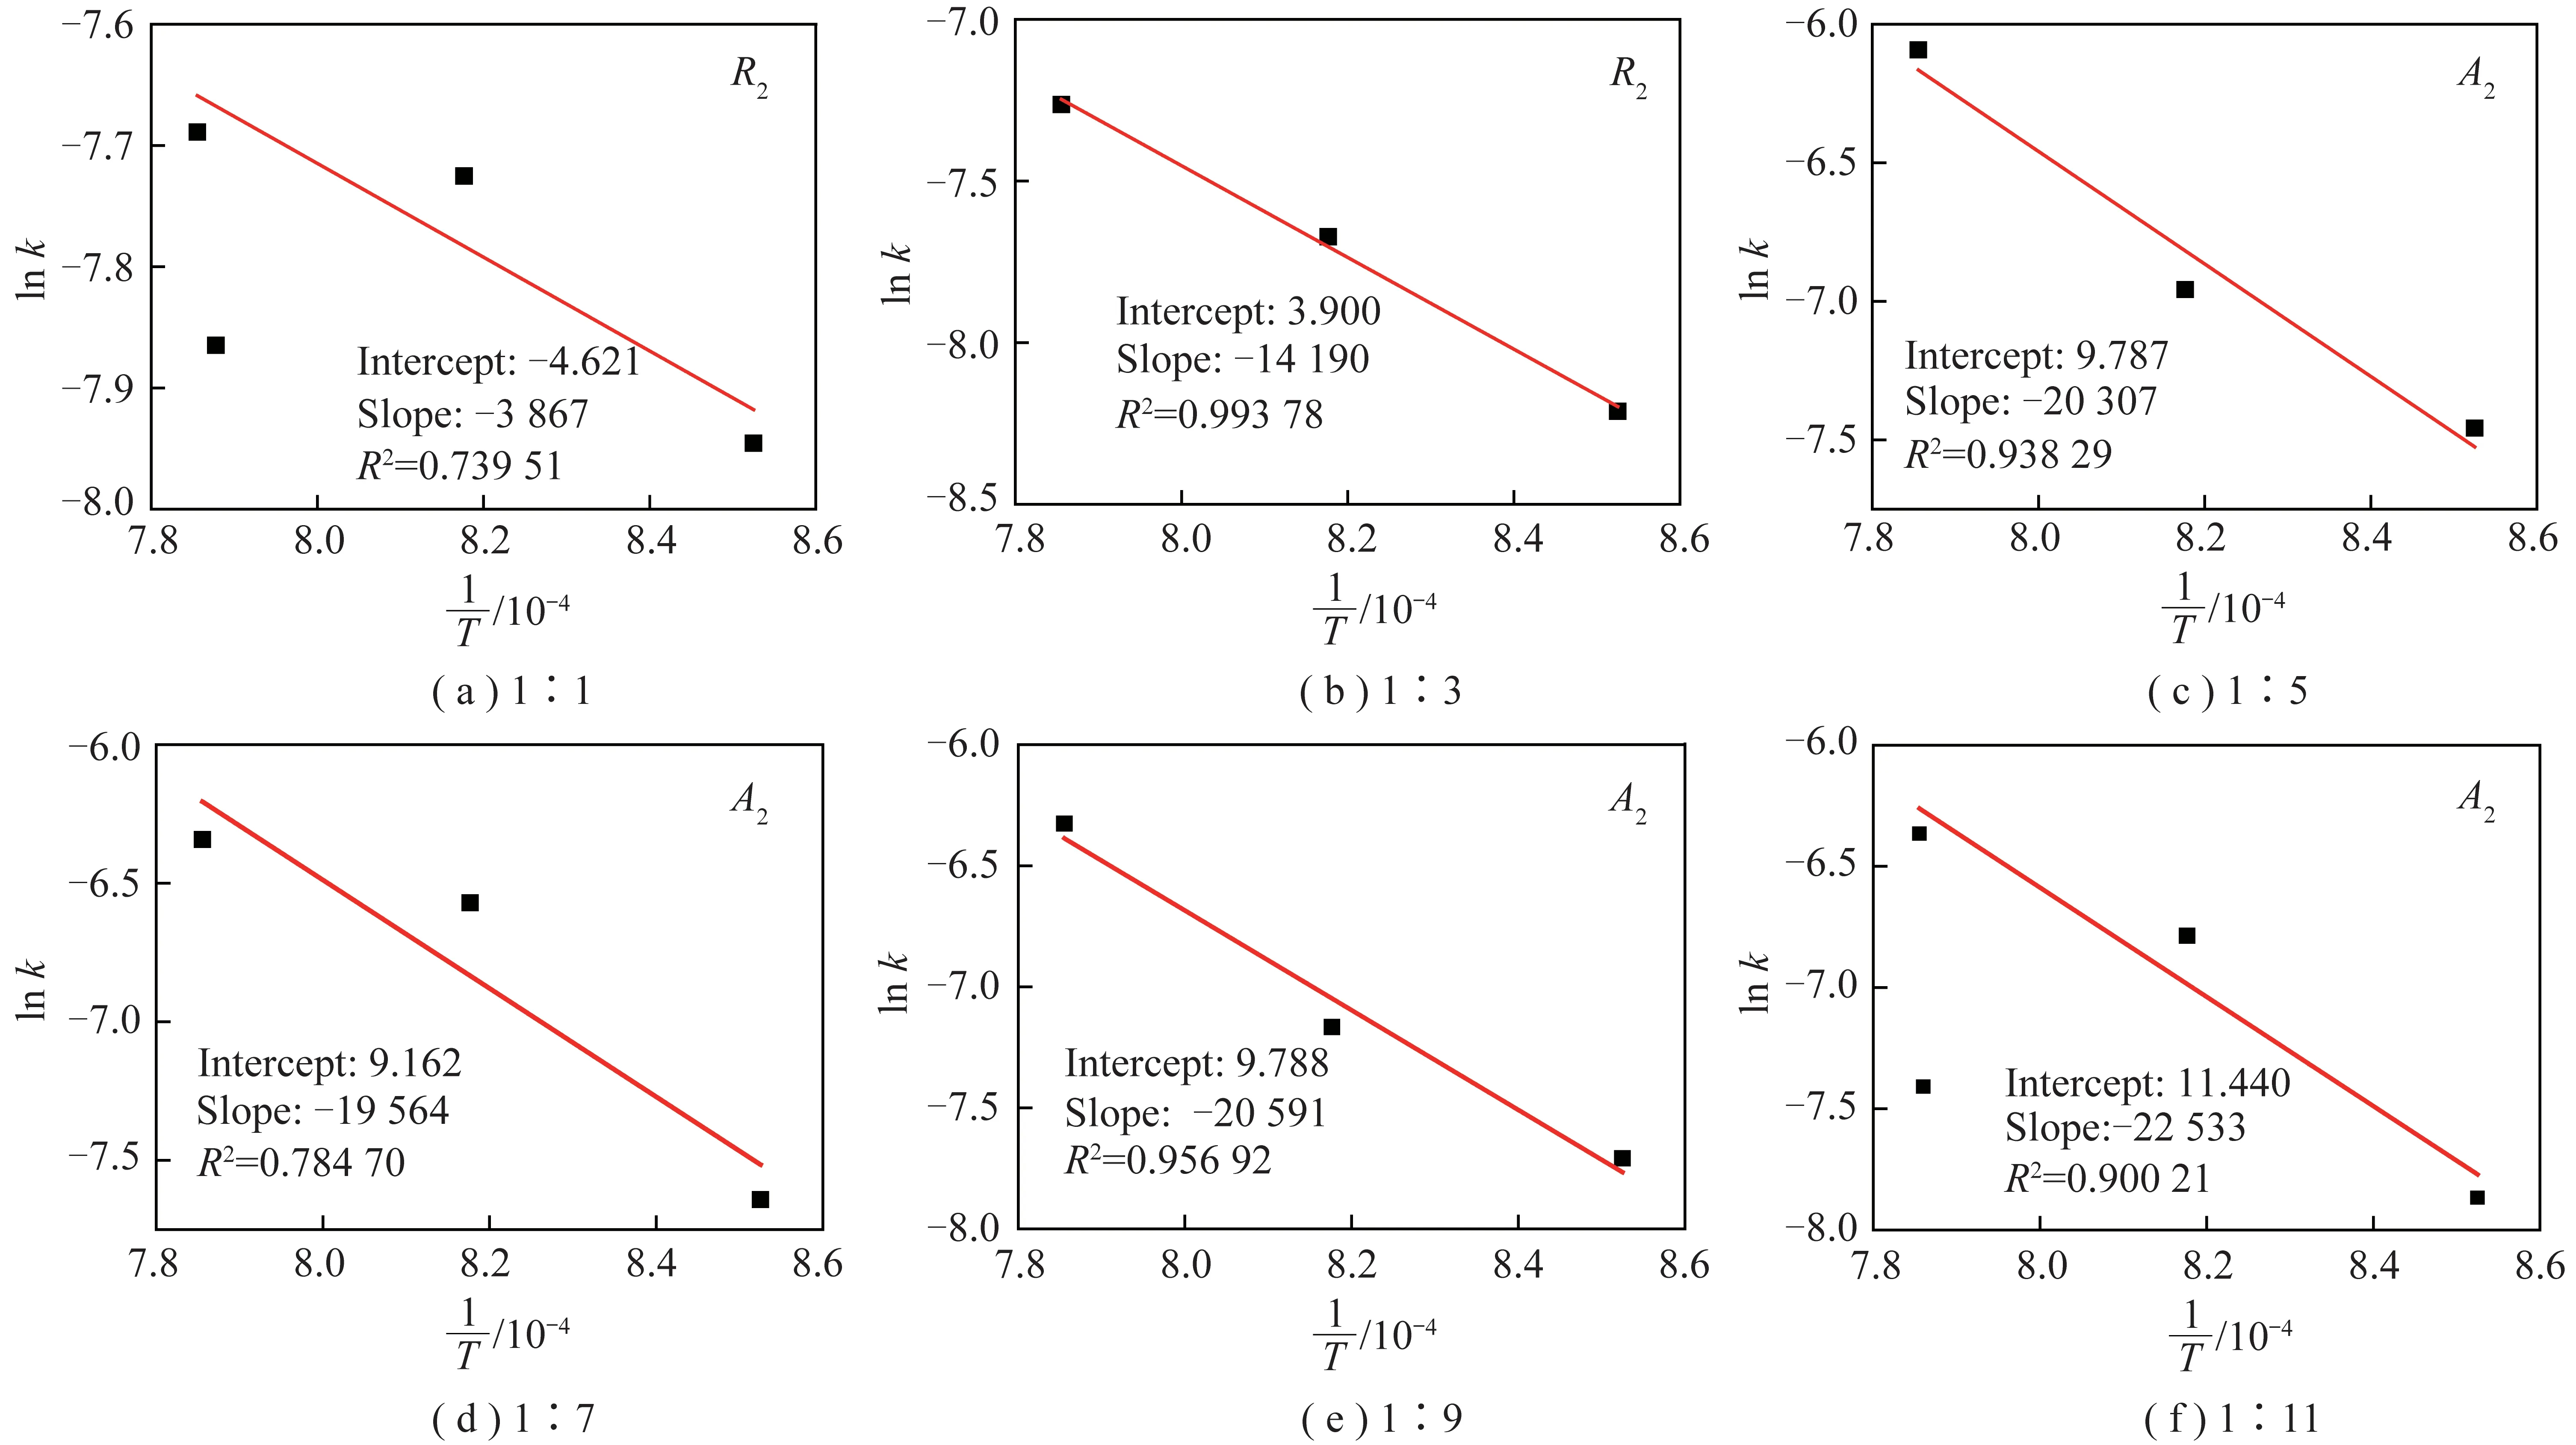
Fig.7 1/T-ln k curve of the mixtures at different mixing ratio
3 Conclusions
A high-temperature vertical tube furnace experimental system,capable of real-time monitoring the sample quality,is built in this study. The combustion reaction of pulverized coal and the decomposition reaction of CaCO3can be performed simultaneously. The mixed reaction characteristics can reflect the real situation in the precalciner. The results are summarized as follows:
1)The reaction time was shortened with temperature increasing during the operating temperature range of 900 -1 000 ℃. During this temperature range,the variations in temperature had little effect on the combustion reaction of pulverized coal,but the temperature become an important factor affecting the CaCO3decomposition at lower temperature. With the increase of the mass ratio of CaCO3in the mixture,the reaction rate is more sensitive to temperature. The BET specific surface area of decomposition product was largest when the mass ratio of coal to CaCO3was approximately 1∶9,which means that the reaction activity was better,and it was favorable for the subsequent clinker formation.
2)The kinetic analysis of the experimental data shows that the reaction kinetics model of the mixture was different in different mass ratios. The most probable kinetic model was two-dimensional phase interface model(R2) when the mass ratio of coal to CaCO3is 1∶1 and 1∶3. The most probable kinetic model was two-phase interface model(R2),and two-dimensional random nucleation and subsequent growth model(A2) when the mass ratio is 1∶5 and 1∶7. And the most probable kinetic model was two-dimensional random nucleation and subsequent growth model(A2) when the mass ratio is 1∶9 and 1∶11.
3)The activation energy value decreased with the increase in the mass ratio of coal to CaCO3,and so did Arrhenius constant. The activation energy value varied little when the mass ratio was changed from 1∶5 to 1∶9. Compared with the above variation,the activation energy value increased sharply when the mass ratio was changed from 1∶9 to 1∶11. Therefore,to ensure the decomposition ratio of CaCO3and the combustion efficiency of coal in the cement precalciner,it is necessary to control the mass ratio of coal to CaCO3being higher than 1∶9. The activation energy data obtained from this study can provide support for the later simulation calculation of the precalciner.
Acknowledgments
The authors gratefully acknowledge the supports of the National Key Research and Development Program of China(Grant No. 2016YFB0601503).
