Effect of MR Field Strength on the Texture Features of Cerebral T2-FLAIR Images:A Pilot Study
2020-10-03XuedanWangShiweiWangBotaoWangZhiyeChen
Xuedan Wang,Shiwei Wang,Botao Wang,Zhiye Chen
Department of Radiology,Hainan Hospital of Chinese PLA General Hospital,Sanya,Hainan 572013,China
Key words:magnetic resonance imaging;field strength;fluid attenuated inversion recovery;white matter;texture features
Objective To investigate effect of MR field strength on texture features of cerebral T2 fluid attenuated inversion recovery (T2-FLAIR) images.Methods We acquired cerebral 3D T2-FLAIR images of thirty patients who were diagnosed with ischemic white matter lesion (WML) with MR-1.5T and MR-3.0T scanners.Histogram texture features which included mean signal intensity (Mean),Skewness and Kurtosis,and gray level co-occurrence matrix (GLCM) texture features which included angular second moment (ASM),Contrast,Correlation,Inverse difference moment (IDM) and Entropy,of regions of interest located in the area of WML and normal white matter (NWM) were measured by ImageJ software.The texture parameters acquired with MR-1.5T scanning were compared with MR-3.0T scanning.Results The Mean of both WML and NWM obtained with MR-1.5T scanning was significantly lower than that acquired with MR-3.0T (P<0.001),while Skewness and Kurtosis between MR-1.5T and MR-3.0T scanning showed no significant difference (P>0.05).ASM,Correlation and IDM of both WML and NWM acquired with MR-1.5T revealed significantly lower values than those with MR-3.0T (P<0.001),while Contrast and Entropy acquired with MR-1.5T showed significantly higher values than those with MR-3.0T (P<0.001).Conclusion MR field strength showed no significant effect on histogram textures,while had significant effect on GLCM texture features of cerebral T2-FLAIR images,which indicated that it should be cautious to explain the texture results acquired based on the different MR field strength.
TEXTURE feature is intrinsic characteristics of medical images,which can reflect the intensity distribution,contrast and spatial distribution of images and display features of images which cannot be confirmed by naked eyes.[1]Texture analysis has been applied in the field of clinical diagnosis and differentiate diagnosis as a new medical imaging processing tool,such as differentiating central nervous lymphoma from high grade glioma[2]and benign breast tumor from malignant breast tumor,[3]early diagnosing optic neuritis,[4]and differentiating between pancreatic neuroendocrine tumor and pancreatic adenocarcinoma.[5]Currently,T2 weighted imaging (T2WI),[6]T1 weighted imaging (T1WI),[7]and diffusion weighted imaging (DWI)[3,5]are commonly used MR imaging modalities for texture analysis.As a conventional MR sequence,by applying a long inversion time to suppress cerebrospinal fluid signal,T2 fluid attenuated inversion recovery (T2-FLAIR) imaging could facilitate clear detection of cerebral lesions.[8]Therefore,FLAIR technique is a routine application in visual evaluation of brain disorders,such as hippocampus sclerosis,[9]cerebral infarction,[10]and multiple sclerosis,[11]and so on.Some technical development in texture analysis,a quantitative image processing technique,has allowed FLAIR images to provide much more quantitative features of lesions,such as Parkinson’s disease,[12,13]mesial temporal lobe epilepsy,[14]hippocampal sclerosis,[15]and oligodendroglioma.[16]As is known,MR field strength is considered to have an impact on image quality,for example,higher field strength is generally more prone to higher signal-to-noise ratio and contrast-to-noise ratio than low field strength,[17]which would influence radiological texture features.[18]Therefore,it is imperative to illustrate the impact of field strength on texture features of T2-FLAIR imaging.In the current study,the white matter lesions (WMLs)of thirty patients were scanned with cerebral T2-FLAIR imaging with 1.5 Tesla field strength (MR-1.5T) and 3.0 Tesla field strength (MR-3.0T).Histogram texture features and gray-level co-occurrence matrix (GLCM) texture features of regions of interest (ROIs) acquired with MR-1.5T were compared with MR-3.0T to assess effect of field strength on texture features of T2-FLAIR images.
PATIENTS AND METHODS
Patients
We enrolled thirty patients,who admitted to the Neurology Clinic of Hainan Hospital of Chinese People’s Liberation Army General Hospital from April 2018 to September 2019,presenting with ischemic WMLs on both MR-1.5T and MR-3.0T imaging scanned on the same day.They aged from 20 to 87 (mean 63.9±13.3) years old,with a male/female ratio of 19/11.All the subjects were right-handed.Ischemic WML was finally diagnosed by two experienced radiologists based on the findings obtained from coronal 3D T2-FLAIR images:a cap or a band of 10 mm or more on peri-ventricle.[19-21]Those (1) who accompanied by psychiatric or other neurological disorders such as stroke,severe head trauma,brain tumors and neurogenerative disorders;(2) who did not undergo MRI because of claustrophobia;(3) whose images contained head motion artifacts were excluded.
This study was approved by the local institutional review board,and written informed consents were obtained from all subjects.Because 3D T2-FLAIR sequence has been carried out routinely in the clinical diagnostic setting,it deemed exempt from ethics approval.
MR image acquisition
MR imaging was performed on MR-1.5T and MR-3.0T scanners (Signa Hdxt,GE Healthcare,Milwaukee,WI,USA) equipped with a conventional 8-channel phased-array head coil.All patients underwent cranial MR imaging including axial T1WI,T2WI and DWI.The coronal 3 dimensional T2 fluid attenuated inversion recovery (3D T2-FLAIR) parameters when MR-1.5T scanning were listed as follows:repetition time 6000 ms,echo time 136 ms,inversion time 1844 ms,echo train length 130,flip angle 90°,field of view 24 cm×24 cm,slice thickness 1.8 mm,matrix 224×224,and number of average 1.The coronal 3D T2-FLAIR parameters in MR-3.0T were listed as follows:repetition time 6000 ms,echo time 114 ms,inversion time 1892 ms,echo train length 140,flip angle 90°,field of view 24 cm×24 cm,slice thickness 1.8 mm,matrix 224×224,and number of average 1.
Image analysis
We followed the steps below to measure histogram and GLCM texture features we needed.(1) We first displayed and selected the largest area of WML on 3D T2-FLAIR images with picture archiving and communication systems (PACS),and exported them as DICOM style for further texture analysis.(2) Then,two ROIs (20-30 mm2) per patient of the selected image which was imported to ImageJ (1.41v) were manually placed on the central homogeneous region of WML and adjacent normal white matter (NWM) (Figure 1) respectively.When manually defining the ROI of WML,the area in the lesion with prominent cystic and hemorrhagic changes should be avoided.(3) At last,histogram texture features including Skewness,Kurtosis,and Mean signal intensity (Mean) were measured,and as GLCM texture features including angular second moment (ASM),Contrast,Correlation,inverse difference moment (IDM) and Entropy were calculated by using GLCM texture plugin with the setting of the size of the step in pixels 1 and the direction of the step 0 degree.
Statistical analysis
The quantitative data with normal distribution presented as mean±standard deviation (SD) and were analyzed with pairedt-test.The quantitative data with non-normal distribution presented as median (interquartile range,IQR) and were compared withWilcoxon’s signed rank paired test.Statistical analyses were performed using the SPSS Statistics Software Version 22.0 (SPSS Inc.,Chicago,IL,USA).Statistically significant difference was set at aPvalue less than 0.05.
RESULTS
Comparisons of texture features of WML between MR-1.5T and MR-3.0T
As illustrated inTable 1,Mean of WML acquired with MR-1.5T was significantly lower than that with MR-3.0T (Z=4.762,P<0.001);however,both Skewness(t=1.162,P=0.245) and Kurtosis (t=1.059,P=0.289)of WML showed no significant difference between MR-1.5T and MR-3.0T.
We compared the GLCM parameters of WML obtained with MR-1.5TversusMR-3.0T likewise.The results showed that ASM (Z=4.179),Correlation(t=6.497) and IDM (t=8.385) were significantly lower in MR-1.5T than that in MR-3.0T (allP<0.001),while Contrast (Z=3.898) and Entropy (t=4.966) were significantly higher in MR-1.5T than that in MR-3.0T (allP<0.001) (Table 1).
Comparison of texture features of NWM between MR-1.5T and MR-3.0T
Table 2presented that Mean of NWM was significantly lower in MR-1.5T than that in MR-3.0T (t=45.400,P<0.001),meanwhile Skewness (t=1.089,P=0.285)and Kurtosis (Z=1.532,P=0.125) showed no significant difference between MR-1.5T and MR-3.0T.We also identified that ASM (Z=4.683),Correlation (Z=4.710)and IDM (t=10.476) were significantly lower in MR-1.5T than that in MR-3.0T (allP<0.001),while Contrast(Z=4.782) and Entropy (t=9.754) were significantly higher in MR-1.5T than that in MR-3.0T (allP<0.001).
DISCUSSION
Texture analysis,which could unravel the hidden and imperceptible information in medical images,has preliminarily been used in disease diagnosis and evaluation,especially the rise of Radiomics.[22]The repeatability for the texture analysis would become more important,and the optimal use of the results of the texture analysis would also be urgent.In the currentstudy,the effect of MR field strength on the texture feature of cerebral T2-FLAIR image was investigated in order to identify the optimal use of texture feature on different MR field strength.
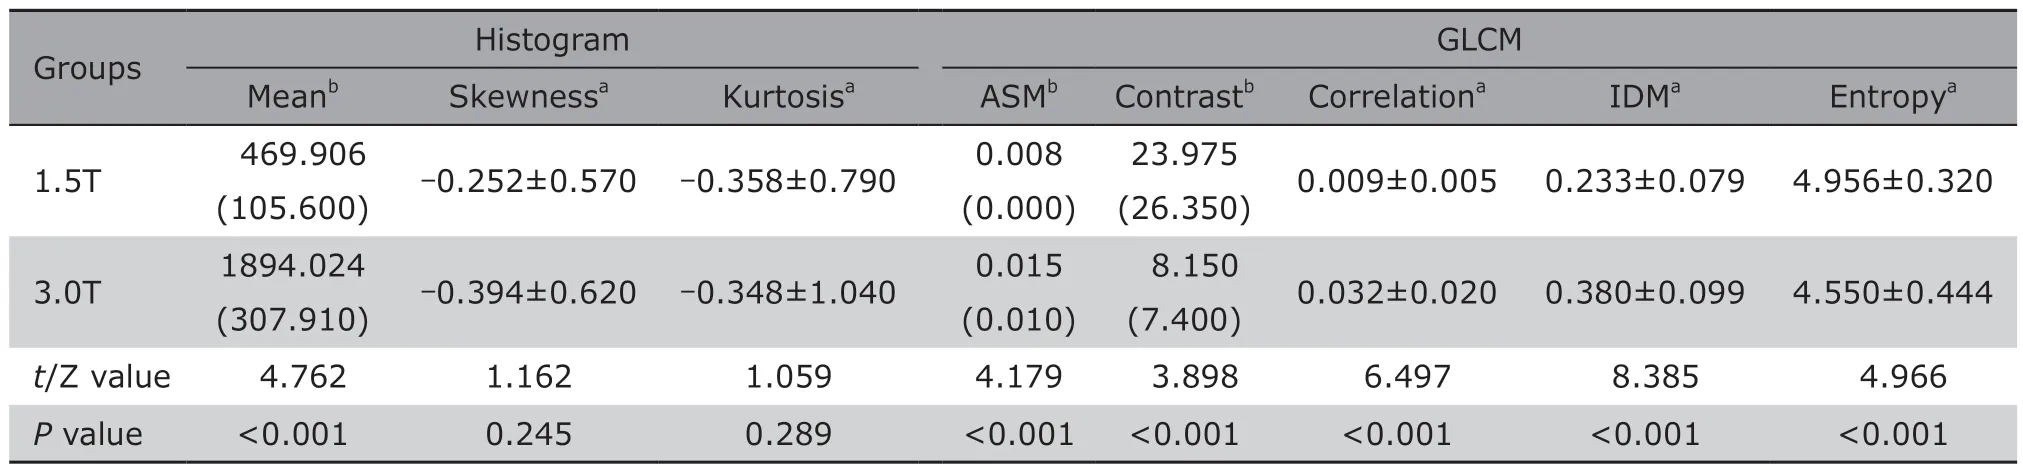
Table 1.Comparisons of texture features of white matter lesions between MR-1.5T and MR-3.0T (n=30)
This study demonstrated that the different MR field strength presented no effect on histogram parameters Skewness and Kurtosis although the field strength could influence the image quality.[17]As was known that the Mean reflected the mean signal intensity of all pixels,while the Skewness and Kurtosis reflected the statistical distribution of the pixels with different gray value.From the statistical viewpoint,the Skewness represented the asymmetrical degree for the probability distribution,and the Skewness value more than zero meant positive skewness (righttailed) while less than zero meant negative skewness(left-tailed).Therefore,the different skewness distribution could be used to perform the diagnosis and evaluation,such as evaluating the therapy effect of the recurrent high-grade glioma[23]and differentiating malignant nodules from benign nodules on computed tomography.[24]
In this study,the Skewness was less than zero for WML on MR-1.5T and MR-3.0T and for NWM on MR-3.0T,which suggested that the mean signal intensity of WML was skewnessed to the left of a typical center of the data.While the Skewness value was more than zero for NWM on MR-1.5T,which suggested that the mean signal intensity of NWM was skewnessed to the right of a typical center of the data.Based on the morphology of the skewness distribution,the Skewness results suggested that MR field strength presented no any influence for the histogram texture Skewness of the WML on T2-FLAIR image.Although the field strength presented different skewness distribution for the NWM,it showed no significant difference between MR-1.5T and MR-3.0T based on the statistical analysis.Therefore,the quantitative measurement of the Skewness on the T2-FLAIR images was more accurate than the observation of the morphology of the skewness distribution.
Kurtosis is a variable describing the shape of a probability distribution without units.The kurtosis distribution commonly included 3 types:[25](1) kurtosis=3(excess kurtosis=0),normal distribution (mesokurtic);(2) kurtosis<3 (excess kurtosis<0),presenting a shorter and thinner tail with a lower and broader central peak compared with normal distribution,and also called platykurtic;(3) kurtosis>3 (excess kurtosis>0),presenting a longer and fatter tail with a higher and sharper central peak compared with normal distribution,and also called leptokurtic.In the clinical practice,kurtosis had also been used to differentiate orbital lymphoma from idiopathic orbital inflammatory pseudotumor,[26]differentiate cancerous tissues from benign tissues in the prostate[27]and evaluate the hepatic fibrosis measurement.[28]In the current study,the Kurtosis of WML and NWM were all less than zero,which were classified as platykurtic.Further statistical comparisons suggested that the Kurtosis showed no significant difference for WML and NWM between MR-1.5T and MR-3.0T.Therefore,this study demonstrated that the field strength could not influence the Kurtosis measurement for cerebral T2-FLAIR image.
GLCM parameters could reflect the relationship in distance,direction and magnitude for the selected two pixels,and further evaluate the spatial distribution of the image texture features.This study demonstrated that ASM,IDM and Correlation values all presented significantly lower for WML and NWM on MR-1.5T compared with MR-3.0T.It was known that ASM and IDM represented the homogeneity,which is quite high when the image has perfect homogeneity or very similar pixel intensity.[29]Correlation reflects similarity and grey-levels correlation,which is used to measure the local changes of image texture,and the higher Correlation value presented high pixel gray correlation.[2]Therefore,higher field strength could increase the image homogeneity and gray correlation.The texture pattern would become more homogeneity,regularity,clearness and relativity with the increasing field strength.
Texture Contrast reflects the variation of the gray value,and a high Contrast would identify the noise or wrinkled texture in the image;[29]Texture Entropy represents the amount of information for image compression,and the higher Entropy value would mean the more loss of image information or message.[3]In this study,the higher Contrast and Entropy for WML and NWM meant the more noise or wrinkled texture and less information on MR-1.5T compared with MR-3.0T.Therefore,the high field strength would increase the depth of texture and decrease the texture complexity,which were not observed by the naked eyes in the routine clinical practice.Hence,it should be cautious for the clinical application of the texture findings on the different MR field strength.
The current study demonstrated that the field strength would influence the second-order GLCM while the first-order texture Skewness and Kurtosis could be avoided.The first-order texture would be limited in the conventional texture recognition because the Skewness and Kurtosis only evaluate the gray distribution for the pixels with different gray value.Therefore,the effect of the field strength on the first-order texture was limited.However,the second-order texture (e.g.GLCM)reflects the 2 dimensional gray changes of the image texture,which represents the comprehensive information of image texture (the direction,adjacent spacing,altered magnitude,and etc.).Therefore,GLCM texture features could be influenced by the different MR field strength in the current study.
Limitations of this study were as follows:(1) The sample size of 30 subjects was relatively small;(2)Besides WMLs,other disorders,e.g.brain tumor,multiple sclerosis,neurodegenerative diseases,etc.,should be investigated in the future study;(3) Beyond GLCM assessed in the study,other second-order textures should be considered;(4) In addition to white matter we analyzed,gray matter should be investigated.
In conclusion,this study prospectively demonstrated that the different MR field strength could influence the GLCM texture features and the histogram texture Skewness and Kurtosis could be avoided for cerebral T2-FLAIR images.Therefore,it should be cautious for the clinical application of the reported texture findings with different MR field strength.
Conflict of Interests Statement
The authors have no conflict of interests to disclose.
杂志排行

Chinese Medical Sciences Journal的其它文章
- Enhancing Quality of Patients Care and Improving Patient Experience in China with Assistance of Artificial Intelligence
- Advance in Functional Restoration of Injured Nerve with Low Level Laser and its Utilization in the Dental and Maxillofacial Region
- Treatment of Retroperitoneal Cavernous Lymphangioma:A Case Report
- A Homozygotic Mutation in KDSR may Cause Keratinization Disorders and Thrombocytopenia:A Case Report
- Value of Preoperative Neutrophil-to-Lymphocyte Ratio in Predicting Prognosis of Surgically Resectable Urinary Cancers:Systematic Review and Meta-Analysis
- Similarities and Differences of Early Pulmonary CT Features of Pneumonia Caused by SARS-CoV-2,SARS-CoV and MERS-CoV:Comparison Based on a Systemic Review