Geographic Variation in the Skull Morphometry of Four Populations of Batrachuperus karlschmidti (Urodela:Hynobiidae)
2020-09-30QiangqiangLIUJianliXIONGJianpingGOUandXiaochanGAO
Qiangqiang LIU,Jianli XIONG,Jianping GOU and Xiaochan GAO
College of Animal Science and Technology,Henan University of Science and Technology,Luoyang,Henan,China
Abstract Geographic variation of morphology is an important topic of evolutionary biology,and research on geographic variation can provide insights on the formation,evolution,and adaptation of species and subspecies.The vertebrate skull is a developmentally and functionally complex morphological structure with multiple functions,that is susceptible to vary according to selection pressure.In this study,geographic variations in skull morphology of Batrachuperus karlschmidti from four different geographic populations (Shade,Gexi,Shangluokema,and Xinduqiao) were examined via geometric morphometrics.No significant differences were found among these populations with regard to skull size; however,significant variation was found in skull shape.The most notable shape changes are the relative sizes and positions of the frontal,maxilla,pterygoid,and vomer.Skull shape changes were not related to allometry.However,due to limitation of sample populations and size,the results of this study need to be further verified by more sample populations and individuals in the future.The results of this study contribute to our knowledge about these aspects of morphological variability in this species as well as in hynobiid salamanders.
Keywords allometry,geographic variation,hynobiid salamander,skull size and shape
1.Introduction
Geographic variation and the variation among populations in genetically based traits across the natural geographic range of a species (Mary,1977; Olvido and Mousseau,2012) has been a central theme in evolutionary biology (Fonseca and Astúa,2015).The traits of geographic variation in amphibians include many aspects and have been widely studied,such as morphology(e.g.,Valenzuela-Sánchezet al.,2015; Oromi et al.,2016; Yanget al.,2017; Liuet al.,2018; Amadoet al.,2019),behavior (e.g.,Rodríguez-Tejedaet al.,2014; Wise and Jaeger,2016),physiology(e.g.,Riddell and Sears,2015; Twomeyet al.,2015; Barria and Bacigalupe,2017; Xionget al.,2018),and life history (e.g.,Kopp and Baur,2000; Miaudet al.,2001; Morrison and Hero,2003;Oromiet al.,2014,2016; Liaoet al.,2016; Wanget al.,2019).Geographic variation in morphology is the most widespread phenomenon (Avise,2000),which reflects phenotypic responses to environmental gradients,genetic variation and evolutionary history of populations and species and may indicate local or regional changes in environmental conditions (Ellisonet al.,2004).Genetic components and environmental conditions were considered to be the main reasons resulting in geographic variation (Olvido and Mousseau,2012).Studying geographic variation can provide insights on the formation and evolution of species and subspecies,the generation of biodiversity,the adaptive mechanisms of species,as well as the predication of the adaption of species to future environmental changes (Losos and Glor,2003; Ellisonet al.,2004; Olvido and Mousseau,2012).
The vertebrate skull,a developmentally and functionally complex morphological structure with multiple functions such as perception,protection,competition,reproduction,and predation (Hanken and Hall,1993; Ivanovićet al.,2013),is a target of selection (Alarcón-Ríoset al.,2017).The morphology of the vertebrate skull easily allows for variations among populations of a species due to differences of environmental conditions.Geometric morphometrics (Rohlf and Marcus,1993) has been widely and successfully applied to research morphological variation of the vertebrate skull,which is particularly true for Urodela.Ivanovićet al.(2009) showed significant variation in skull size among populations ofMesotriton alpestris.Ivanovićet al.(2012) found statistically significant variation in skull size and skull shape among populations ofLissotriton vulgaris.Ivanovićet al.(2013) reported significant divergence in skull shape but not in skull size between mitochondrial DNA lineages ofTriturus karelinii.Üzümet al.(2015) found statistically significant variation in skull size and shape among populations ofOmmatotriton ophryticusandO.vittatus,and the variation in skull shape in these two species was almost entirely due to size-dependent,allometric shape changes.However,no research of geometric morphometrics on skull of hynobiid salamanders has been reported to date.
The Chiala mountain salamander,Batrachuperus karlschmidti,was named by Liu (1950) based on specimens from Chiala[=Jiana],Luhohsien [=Luohuo County],Sikang [=Sichuan Province],China.It is differentiated from all other congeneric species (B.pinchonii,B.londongensis,B.tibetanus,andB.yenyuanensis) mainly by the uniformity of its dark olive-colored body,with a total lack of spots and marblings (Liu,1950).Several scholars have consideredB.karlschmidtito be a junior synonym ofB.tibetanus(Feiet al.,1983; Feiet al.,2006); however,the morphology,development,and habitat preferences (Zhao and Jiang,1988),cytogenetics (Yang,1992),and molecular biology (Fuet al.,2001; Liet al.,2004; Fu and Zeng,2008; Luet al.,2012; Xiaet al.,2012) support its validity.This species is widely distributed in the mountain streams of Sichuan Province (Fu and Zeng,2008; Lu et al.,2012; Xia et al.,2012) and Qinghai Province (Dinget al.,2014).This species is adapted to cold water and can be found under stones of small mountain streams from 1500 m to 4250 m,and the breeding season lasts from May to the first part of August (Liu,1950).This species is a poorly known and understudied species,and have been studied rarely.In this study,geographic variation in the skull morphology among four populations (Shade,Gexi,Shangluokema,and Xinduqiao populations) ofB.karlschmidtiwas analyzed using geometric morphometric methodology.The following questions were preliminary tested:(i) whether geographic divergence existed in skull size and shape,and (ii) whether divergences in skull shape are related to the skull size.This study improves our understanding of the evolution of skull shape and processes that lead to morphological diversification.
2.Materials and methods
2.1.Samples and skull preparationA total of 24 skulls ofB.karlschmidtiwere used in this study.Species were collected from four populations of Sichuan Province,China (Figure.1):Shade (29.5123°N,101.4374°E,altitude 3447 m),Gexi (30.9696°N,101.2229°E,altitude 3622 m),Shangluokema (31.6168°N,100.7780°E,altitude 3644 m),and Xinduqiao (29.7906°N,101.5623°E,altitude 3743 m).Each population included six specimens (three males and three females).Only adult specimens(identified via examination of the gonad development) were included in this analysis to avoid additional ontogenetic variation.Upon arrival at the laboratory,animals were euthanized via submergence in a buffered MS-222 solution and were then stored in 10% formalin.Specimens were sexed by inspection of the gonads.The skulls were prepared by clearing and double-staining using a bone and cartilage staining procedure (Hanken and Wassersug,1981),which has been briefly summarized by Xionget al.(2013) and Xionget al.(2016).The cleared and stained skulls were stored in glycerol and deposited in the Henan University of Science and Technology Museum (HNUSTM).
All applicable international,national,and/or institutional guidelines for the care and use of animals were strictly followed.All animal sample collection protocols complied with the current laws of China.
2.2.Data acquisitionPictures of the stained skull specimens were taken via a mounted OLYMPUS DP26 digital camera.The skulls were positioned in the center of the optical field to reduce and equalize distortion (Cvijanovićet al.,2017).TpsUtil ver.1.74 (Rohlf,2017) was employed to create TPS files that contained all coordinate datasets.Landmarks,which enabled the definition of shapes,were digitized on the pictures of each skull specimen using TpsDig2 ver.2.16 (Rohlf,2010).Nineteen landmarks were used for the dorsal and 21 landmarks for the ventral view of the skull (Figure.2).All landmarks were placed on the left side of the skull,and were digitized three times by the same person (QQL).Digitizing hemi-skull was not only done to avoid redundancy information in symmetric structures,but also to reduce the number of analyzed parameters in the statistical processing of the data set (Abramon et al.,2017).In addition,although directional asymmetry and fluctuating asymmetry of shape are widespread in the animal kingdom,these are very small (Klingenberg,2015).Thus,the potential left-right differences,directional asymmetry and fluctuating asymmetry were ignored in this investigation.The definition of each landmark is listed in Table 1.
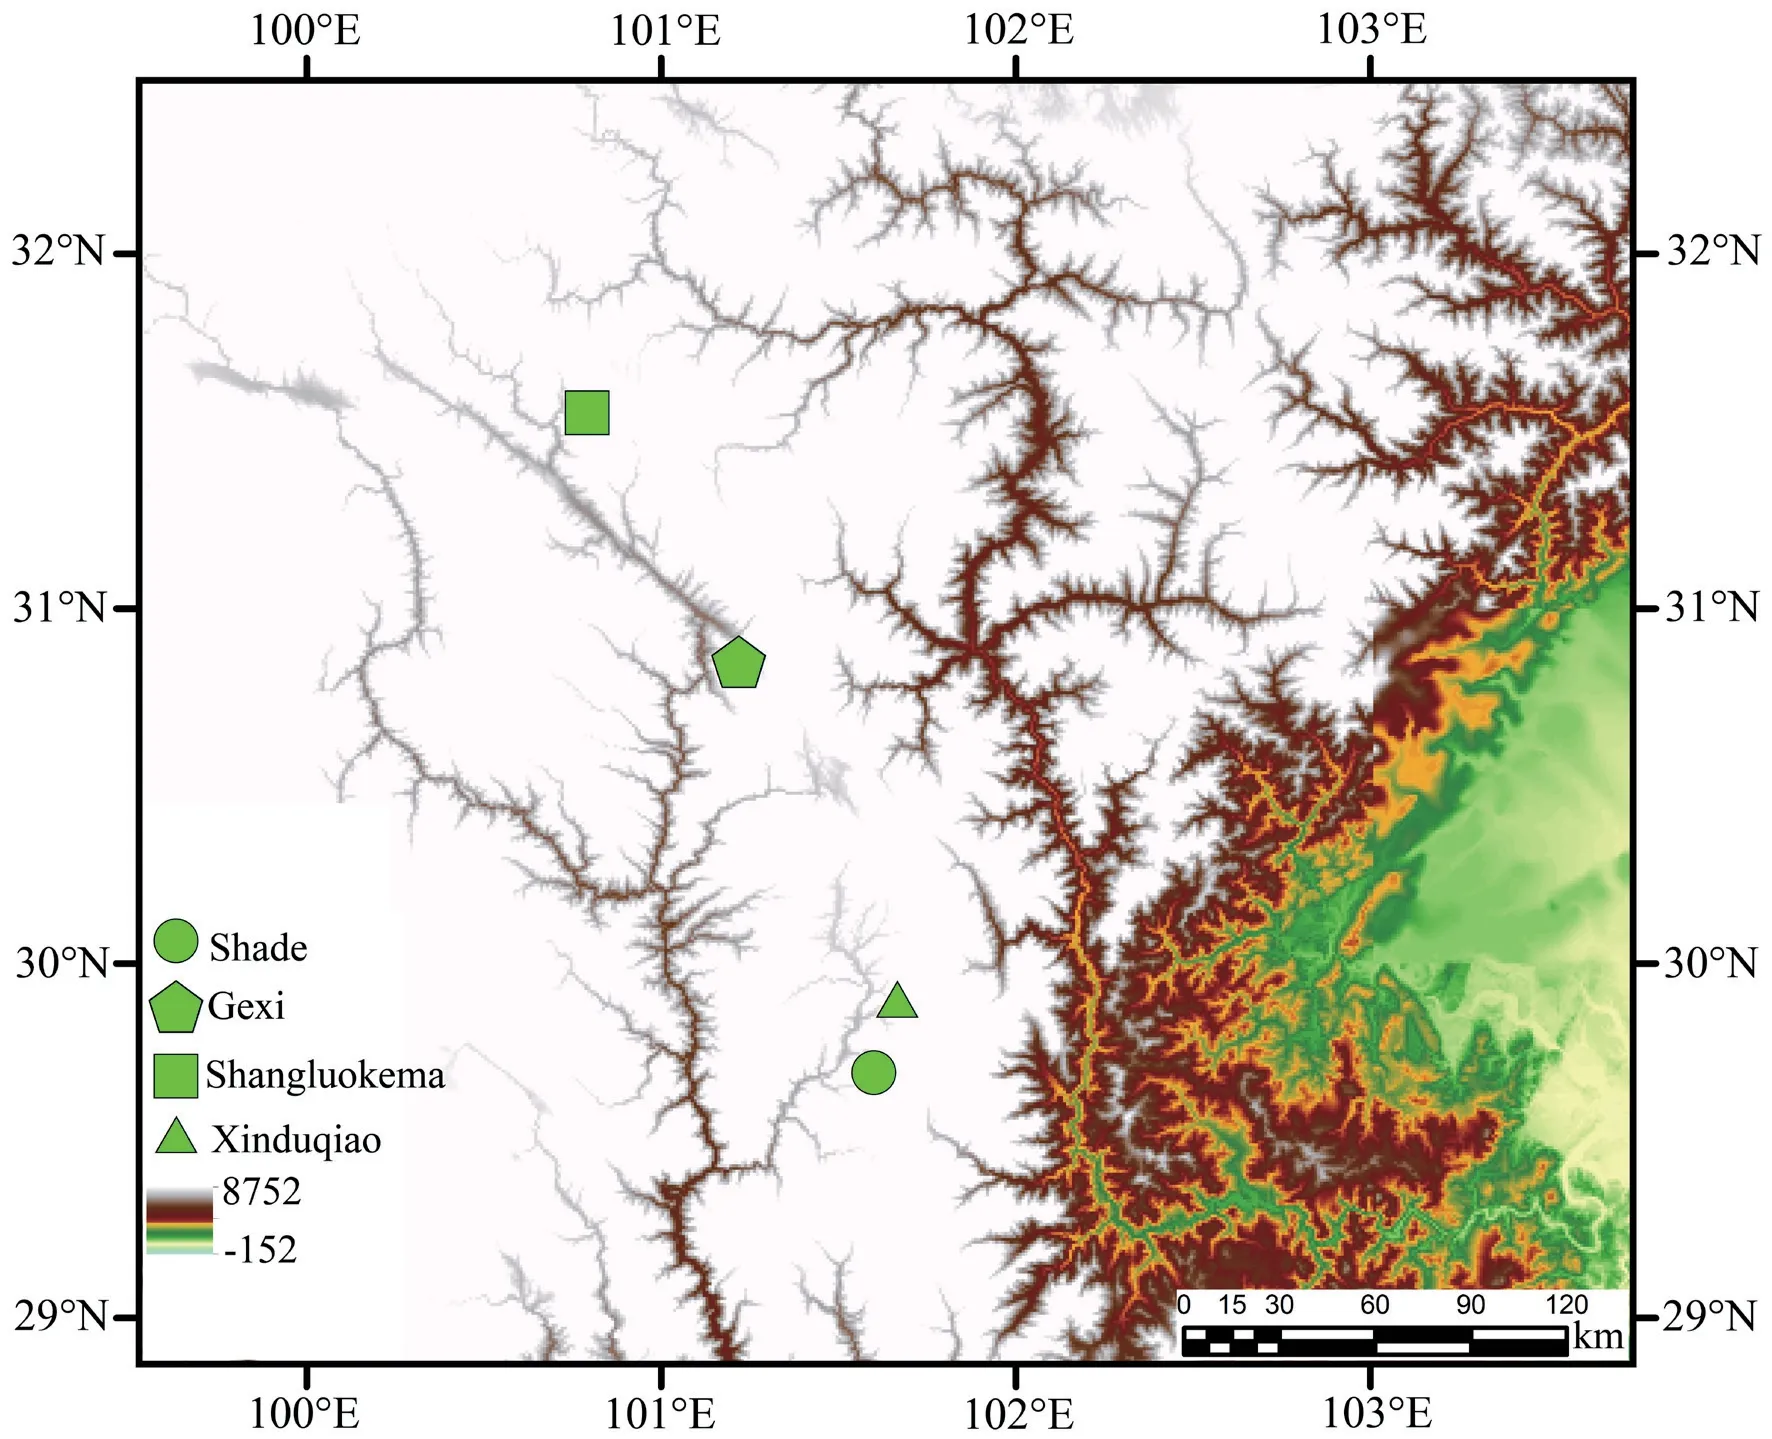
Figure 1 Localities of samples used in the present study.
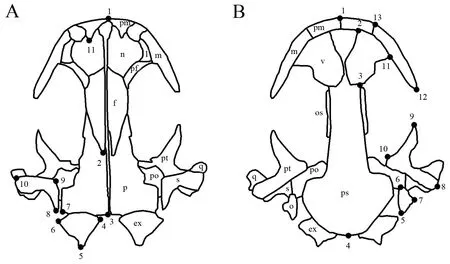
Figure 2 Landmarks digitized on the skull in dorsal (A) and ventral (B) views.
2.3.Geometric morphometricsA full Procrustes fit in MorphoJ v 1.06d was performed to eliminate effects of orientation,position,and size (Klingenberg,2011),which provided two new set of variables:Centroid size (CS,the square root of the sum of squared distance of all landmarks from their centroid) values (Dryden and Mardia,1998) and a matrix of shape coordinates (Procrustes coordinates,representing the difference between the consensus specimen and each sample).The centroid size value was computed for each specimen.Procrustes ANOVA (Klingenberg and McIntyre,1998;Klingenberget al.,2002) was used to estimate the measurement error.When the measurement error was not significant,the mean values and co-ordinate of each individual were calculated and used for the following analyses.The differences of CS among populations were tested by analysis of variance(ANOVA) using the RRPP package (Version 0.5.1) in R (Version 3.6.2).Principal component analysis (PCA) was performed on the covariance matrix of the Procrustes coordinates to explore and visualize the main trends of variation among populations.To further quantify the shape differences between populations,Procrustes distances,which is an absolute measure of the magnitude of shape difference between two configurations,were calculated for each pair of populations.The statistical significance of differences in the mean shape between populations was estimated by permutation test based on 10 000 iterations.Multivariate regression of Procrustes coordinates on log CS was conducted to estimate the relationship between shape and size (allometry) with 10 000 permutation among and within populations (Klingenberg,2011).
Due to the limited specimen number,differences of size and shape between sexes were not explored in this analysis.The analyses were run separately for the dorsal and ventral data.All geometric morphometric analyses and visualization were conducted with MorphoJ v 1.06d (Klingenberg,2011),unless stated otherwise.
3.Results
3.1.Measurement errorMeasurement error explained the smaller portion on both dorsal and ventral size and shape variation (dorsal size 0.1%,dorsal shape 2.0%,ventral size 0.1%,and ventral shape 2.9%) (Table 2).Thus,the digitalizing error was not considered in our data,and the mean values of three times of each individual were calculated and used for the following analyses.
3.2.Skull size variationThe mean CS values of Shade and Xinduqiao populations were similar,and larger than those of Gexi and Shangluokema populations,which were similar,in both dorsal and ventral skull (Table 3).Although the mean CS values showed variations,the analysis results of ANOVA with permutation showed no significant variation neither for dorsal(F=0.3707,P=0.539) nor ventral skulls (F=0.6526,P=0.419)among populations.
3.3.Skull shape variationThe results of Procrustes ANOVA showed that the shape differed significantly among populations for both dorsal (F=3.58,P< 0.0001) and ventral (F=2.76,P< 0.0001) skulls.For the dorsal skull,the first three principal components described 72.56% of the total shape differences.PC1 (41.64%) showed the shape change of frontal (landmark 2)(Figure 3); PC2 (23.38%) mainly reflected the shape changes of squamosal (landmarks 8,9,10) and exoccipital (landmarks 4,5,6) (Figure 3); and PC3 (7.54%) represented the shape changes of squamosal,exoccipital and processus dorsalis praemaxillaris(landmark 11) (Figure 4).In the plot of the first two axes,Shade population largely overlapped with Shangluokema and Xinduqiao populations,but could be clearly distinguishedfrom Gexi population; Gexi population overlapped with Shangluokema population,but could be clearly distinguished from Shade and Xinduqiao populations.Shangluokema population only could be clearly distinguished from Xinduqiao population (Figure 3).The ordination of PC1 vs.PC3 enabled clear distinction of Shade and Xinduqiao populations from Gexi and Shangluokema populations,respectively; however,Gexi and Shangluokema populations largely overlapped(Figure 4).The pairwise Procrustes distances (Table 4) indicated that the distance between Gexi and Shangluokema populations was smallest,while the distance between Gexi and Xinduqiao largest.Compared with the overall mean configuration,Shade population had slight backward-extending frontal (Figure 5A);Gexi population had backward-extending frontal (Figure 5B);Shangluokema population had slight laterally extending frontal(Figure 5C); Xinduqiao population had forward-extending frontal (Figure 5D).
With regard to the ventral skull,the first three principal components described 59.047% of the total shape differences.PC1 (30.60%) reflected the shape changes of maxilla,pterygoid and vomer (Figure 6); PC2 (17.45%) represented shape changes of pterygoid,maxilla,and vomer (Figure 6); PC3 (11.00%) mainly reflected shape changes of petergoid,vomer,and maxilla(Figure 7).In the plot of the first two axes,except for Shade andXinduqiao populations,which largely overlapped and could not be distinguished,Gexi and Shangluokema populations could be well distinguished and could also be distinguished from Shade and Xinduqiao populations (Figure 6).The ordination of PC1 vs.PC3 showed that Shangluokema and Gexi populations largely overlapped,and Shade and Xinduqiao populations also largely overlapped; however,Shangluokema population could be clearly distinguished from Shade and Xinduqiao populations(Figure 7).The pairwise Procrustes distances indicated that the distance between Shade and Xinduqiao populations was smallest,and the distance between Shade and Shangluokema population was largest (Table 4).Compared with the overall mean configuration,Shade population had backwardextending vomer (landmarks 2,3,11),laterally extending maxilla (landmarks 12,13) and pterygoid (landmarks 8,9,10)(Figure 8A); Gexi population had longer maxilla (Figure 8B);Shangluokema population had shorter maxilla and adducent pterygoid (Figure 8C); Xinduqiao population had adducentpterygoid (Figure 8D).

Table 2 Procrustes ANOVA of skull size and shape in Batrachuperus karlschmidti from three replicates.
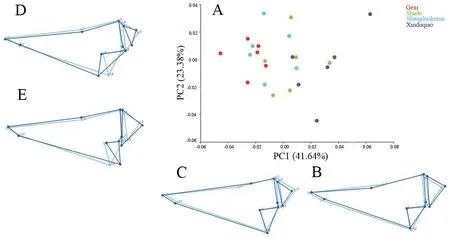
Figure 3 Shape variations in the dorsal skull view.A.Scatter plot of PC1 versus PC2; B-E.Wireframe deformations depict the shape changes along the respective PC axes.

Table 3 Descriptive statistics of dorsal and ventral skull sizes (means ± standard error) of Batrachuperus karlschmidti among different populations.Skull sizes are given as centroid sizes (CS); N:number of specimens.

Table 4 Procrustes distance of dorsal and ventral skull between pairwise geographical populations and its respective P-values after permutation test with 10 000 permutation rounds.Significant of Procrustes distances are shown in bold.
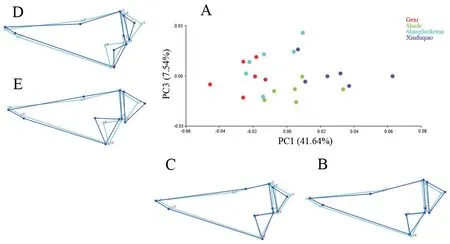
Figure 4 Shape variations in the dorsal skull view.A.Scatter plot of PC1 versus PC3; B-E.Wireframe deformations depict the shape changes along the respective PC axes.
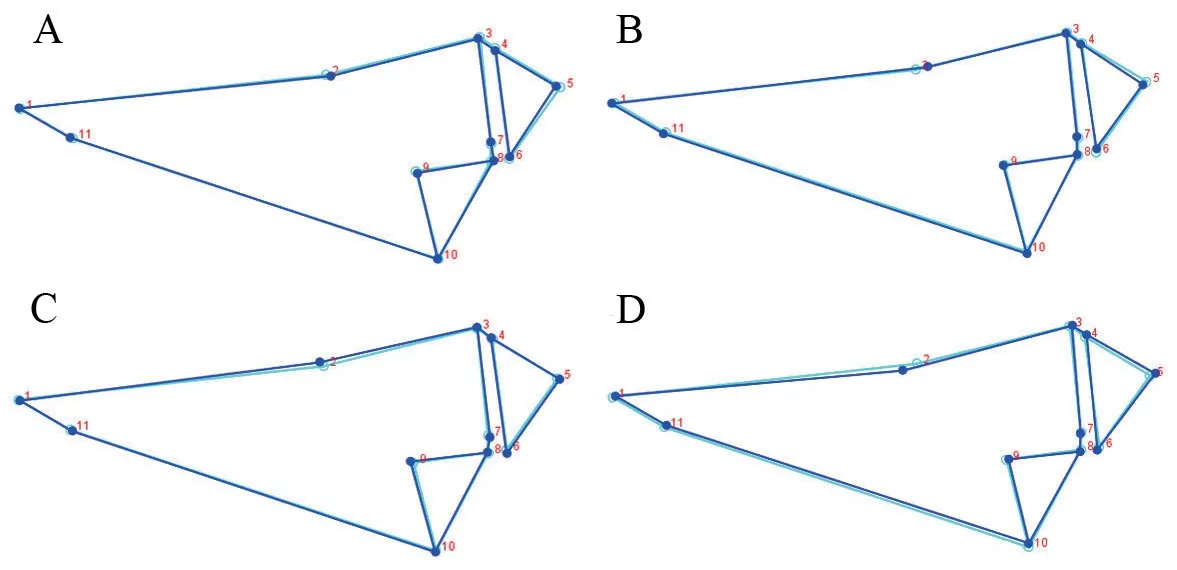
Figure 5 Wireframe deformations depict the shape changes of the overall mean versus population means in dorsal skull.A.Shade population mean versus overall mean; B.Gexi population mean versus overall mean; C.Shangluokema population mean versus overall mean; D.Xinduqiao population mean versus overall mean.
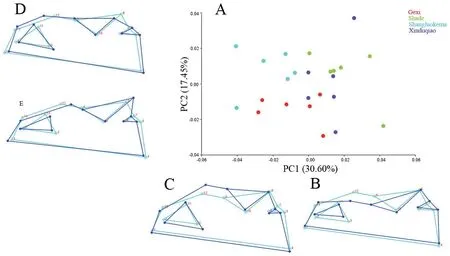
Figure 6 Shape variations in the ventral skull view.A.Scatter plot of PC1 versus PC2; B-E.Wireframe deformations depict the shape changes along the respective PC axes.
3.4.Static allometryMultivariate regression of the Procruste coordinates on log CS (pooled regression within populations)showed that size high percentages of prediction were obtained(dorsal:total sums of squares=0.0226,Predicted=5.8905%;ventral:total sums of squares=0.0252,Predicted=6.3483%),but shape changes did not significantly correlate with changes in size both in dorsal (P=0.2103) and ventral skull (P=0.1190).Within each population,multivariate regression showed that shape changes significantly correlated with changes in size only in dorsal skull of Gexi population (P=0.0193),but not significantly in dorsal and ventral skull of other populations(P> 0.05).
4.Discussion
To the best of our knowledge,this study is the first to use geometric morphometric methods to describe size and shape variations of the skulls of hynobiid salamanders.Although the sample populations and size are limited,the presented results shed new insight into important issues of geographic variation in hynobiid salamanders.The outcome of the present study demonstrates that geographic variation occurs in skull shape but not in skull size.The skull shape changes did not result from allometry.
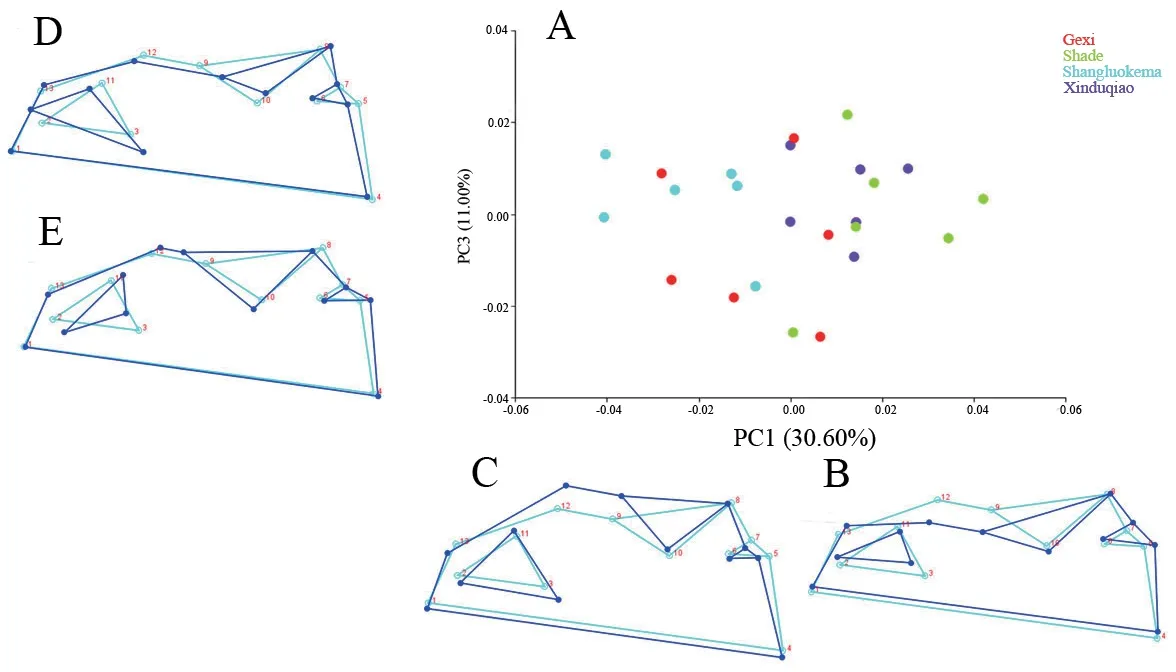
Figure 7 Shape variations in the ventral skull view.A.Scatter plot of PC1 versus PC3; B-E.Wireframe deformations depict the shape changes along the respective PC axes.

Figure 8 Wireframe deformations depict the shape changes of the overall mean versus population means in ventral skull.A.Shade population mean versus overall mean; B.Gexi population mean versus overall mean; C.Shangluokema population mean versus overall mean; D.Xinduqiao population mean versus overall mean.
Centroid size was used as an indicator of the overall body-size of specimens in geometric morphometric analyses(Zelditchet al.,2012).Geographic variation of skull size(centroid size) varies from species to species.For example,geographic variations of skull size are present inTriturus cristatussuperspecies (Ivanovićet al.,2008),Mesotriton alpestris(Ivanovićet al.,2009),Lissotriton vulgaris(Ivanovićet al.,2012),Ommatotriton ophryticusandO.vittatus(Üzümet al.,2015),but are absent inTriturus kareliniilineages (Ivanovićet al.,2013).In this study,the centroid size of both dorsal and ventral skull did not significantly vary among fourB.karlschmidtipopulations.In taxa with indeterminate growth,age,environmental conditions,and habitat resources largely affect body size (Arntzen,2000;Gotthard,2001; Cogălniceanu and Miaud,2003; Abramovet al.,2017).In this study,only adult individuals were analyzed,and habitat resources of four populations were similarly based on our field survey.Although the environmental conditions (e.g.,altitude,longitude,and latitude) were different,the differences were small.These result indicate a lack of variation of skull size among the four testedB.karlschmidtipopulations.
Since the vertebrate head is a structure with relevance in ecological and social functions,the shape of the skull is susceptible to selection pressures (Alarcón-Ríoset al.,2017).Previous analyses on variations of the urodela skull shape showed a high level of variation in skull shape between populations,and notable shape changes are varied.For example,the most prominent shape changes were in the skull base,palatal,snout,and vomeral teeth inTriturus karelinii(Ivanovićet al.,2013),in the skull base,palatal,vomer,snout,maxilla,and praemaxillae inLissotriton vulgaris(Ivanovićet al.,2012),as well as the exoccipital,snout,squamosal,and frontal inMesotriton alpestris(Ivanovićet al.,2009).In this study,the most notable shape changes were found in the frontal,maxilla,pterygoid,and vomer among the four tested populations.These shape changes can clearly distinguish most populations.Compared with dorsal skull,ventral skull showed higher variation,this is consistent with the findings of other studies(e.g.,Ivanovićet al.,2011,2013; Üzümet al.,2015).The variation of skull shape within species may result from static allometry,genetic differentiation,and ecological preferences (Ivanovićet al.,2009,2012,2013; Ivanović and Arntzen,2014; Üzümet al.,2015).The results of multivariate regression showed no significant divergence in allometry of dorsal and ventral skull among populations,and regression within population showed that significant divergence in allometry was only found in the dorsal skull of the Gexi population.These results suggest that allometry is not the influencing factor in the skull morphological variation ofB.karlschmidti.The genetic data and ecological preferences (e.g.,dietary) of the individuals of these fourB.karlschmidtipopulations are absent.Thus,the variation of skull shape among populations ofB.karlschmidticannot be explained by existing data,and more information of these populations is needed.
Research on geographic variation is usually based on a larger number of populations and individuals (e.g.,Ivanovićet al.,2008,2009,2013; Üzümet al.,2015).Here,the skull size and shape variation ofB.karlschmidtiwas studied based on limited sample populations and size.The obtained results of this study need to be verified/explored by more sample populations and larger sample sizes in the future.Geographic variation may result from genetic components and environmental conditions(Olvido and Mousseau,2012).In this study,the genetic data of four populations are absent.Such data can not only be used to analyze the mechanism of variation but also provides phylogeographic structuring to analyze the phylogenetic signal of variation.Then,genetic studies should also be included in the following research.
5.Conclusion
In conclusion,geographic variation does not affect skull size,which may result from a lack of differences of affecting factors (age,environmental conditions and habitat resources),but rather affects skull shape.Due to the limitation of sample populations and their size in this study,to better understand the mechanism and skull shape disparity pattern,considerable efforts should be directed toward a broader range of populations and individuals,and the genetic diversity of this species should be studied in the future.
AcknowledgementsWe thank X.M.ZENG,S.J.ZHANG,W.LUO,and X.Y.YUAN of the Chengdu Institute of Biology(CIB),Chinese Academy of Sciences for their help in field work,Z.Q.YOU of Mianyang Teachers’ College for his help in analyzing part data.This work was supported by the National Natural Science Foundation of China (31471971).
杂志排行
Asian Herpetological Research的其它文章
- A New Species of Microhyla (Amphibia:Anura:Microhylidae) from Langbian Plateau,Central Vietnam
- A New Species of Hemiphyllodactylus Bleeker,1860 (Reptilia:Squamata) from Hunan Province,China
- The Impact of Stream Landscape on Genetic Structure and Dispersal Patterns in Stream Salamander (Pachyhynobius shangchengensis)
- Age and Body Size of the Shangcheng Stout Salamander Pachyhynobius shangchengensis (Caudata:Hynobiidae) from Southeastern China
- No Evidence for the Compensation Hypothesis in the Swelled Vent Frog(Feirana quadranus)
- Flexibility as a Strategy for Avoiding Call Overlap in Male Anhui Treefrogs
