The Impact of Stream Landscape on Genetic Structure and Dispersal Patterns in Stream Salamander (Pachyhynobius shangchengensis)
2020-09-30TaoPANHuiWANGPengYANChenlingZHANGWenliangZHOUXiaobingWUandBaoweiZHANG
Tao PAN ,Hui WANG ,Peng YAN ,Chenling ZHANG ,Wenliang ZHOU ,Xiaobing WU* and Baowei ZHANG,*
1 School of Life Sciences,Anhui University,Hefei 230601,Anhui,China
2 Anhui Province Key Laboratory of the Conservation and Exploitation of Biological Resource,School of Life Sciences,Anhui Normal University,Wuhu 241000,Anhui,China
3 Jiangsu Key Laboratory of Biofunctional Molecule Chemistry and Chemical Engineering,School of Life Sciences,Jiangsu Second Normal University,Nanjing 210013,Jiangsu,China
Abstract Compared with other terrestrial environments,the stream environment generally presents a linear spatial structure and relatively simple environment.In a stream landscape,the dispersal direction of stream-type organisms usually presents a linear structure along the stream,which results in the limited dispersal and the genetic differentiation of stream-type organisms across different stream sections.The Shangcheng Stout Salamander(Pachyhynobius shangchengensis) is a narrowly distributed stream salamander in Dabie Mountains of East China.In the present study,we tested for the impact of stream landscape (i.e.waterfalls and underground river) on genetic structure and dispersal pattern in P.shangchengensis based on 12 nuclear microsatellite loci from 195 individuals in 3 populations (A,B and C) from three closely connected sections within one stream.Genetic diversity results suggested that Population B contains relatively high genetic diversity for P.shangchengensis when compared to the other populations (A and C). Detectable genetic differentiation was found (FST=0.008,P=0.007) among three populations,which was also supported by the Structure,FCA analysis and relatedness estimates of each pair of individuals among populations.The assignment test suggested that P.shangchengensis has philopatric males and female-biased dispersal (mean female Alc=−0.031,SE=0.225; mean male Alc=0.026,SE=0.198).Female-biased dispersal was also supported by analyses for each sex(i.e.Spatial autocorrelation,Genetic distance,Relatedness analysis).Our study indicated that small and isolated populations (A and C) had relatively low genetic diversity due to the limited population size.For stream salamanders,landscape features (i.e.waterfalls and underground river)can influence the ability of an individual to disperse through the landscape,and consequently influence the formation of strong genetic differentiation of P.shangchengensis.
Keywords Dabie Mountains,genetic structure,landscape features,Pachyhynobius shangchengensis,sexbiased dispersal
1.Introduction
Streams are fractal-like,occur with a hierarchical linear structure where smaller stream channels join to form larger ones in a dendritic pattern that resembles branches on a tree (Horton,1945).It is because of the hierarchical linear structure of streams that environments and resources differ across the dendritic streams.The spatial heterogeneity of this environment and resources have led to discrete transitions in morphological,physiological,and behavioral traits (Wilbur,1980; Moyle and Cech,1988; Duellman and Trueb,1994; Loweet al.,2004;Mullenet al.,2010).It may have facilitated the formation of different dispersal patterns and genetic differentiation within different stream sections (Finnet al.,2006;Muneepeerakulet al.,2008; Grantet al.,2009; Mullenet al.,2010).Therefore,in a stream landscape,studies focusing on how factors (e.g.resource richness,stream landscape characteristics) have affected landscape-scale population structure and scaling of dispersal are critical for testing general models (Loweet al.,2006; Campbell Grantet al.,2007; Mullenet al.,2010).
Intraspecific interactions,competitive ability,habitat characteristics,and resource distribution and availability can influence dispersal patterns (Clobertet al.,2001;Handley and Perrin,2007).The dispersal patterns of species function as the key influence on genetic structure and help maintains genetic diversity (Bowler and Benton,2005; Clobertet al.,2001; Orsiniet al.,2013; Smithet al.,2016; Olahet al.,2017).When the evolutionary pressures between sexes differ,asymmetric dispersal of the sexes may occur,called sex-biased dispersal (Bonteet al.,2011).Several theories have been generated to explain the differences in dispersal patterns between different sexes,such as local resource competition theory (Greenwood,1980),local mating competition theory (Dobson,1982)and avoidance of inbreeding theory (Pusey,1987).In vertebrates,mammals usually show male-biased dispersal and birds typically show female-biased dispersal(Greenwood,1980; Pusey,1987; Handley and Perrin,2007).As to the sex-biased dispersal reviewed in fish(Bekkevoldet al.,2004; Stiveret al.,2007),amphibians(Paloet al.,2004; Liebgoldet al.,2011; Wanget al.,2012)and reptiles (Dubeyet al.,2008),the dispersal patterns and mating strategies within these taxa are diverse.
Unlike other landscape types,in stream landscapes,stream-type organisms are usually confined to rivers and streams,which leads to present a linear dispersal pattern along the waterways.As described in the above paragraph,previous studies have shown that some stream-dwelling organisms own different evolutionary,demographic and ecological processes across the dendritic streams (Finnet al.,2006; Muneepeerakulet al.,2008; Grantet al.,2009;Mullenet al.,2010).Therefore,to provide important evidence for the correlation between the stream landscape and the formation of different evolutionary,demographic and ecological processes in hierarchical linear structure,more work is needed that focuses on the dispersal patterns of stream-type organisms.
Population connectivity is critical to many ecological processes and conservation goals,and can be a key factor affecting the regional viability of populations(Curtis and Bevers,2002; Hayden,2006; Saastamoinenet al.,2018).For amphibians,there are several types of landscape features,such as the presence of wetlands,changes in slope and cover type,that should influence the dispersal and population genetic structure (Spearet al.,2005).Amphibians generally require wet areas to survive and reproduce (Duellman and Trueb,1994),and therefore the presence of wetlands should be important for maintaining gene flow.Differences in slope among sites can account for the changes in dispersal or gene flow,as high levels of amphibian population subdivision exist among populations separated by mountains compared to low subdivision within basins in these populations (Funket al.,2005),ostensibly due to increased slope and reduced mobility.In fact,the effects of slopes and topography have been identified as the main predictors of amphibian dispersal or gene flow (Funket al.,2005; Olahet al.,2017).Cover type may have a strong influence on landscape connectivity for amphibians.Intermittent landscape features directly affect population dispersal or gene flow (Spearet al.,2005; Talbotet al.,2017).Landscape genetics uses genetic data as the dependent variable to correlate genetic relationships with several independent variables representing natural,physical obstacles to address some of the most challenging ecological and evolutionary questions (e.g.,source-sink dynamics,barriers and corridors,influence of landscape change)(Storferet al.,2007; Saastamoinenet al.,2018).In a linear stream landscape,there are many landscape factors,such as waterfall,underground river,changes in slope and cover type,that can cause the stream discontinuity.For stream-type organisms,linear hierarchical networks with landscape barriers may prevent local adaptive populations from being submerged and promote genetic differentiation (Loweet al.,2006; Campbell Grantet al.,2007; Campbell Grantet al.,2010; Mullenet al.,2010).
The Shangcheng Stout Salamander (Pachyhynobibus shangchengensis) is a narrowly distributed salamander endemic to streams above 500 meters in the Dabie Mountains,Eastern China (Feiet al.,2010).It has deep genetic divergence among regional populations on a small spatial scale (Zhaoet al.,2013; Panet al.,2014,2019).For narrowly distributed species with deep genetic divergence,such asP.shangchengensis,how it dispersal across those nature physical obstacles,such as waterfalls and underground rivers,in a linear river system,will help the understanding of how physical obstacles allow or restrict dispersal and create opportunities for genetic differentiation,then led to the deep genetic divergence.Therefore,in this study,we use an individual-based genetic approach with 12 microsatellite loci to assess how stream landscape features (e.g.waterfall,underground river) potentially influence the dispersal pattern and genetic structure ofP.shangchengensisin Yaoluoping National Nature Reserve of Dabie Mountains.
2.Materials and Methods
2.1.Ethics statementsThe collection of samples was performed within a long-term investigation project on amphibians of Dabie Mountains.This investigation project and the sample collection were approved by Anhui Yaoluoping National Nature Reserve,Anhui Province,China.Additionally,the protocol was approved by the ethics committee of Anhui Normal University.
2.2.Study area and samplingOur study was conducted in the Yaoluoping National Nature Reserve (30°57′57"N,116°4′5" E) in Southern Dabie Mountains,Yuexi county,Anhui Province in Eastern China (Figure 1).Dabie Mountains are located in the ecotone of subtropical evergreen broad-leaved forest and warmtemperate deciduous broad-leaved forest zone (Zhenget al.,2012).Pachyhynobius shangchengensisis widely distributed throughout the streams and has a relatively large population in Yaoluoping National Nature Reserve,which will facilitate the population recovery after our sampling.
From August 26 to August 28,2013,our study was carried out in three river sections (about 600 m; A,B and C) of the Yangtianwo valley area in the Yaoluoping National Nature Reserve (Figure 2).The streams have slight alkalinity (pH of 7.3),moderate midday temperatures (15.7 ℃),river flow velocity (0.028-0.669 m/s).The B and C sections are part of the main river,which are isolated from each other by a waterfall (15 m height);section A is a tributary of the main river.The landscape between sections A and C is an underground river,which is mostly covered by vegetation section (10 m) without a pool of water.The landscape details for sampling along the river are shown in Figure 2.
All adult individuals were captured by dip netting with relative positions recorded with a 500-meter Engineering ruler.Muscle or liver tissue was sampled and preserved in 100% ethanol for DNA extraction later.Specimens were fixed in 10% formalin and subsequently transferred to 75% ethanol for storage.All the specimens were deposited at the Zoological Specimen of Museum Anhui University(AHU),Hefei,Anhui,China.Sex was determined through sexually dimorphic features between sexes,such as the head length and width (Clemen and Greven,2009) and the presence of reproductive system (Bulakhova and Berman,2013; Vadimet al.,2015).
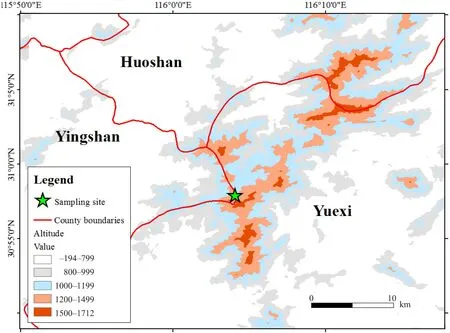
Figure 1 Sampling area for the populations of Pachyhynobibus shangchengensis.The red line represents the county line.Values with different colors represent altitudes.The green star corresponds to sample areas.Huoshan County and Yuexi County are located in the Anhui Province.Yingshan County is located in the Hubei Province.

Figure 2 The schematic diagram of the sampled river in Yangtianwo of Yaoluoping area,Yuexi Country,China.The width of the sampled river is no more than 2 meters.The B and C sections are part of the main river,which are isolated from each other by a waterfall (15 m height); section A is the tributary of main river.The landscape between sections A and C is the underground river(10 m).
2.3.Lab workTotal DNA was extracted from samples using a standard proteinase K/ phenol-chloroform protocol (Sambrooket al.,1989).An EasyPure PCR Purification Kit (TransGene) was used to purify each DNA extraction.Twelve independent polymorphic microsatellite loci forP.shangchengensiswere selected from previous studies (Table 1) (Wanget al.,2010).PCR was performed in 20 μL reactions containing 20-50 ng of template DNA,10 μL 2 × EasyTaqPCR SuperMix polymerase (TransGen Biotech,containing 1.25U ExTaq,0.4 mmol/L dNTP,4 mmol/L Mg2+) and 0.2 μmol/L of each primer.Thermal cycling was performed with the following profile:5 min denaturing step at 95 °C; followed by 35 cycles of 30s at 95 °C,1 min at optimal annealing temperature (Wanget al.,2010) and 1 min at 72 °C; and a final extension at 72 °C for 10 min.All PCR products were visualized on an ABI 3730 sequencer (PE Applied Biosystems) with GS500 marker.Allele peaks were scored using GeneMarker 1.85 (SoftGenetics LLC) (Holland and Parson,2011).
2.4.Basic genetic informationNumber of alleles (Na),effective number of alleles (Ne),observed heterozygosity(HO),expected heterozygosity (HE) and fixation index (F)were estimated in GenAlEx 6.5 (Peakall and Smouse,2006).Cervus 3.0 was used to assess the polymorphism information content (PIC) and the frequency of null alleles(Kalinowskiet al.,2007).
2.5.Population genetic structureTo determine whether there is genetic substructure among these three populations (A,B and C),we performed a genetic clustering analysis using STRUCTURE v.2.3 (Pritchardet al.,2000).The lengths of Markov Chain Monte Carlo iterations and burn-in were set as 1,000,000 and 100,000,respectively.We tested the range of possible clusters (K)tested from 1 to 10,and performed 10 independent runs for each K.The other parameters were set as following:admixture model and correlated allele frequencies between populations.
Analysis of molecular variance (AMOVA) in GenAlEx was used to partition genetic variation within and among these sampling sites and to estimate overall and pairwise population genetic differentiation (FST) (Wright,1965;Excoffieret al.,1992; Peakall and Beattie,1995).In order to assess if there was any bias inFSTestimation given the uneven sample size in Population B,we performed an AMOVA on randomly subsampled sets of 20 samples from each population using the ‘shuffle’ function of GenAlEx.Tests for genetic differentiation were performed by 1000 random permutations.For probing the genetic structure,we conducted the factorial correspondence analysis (FCA)by the GENETIX 4.05 (Belkhiret al.,1996-2004).The genetic differentiation among geographical samples was calculated by the standardized statisticsF'ST(Meirmans,2006) and Jost′sDest(Meirmans and Hedrick,2011)included in GenAlEx.
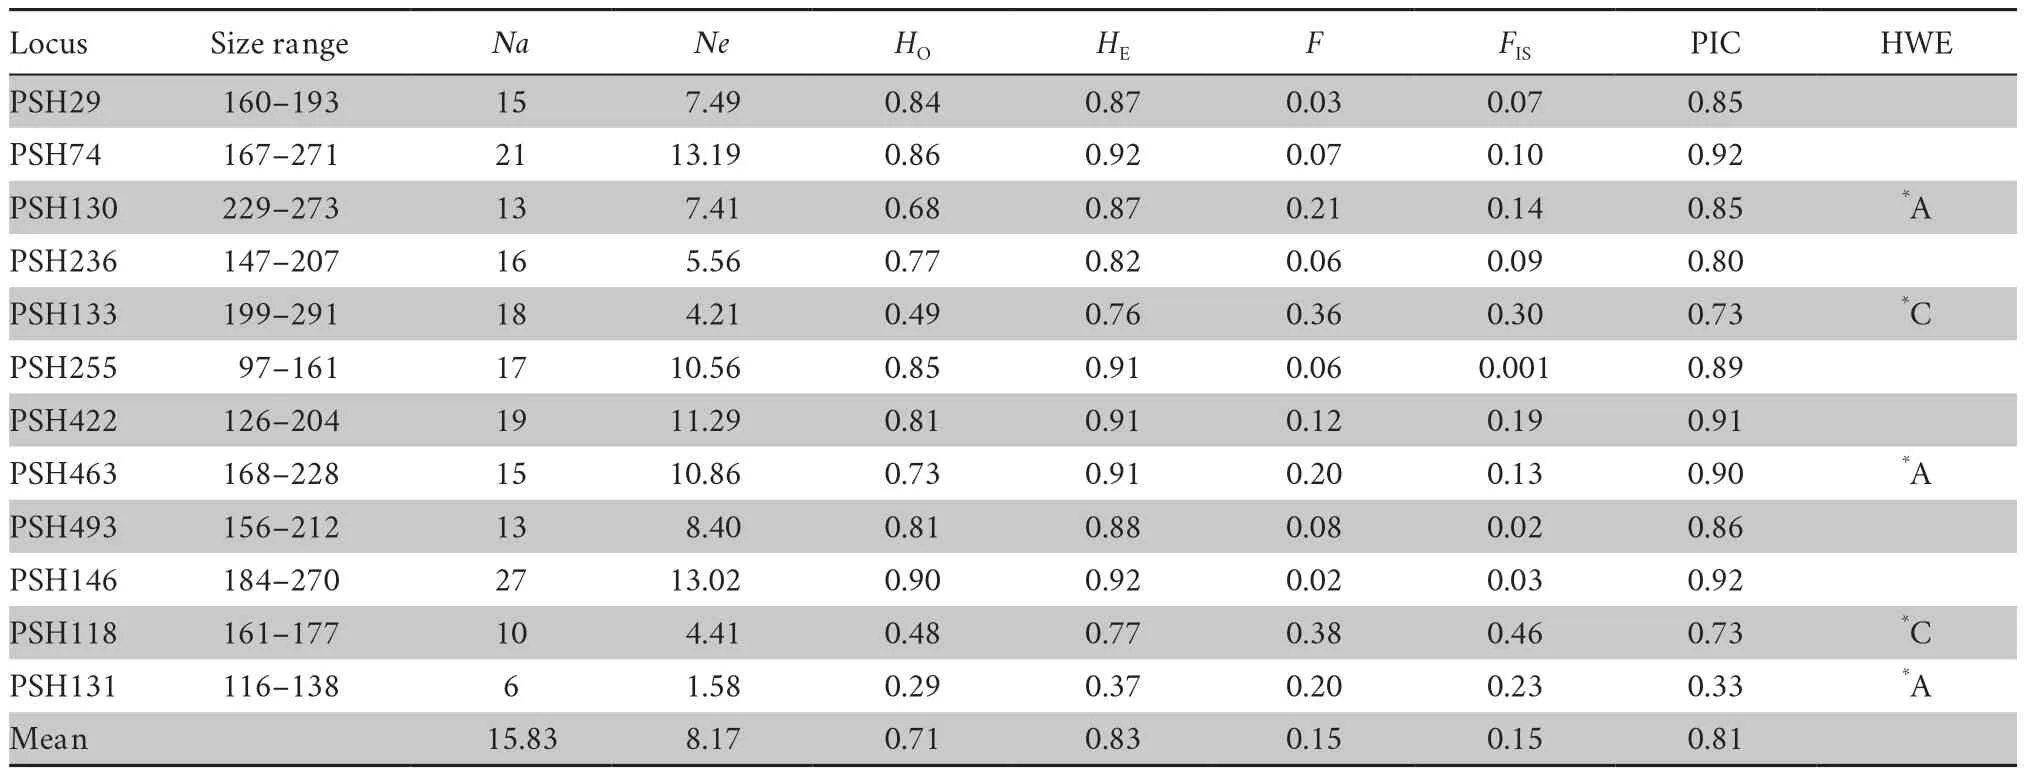
Table 1 Average genetic variation of twelve polymorphic microsatellite loci for Pachyhynobibus shangchengensis.
2.6.Sex-biased dispersl analysesAssignment tests implemented in GenAlEx (Favreet al.,1997; Mossman and Waser,1999) were used to investigate the pattern of sex-biased dispersal inP.shangchengensis.A log likelihood assignment test value is calculated for each individual and then the Assignment Index correction (AIC) score is calculated by subtracting the mean log likelihood of the population from an individual’s log likelihood score.For each population AIc values will average zero,while individuals with negative AIc scores are considered to have a higher probability of being immigrants (Mossman and Waser,1999).The significance of sex-biased dispersal was examined using Mann WhitneyUtests according to the difference between sexes in the frequency distribution of AIc scores.A negative score indicates male-biased dispersal and a positive value is indicative of femalebiased dispersal (Mossman and Waser,1999).The females should be more related to proximate females than distant females when females are philopatric,and the opposite pattern should occur if males are philopatric.
To further evaluate the inbreeding pattern within or among populations,we calculated the relatedness estimate (r) (Wang,2002) and the inbreeding coefficient(FIS) for each pair of individuals (Ritland,1996) by COANCESTRY 1.0.1.1 (Wang,2011).In addition,we also estimated the pairwise relatedness values (Queller and Goodnight,1989) and pairwise relationship (Kalinowskiet al.,2006) based on the allele frequencies for determining the distribution pattern of kinship among individuals within Population B by KINGROUP v.2 (Konovalovet al.,2004).In addition,for further probing spatial genetic structure between males and females,we also calculated the codominant genotypic genetic distances by GenAlEx(Morinet al.,1994; Tayloret al.,1997) and the average relatedness (r)by COANCESTRY.If males are more related to proximate females,then inbreeding may occur(Lebigreet al.,2010).For the genetic distance,we expect the philopatric sex to have significantly higher genetic distance values than the dispersing sex.Additionally,we investigated the proportions of genetic distance with population B for different distance classes among males and females,to account for the sex-biased difference in spatial genetic structure.
2.7.Spatial autocorrelation analysisSpatial genetic structure ofP.shangchengensiswas assessed using a multivariate spatial autocorrelation method,which strengthens the spatial signal by reducing stochastic noise resulting from the traditional allele-by-allele and locus-by-locus analyses (Smouse and Peakall,1999).We calculated the squared genetic distance between two individuals following the method of Peakall and Beattie (Peakall and Beattie,1995),and the sampling distance of each individual constituted the pairwise geographical distance.The autocorrelation coefficient (R)was calculated for a specified number of distance classes.The 95% confidence intervals for the estimate of R were generated by bootstrapping (1000 repeats).In this study,significant autocorrelation was declared only when r exceeded the permutation 95% confidence intervals around the null hypothesis of zero,and the bootstrap 95% confidence intervals around r did not exceed zero.Significant positive R implies that individuals within a particular distance class are genetically more similar than expected by random.Additionally,we conducted the Heterogeneity test to check the significant support of correlogram (Banks and Peakall,2012).The spatial autocorrelation analysis was conducted including three parts (the entire sample with identified sexy males,and females) in GenAlEx.
3.Result
3.1.Basic population genetic informationA total of 195 adults ofP.shangchengensiswere obtained from three sampling sections of river,including 20 individuals for Population A,153 individuals for Population B,and 22 for Population C (Figure 2 and Table 2).According to sex characteristics,the number of identified individuals is 187,with 101 male individuals and 86 female individuals(A:10 male,10 female; B:79 male,68 female; C:12 male,8 female).
In this study,small percentage of the microsatellite loci significantly deviated from HWE (Population A:PSH130,PSH463,PSH131; Population C:PSH133,PSH118) (Table 1).The frequencies of null alleles variedfrom 0.0094 to 0.26 and no loci showed evidence of null alleles.All loci showed wide variation in allele size range (Table 1).The numbers of alleles per locus (Na)ranged from 6 to 27 with the average of 15.83 (Table 1),indicating relatively high allelic diversity.The observed and expected heterozygosities (HO,HE) were 0.29-0.90(average 0.71) and 0.37-0.92 (average 0.83),respectively(Table 1).Moreover,the PIC values ranged from 0.33 to 0.92 (average 0.81) (Table 1),indicating that these markers are highly informative.In total,12 microsatellite loci showed polymorphism (Table 1).Among three populations,the number alleles across loci was higher in population B (15.50) followed by population C (11.33) and population A (10.17) (Table 2).Additionally,the higher values of observed and expected heterozygosities were found in population B (HO:0.71;HE:0.83) and population A (HO:0.71;HE:0.79) followed by population C (HO:0.68;HE:0.78).The replicated genetic diversity analysis for relatively equal sample sizes across the three populations(pop A:20,pop B:20,pop C:22) based on 18 replicates showed very similar results,indicating that Population B had the higher genetic diversity,no matterNaor andHOandHE(Table S1).

Table 2 Genetic diversity from three section of river (A,B and C population) in P.shangchengensis in China.
3.2.Population genetic structureThe AMOVA analysis revealed a low but significant level of genetic differentiation among the three populations (FST=0.009,P=0.001).Among the three populations,Population A was significantly statistical different from the other two populations (vs.population BFST=0.010,P=0.001;vs.population CFST=0.014,P=0.002).Moreover,Populations B and C were also significantly statistical different (FST=0.008,P=0.003).The replicated AMOVA analysis at relatively equal sample sizes across the three populations (pop A:20,pop B:20,pop C:22) based on 18 replicates showed similar results,indicating little or no bias in estimation due to sample size variation (Table S2).The STRUCTURE results showed the significant genetic differentiation between population C and the other two populations (A and B) due to the proportion of genetic clusters and maximum ΔK(Figure 3 and Figure S1).On the other hand,when K=8,the genetic clustering composition in population A also has a certain degree of differentiation with the genetic clustering in population B,suggesting that there is also a significant genetic difference between these two populations (Figure 3).FCA also showed that the individuals from three populations experienced significant separation trends(Figure 4),indicated substantial genetic differentiation among these three populations.In addition,this genetic differentiation pattern also got the support from the results of genetic distance (Pair-wise Jost′sDestandF′st)between populations (Table 3).
The relatedness estimates (r) and inbreeding coefficient(FIS) exhibit a linear relationship (Figure 5).The inbreeding coefficient values within populations were larger than that those between populations,suggesting close relatedness within populations (Figure 5).According to relatedness estimates (r) and the inbreeding coefficient (FIS) within the population,it seems that small populations will have larger inbreeding pressure.As for the three populations,Population B has a relatively small inbreeding coefficient,which indicates that individuals within the Population B might experience relatively longer dispersal distance(Table 4,Figure 5).In addition,the relatedness estimates(r) and the inbreeding coefficient (FIS) between PopulationA and B were smaller than the equivalents between B and C,consistent with the than bigger genetic distance (FST)and population differentiation between population A and B (Table 4,Figure 5).

Table 3 Pair-wise Jost′s Dest (upper diagonal) and F′st (below diagonal)among three geographic populations of P.shangchengensis.
3.3.Dispersal pattern analysisDue to the limited number of identified sexed individuals in Populations A(n=14) and C (n=12),all dispersal pattern analyses were conducted on Population B (n=120).In our study,the Assignment Index correction (AIC) across all populations showed that female-biased dispersal (mean male AlC=0.026,SE=0.198; mean female AlC=-0.031,SE=0.225)(Figure 6).In addition,the mean of pairwise relatedness values between male individuals (meanr=-0.0405,SD=0.1115) was higher than that of female individuals (meanr=-0.0404,SD=0.1131),they both deviated significantly from zero,which further supported the female-biased dispersal pattern.The mean codominant genotypic genetic distances between male individuals (22.701) was higher than that of female individuals (22.236),which also supported the female-biased dispersal pattern due to significantly higher genetic distance values of the philopatric sex compared with the dispersing sex.
Spatial genetic autocorrelation analysis showed that the first distance class (0-70 m),the R value among males(R=0.014,P=0.111; Figure 7A) was higher than that among females (R=-0.0145,P=0.929; Figure 7B) and among all individuals in B population (R=0,P=0.468;Figure 7C),which suggested that the autocorrelation value of the first distance class was not significant,but the autocorrelation value indeed was much larger than that in Figure 7B.Additionally,R value of the four distance class among males also show similar pattern.On the other hand,the Heterogeneity Test show that the correlogram of R value among males (Omega=32.143,P=0.006)was significant supported,but the other two show different results (females:Omega=17.590,P=0.129; all individuals:Omega=19.163,P=0.095).Combined these clues,the spatial autocorrelation analysis also hint the female-biased dispersal.

Figure 3 Bayesian population structure analysis of P.shangchengensis,on the basis of microsatellite genotyping data estimated by STRUCTURE.(A)output for K=2,(B) output for K=3,(C) output for K=8.Different colors represent the proportion of each individual belonging to different putative clusters.
Further examination of spatial distribution of codominant genotypic genetic distances with different genetic classes also showed that in the first distance class(0-50 m),the proportion of large genetic distance in female pairs (e.g.3 or 4) was higher than male pairs and male-female pairs (Figure 8).Additionally,during those three distance classes (i.e.,301-350,351-400,401-451 m),the high genetic distances (e.g.3 or 4) in male pairs occupy a extremely low proportion; however,in the female,it is the opposite situation.Theose results also hinted the female-biased dispersal inP.shanchengensis(Figure 8).In addition,according to the relationship percentage in population B,the percentage of female pairs with genetic relationship was smaller than that of male pairs,which also supported the female-biased dispersal(Table 5).In addition,following widely used criteria (0.25≤r< 0.5,moderate inbreeding;r≥ 0.5,high inbreeding)(Hanssonet al.,2007),we can infer that the most of relatedness values within population B were smaller than 0.25,which indicated that most of the individuals were out of inbreeding (Table S3).
4.Discussion
4.1.Genetic diversity in isolated populationsIn conservation biology,population isolation often leads to a series of negative consequences,such as losing genetic diversity,reducing individual fitness,and increasing the risk of inbreeding,which are closely related to the species′ viability and extinction risk (Ellstrand and Elam,1993; Avise and Hamrick,1996; Fanget al.,2002; Keller and Waller,2002; Burnset al.,2004; Reed,2005; Collieret al.,2010; Huet al.,2010).In this study,Populations A,B and C are isolated from each other by a waterfall and underground river,Population A and C is smaller than Population B.Overall,Population B showed higher genetic diversity and a lower inbreeding coefficient than Populations A and C (Tables 2,4 and Table S1).It appears that inP.shangchengensis,smaller populations harbor lower genetic diversity and suffer higher inbreeding risk as one would predict.Studies have shown that negative consequences,such as low genetic diversity and inbreeding,are caused by increasing difficulty for species to access resources,such as food,mates,home domain size (Fahrig,2003; Balkenholet al.,2015).In this study,the landscape barriers (the waterfall and underground river)in the stream habitat produced discontinuous sections and have led to the heterogeneity in the distribution of resources (e.g.food,mate,home domain).
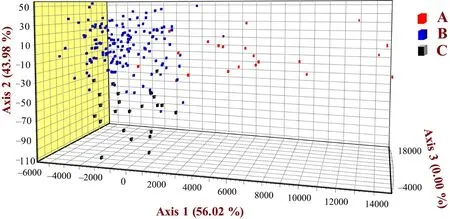
Figure 4 The factorial correspondence analysis across populations of P.shangchengensis.Three populations are indicated by different colors:red,population A; blue,population B; black,population C.
4.2.Landscape barriers and spatial genetic structureDue to limited dispersal or restricted gene flow,multiple factors may influence spatial genetic structure,including geographic barriers,risk associated with dispersal,environmental heterogeneity,population density,etc.(Koeniget al.,1992; Bowler and Benton,2005;Saastamoinenet al.,2018).Streams possess a dendritic hierarchical network structure,where smaller stream channels join to form larger ones in a dendritic pattern(Horton,1945).For many stream-dwelling organisms,the consistent network architecture may form natural landscape barriers and may lead to local divergence of populations (Loweet al.,2006; Campbell Grantet al.,2007;Campbell Grantet al.,2010) that ultimately face different evolutionary and ecological processes in different stream sections (Finnet al.,2006; Muneepeerakulet al.,2008;Grantet al.,2009; Mullenet al.,2010).For example,the Idaho giant salamander (Dicamptodon aterrimus) shows genetic differentiation among streams within catchments,consistent with a stream hierarchy model of population structure (Mullenet al.,2010).On the scale of this stream network,the patterns of genetic differentiation were often driven by the limited migration across the network architecture (Argentinaet al.,2018; Jaisuk and Senanan,2018).

Table 4 The Statistical parameters of relatedness estimates (r) and the inbreeding coefficient (FIS) of each pair of individuals within and between populations in P.shangchengensis.

Table 5 The estimated relationship results by the highest likelihood within population B.Note:U, Unrelated; HS,Half Sibs; FS,Full Sibs; PO,Parent/Offspring.

Figure 5 The relatedness scatter of relatedness estimates (r) and the inbreeding coefficient (FIS) within or among population in P.shangchengensis.(A)within population A,(B) within population B,(C) within population C,(D) between population A and B,(E) between population A and C,and (F) between population B and C.

Figure 6 Frequency distribution of corrected assignment indices (AIC) of P.shangchengensis.

Figure 7 Spatial genetic autocorrelation analyses among (A) male pairs(n=3081 pairs),(B) female pairs (n=2,278 pairs),and (C) all individual pairs (n=10,731 pairs) in Population B.The genetic autocorrelation coefficient (R) is a function of geographic distance,with the permuted 95%confidence intervals indicating random spatial genetic structure (dashed lines) and the bootstrapped 95% confidence error bars around r.U,upper 95% confidence interval; L,lower 95% confidence interval.The smallest distance class size was set as 70 m.
At a smaller spatial scale,it is necessary to consider the influence of landscape factors on genetic pattern,especially landscape barriers that lead to discontinuous habitats,such as waterfalls and underground rivers in streams.Actually,the contiguous stream population that we assumed was composed of many smaller populations of different sizes (Jaisuk and Senanan,2018).Whether landscape barriers substantially affect genetic structure needs further study.In this study,our data suggested that even at a smaller spatial scale,the main stream landscape barriers (waterfall and underground river)can still produce a clear signal of population genetic differentiation inP.shangchengensis(Table 3,Figures 3 and 4).Populations A,B and C,are isolated by the waterfall and underground river.Population connectivity is critical to many ecological processes and conservation goals(Curtis and Bevers,2002; Hayden,2006; Saastamoinenet al.,2018).The key factor to population connectivity is dispersal,which greatly affected population genetic structure,population dynamics,population persistence and adaptability (Clobertet al.,2001; Bowler and Benton,2005; Orsiniet al.,2013; Smithet al.,2016; Olahet al.,2017).Generally,limited by the characteristics of the linear habitat,the stream-type organisms are usually sensitive to the landscape barrier that effectively forms discontinuous stream habitat (Loweet al.,2006; Campbell Grantet al.,2007; Campbell Grantet al.,2010).In this study,the genetic differentiation among Populations A,B,C indicate that waterfalls and underground rivers act as effective natural landscape barriers forP.shangchengensis.As a narrowly distributed species,our results suggest that the distribution ofP.shangchengensiswas affected by landscape factors,which may facilitate to understand the population divergence and evolutionary history of it.
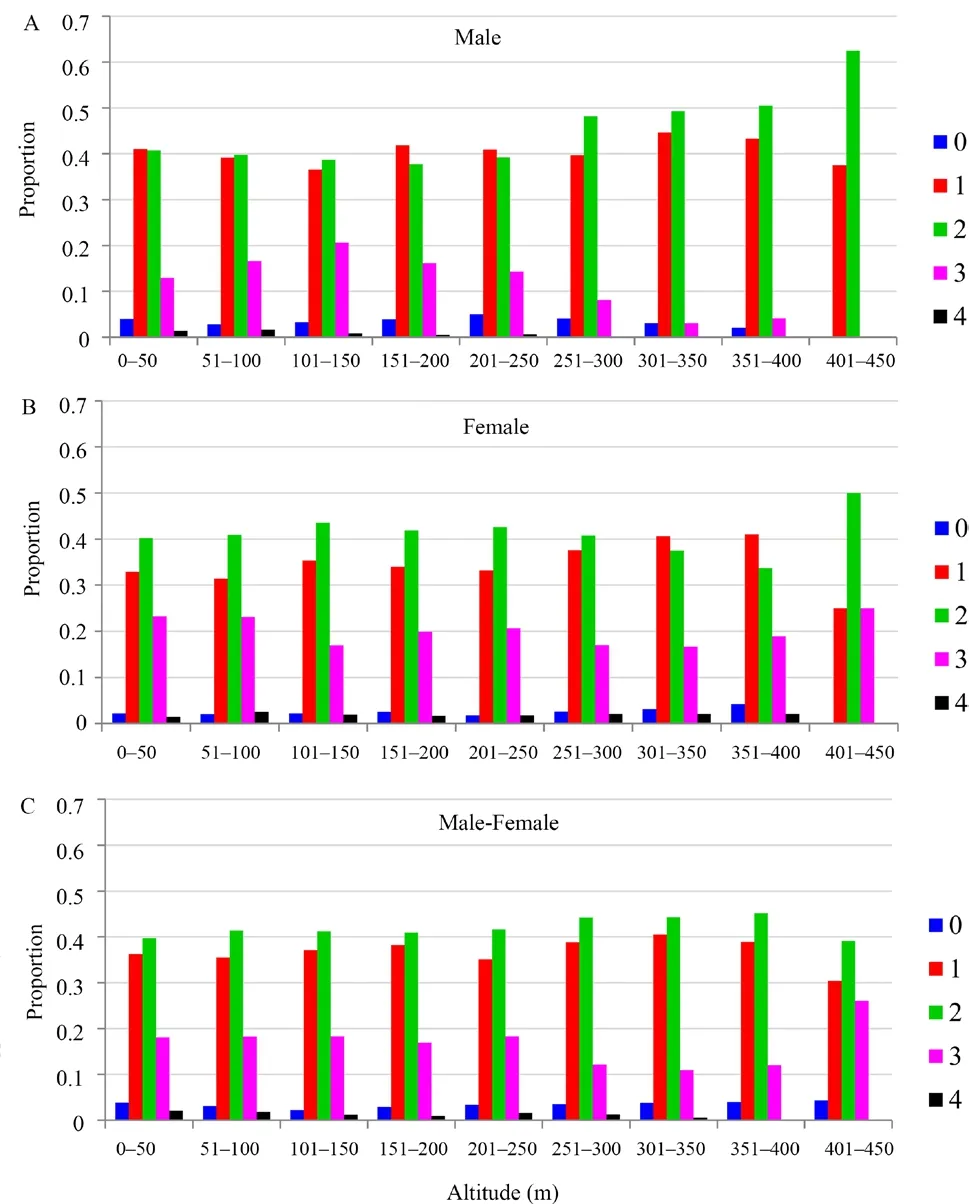
Figure 8 Spatial distribution of codominant genotypic genetic distances among (A) male pairs (n=3081 pairs),(B) female pairs (n=2278 pairs),and (C) male-female pairs (n=5372 pairs) in Population B.The distance classes was set as 50 m.The genetic distance between individuals (0,1,2,3 and 4) was calculated based on the method from Smouse and Peakall,(1999).
4.3.Female-biased dispersalSex-biased dispersal may occur when the evolutionary pressures between sexes are different (Bonteet al.,2011).In recent years,sexbiased dispersal studies have been carried out in various vertebrate animal groups,such as fish (Bekkevoldet al.,2004; Stiveret al.,2007),amphibians (Paloet al.,2004;Liebgoldet al.,2011; Wanget al.,2012),reptiles (Dubeyet al.,2008),birds (Pariset al.,2016) and mammals (Höneret al.,2008).Among those groups,mammals usually show male biased dispersal and birds typically show femalebiased dispersal (Greenwood,1980; Pusey,1987; Handley and Perrin,2007).However,the dispersal patterns and mating strategies were diverse in amphibians and reptiles.For example,the direct-developing salamanderPlethodon cinereusshowed females as philopatric and male-biased dispersal due to the local mating competition (Liebgoldet al.,2011); in the socially monogamous lizards of the genusEgernia,similar dispersal patterns were found (Gardneret al.,2001; Stowet al.,2001; Chapple and Keogh,2005); In contrast,the dispersal pattern of the common frog (Rana temporaria) is female biased (Paloet al.,2004).Femalebiased dispersal has also been observed in the Columbia spotted frog (R.luteiventris) (Pilliodet al.,2002) and the bullfrog (R.catesbeiana) (Austinet al.,2003).
In this study,based on multiple analytical approaches(Figures 6,7 and 8),including the Assignment Index correction (AIc),genetic distance,pairwise relatedness values of different gender (R) and spatial autocorrelation analysis,female-biased dispersal and male philopatry ofP.shangchengensiswas concluded.In nature,many animal groups show female-biased dispersal,such as fish (Tayloret al.,2003),amphibians (Pilliodet al.,2002;Austinet al.,2003; Paloet al.,2004),birds (Greenwood,1980; Pariset al.,2016; Pusey,1987) and mammals(Hammondet al.,2006; Nagyet al.,2013; Tuckeret al.,2017).In anurans and birds,the general trend for female-biased dispersal had been proposed (Greenwood,1980; Pusey,1987; Pilliodet al.,2002; Austinet al.,2003;Paloet al.,2004; Wanget al.,2012; Pariset al.,2016).Unlike the amphibian species above mentioned,P.shangchengensisis a stream-salamander.In this study,we found differences in dispersal distances between the sexes,indicating female-biased dispersal and male philopatry ofP.shangchengensis.Our results enrich the basic dispersal pattern of amphibian research,especially for the aquatic stream salamanders.Future studies should focus on whether female-biased dispersal acts as the general trend for aquatic Caudata.Unlike the female-biased dispersal of anurans (Austinet al.,2003;Lampertet al.,2003; Paloet al.,2004; Wanget al.,2012),it seems that there are no consistent sex-biased dispersal patterns in Caudata,although previous studies reported the male-biased dispersal pattern of two terrestrial salamanders (alpine salamander,Salamandra atra; redbacked salamander,P.cinereus) (Liebgoldet al.,2011;Helferet al.,2012).For Caudata,different habitat types(e.g.terrestrial-type,stream-type) might have impacts on its dispersal patterns.Combined with the female-biased dispersal ofP.shangchengensis,we think that there are multiple dispersal patterns (male-biased dispersal,female biased dispersal) corresponding to different habitat types.Therefore,for verifying the hypothesis,further research on dispersal patterns associated with habitat type may be needed.Additionally,the potential forces that facilitate or limit dispersal should also be studied to refine the understanding of the evolution of sex-biased dispersal.
AcknowledgementsWe thank Mr.Xinlei ZHAO,Mr.Liangheng YAN,Mr.Dejun XU for their help in sample collecting and data analysis; thank Ph.D.Raul E.Diaz jr.for reviewing our manuscript and polishing the English language.This work was supported by the National Natural Science Foundation of China(Grant No.31272332),Biodiversity Survey,Monitoring and Assessment Project of Ministry of Ecology and Environment China (2019HB2096001006),National Key Research and Development Program (2016YFC1200705),Anhui Province Higher Education Revitalization Plan,2014 Colleges and Universities Outstanding Youth Talent Support Program,2017 Anhui Province academic and technical leaders candidates (2017H130),Anhui Natural Science Foundation (Youth,1908085QC127),Research start-up funds of Anhui Normal University (No.751865),The Natural Science Foundation of the Jiangsu Higher Education Institutions of China (15KJB180003).
Appendix
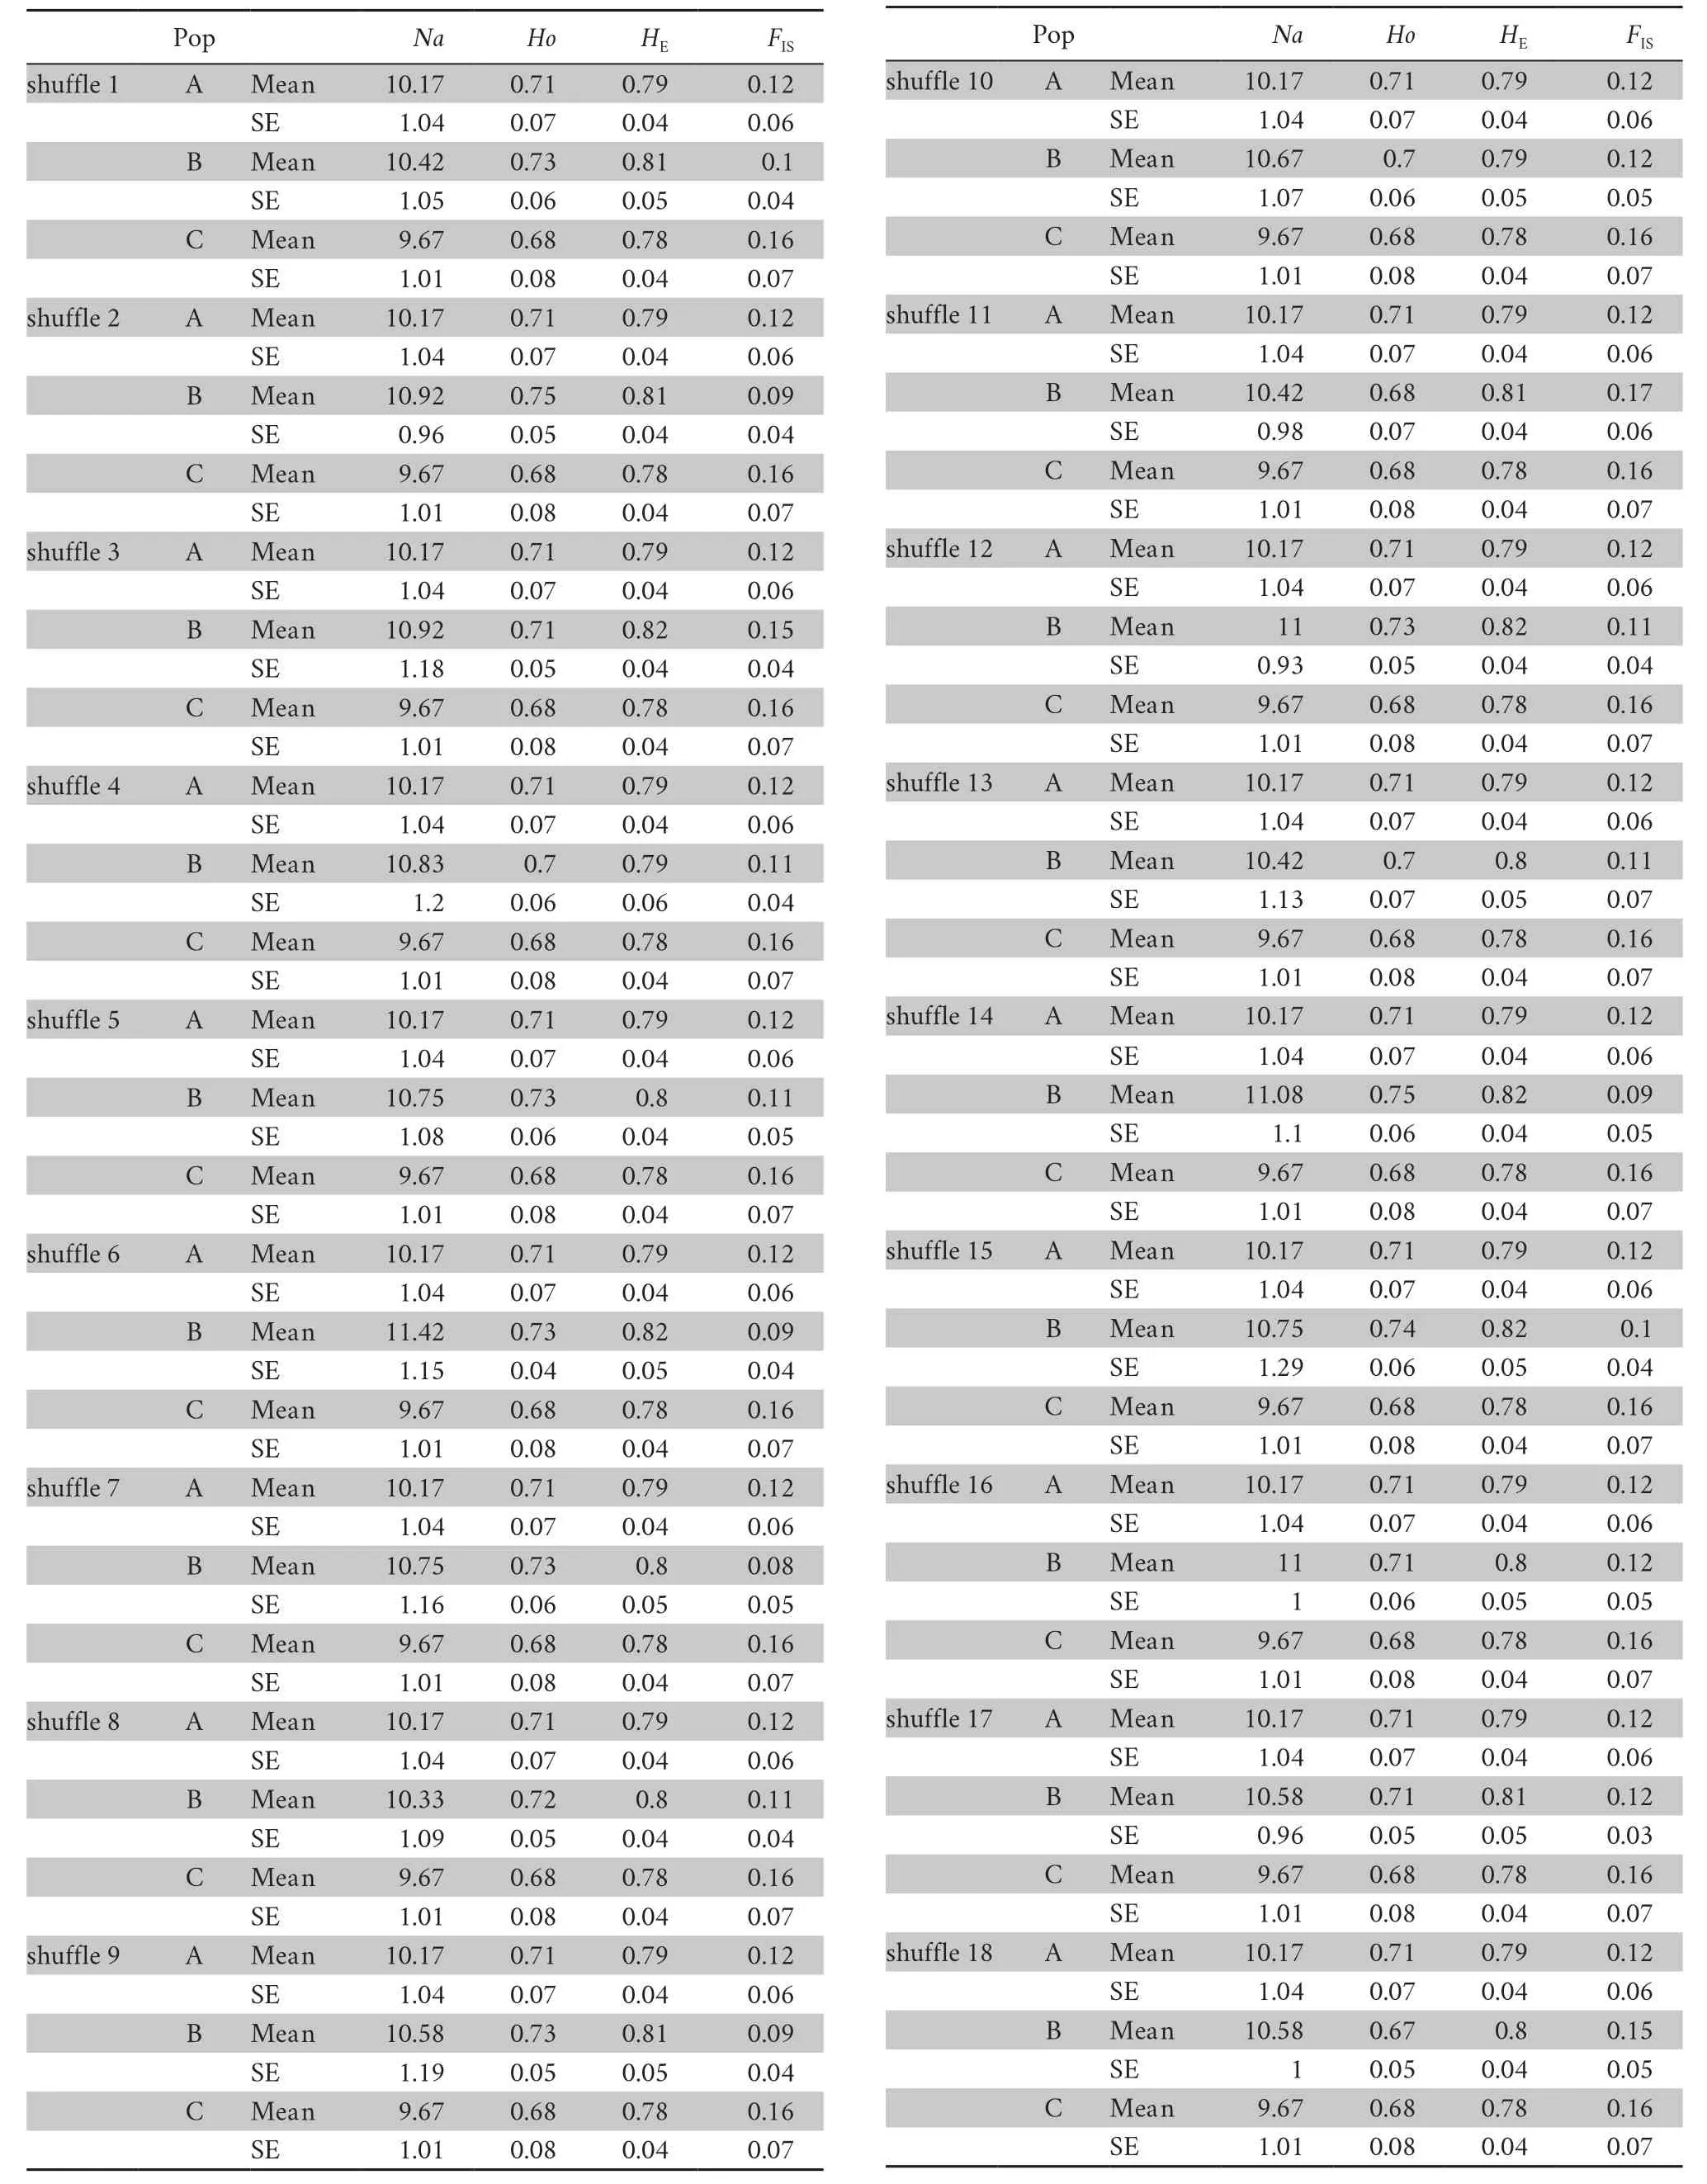
Table S1 Genetic diversity across loci of population after shuffle in P.shangchengensis from three section of river (A,B and C population) in China.

Table S2 Results of FST after shuffle calculated from hierarchical AMOVA based on microsatellites of P.shangchengensis.
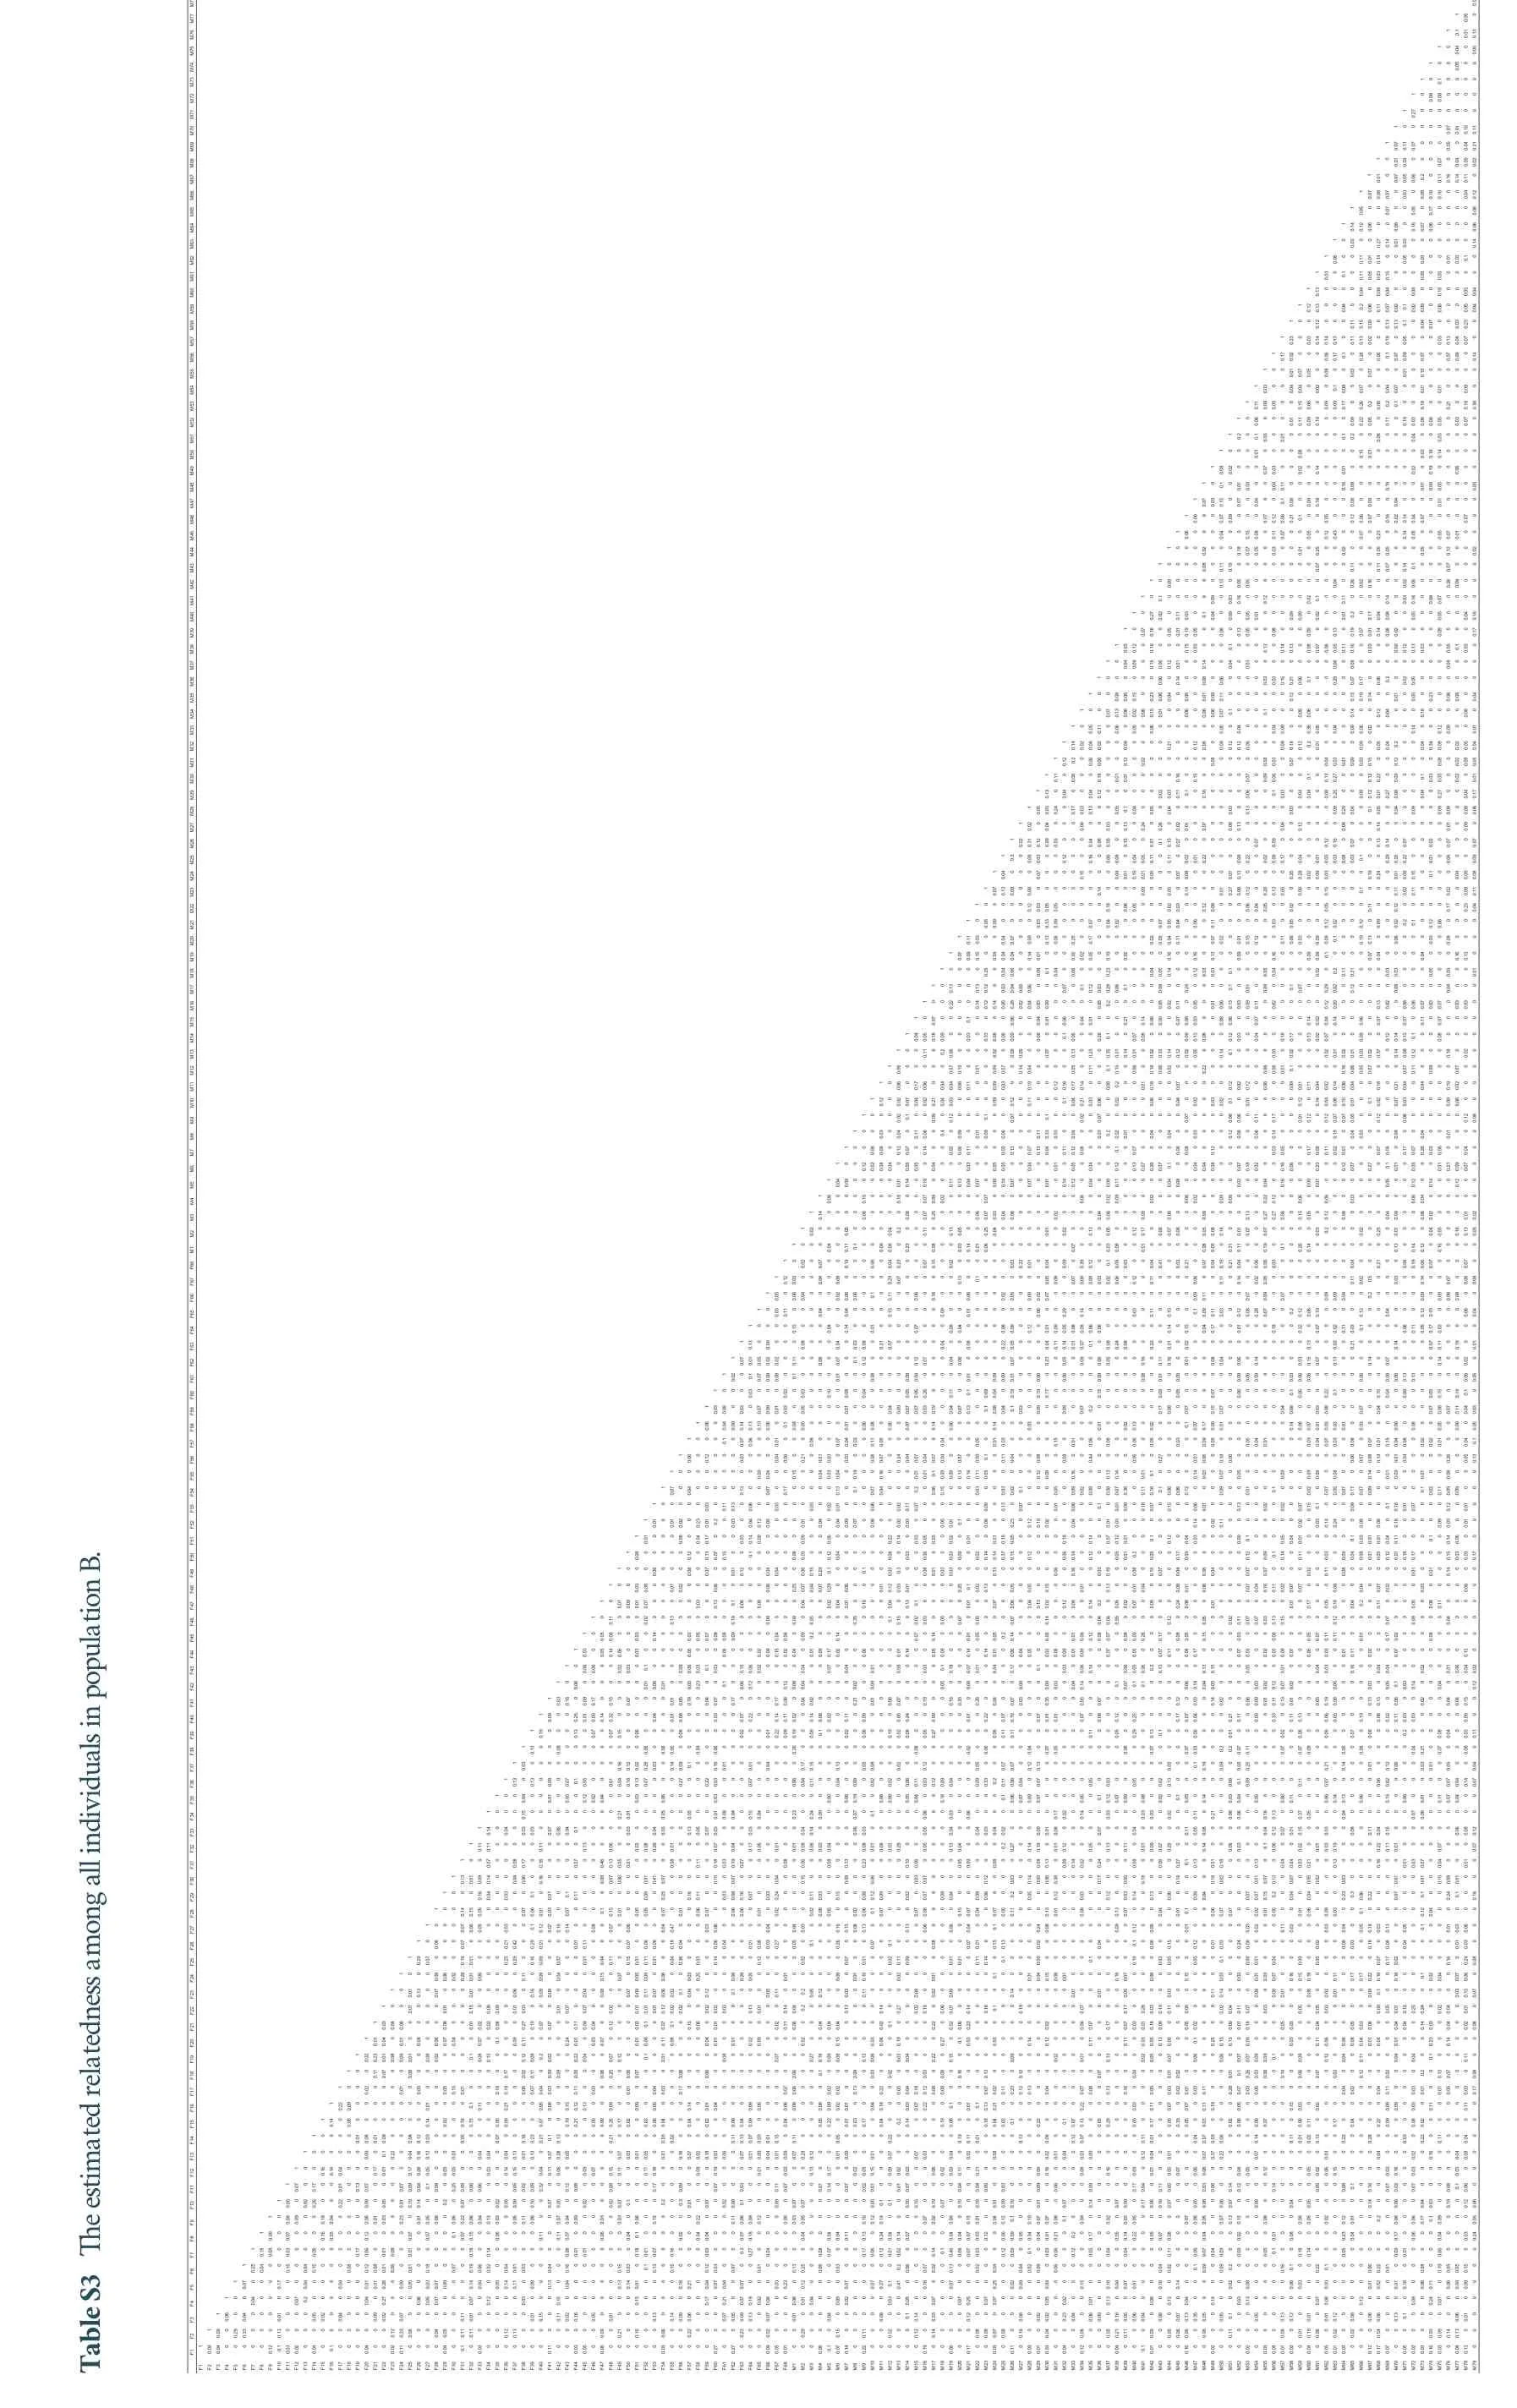
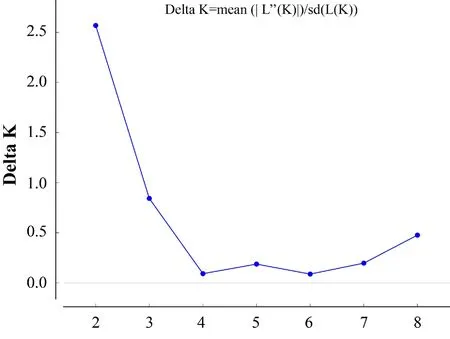
Figure S1 Plots of ΔK as a function of the number of putative groupings (K) in Bayesian population structure analysis of P.shangchengensis.
杂志排行
Asian Herpetological Research的其它文章
- Morphological Variations,Distribution and Population Estimation of Indian Spiny Tailed Lizard (Uromastyx hardwickii Gray,1827) from District Bahawalnagar,Punjab,Pakistan
- Effects of Dietary Protein Variations at Different Life-stages on Vocal Dominance of the African Clawed Frogs
- Tail Display Intensity is Restricted by Food Availability in an Asian Agamid Lizard (Phrynocephalus vlangalii)
- Flexibility as a Strategy for Avoiding Call Overlap in Male Anhui Treefrogs
- No Evidence for the Compensation Hypothesis in the Swelled Vent Frog(Feirana quadranus)
- Age and Body Size of the Shangcheng Stout Salamander Pachyhynobius shangchengensis (Caudata:Hynobiidae) from Southeastern China
